Bulletin – October 1997 Recent Trends in Superannuation Fund Assets
- Download 36KB
The assets of superannuation funds have increased rapidly in the 1990s. Along with managed funds more generally, this growth has been considerably faster than the growth of assets of financial intermediaries. In large part, the rapid growth is attributable to the high earnings rates of superannuation funds. While rising fund inflows have also contributed to growth, they have been partly offset by a strong rise in withdrawals. This article discusses these trends.
Growth in Financial Assets
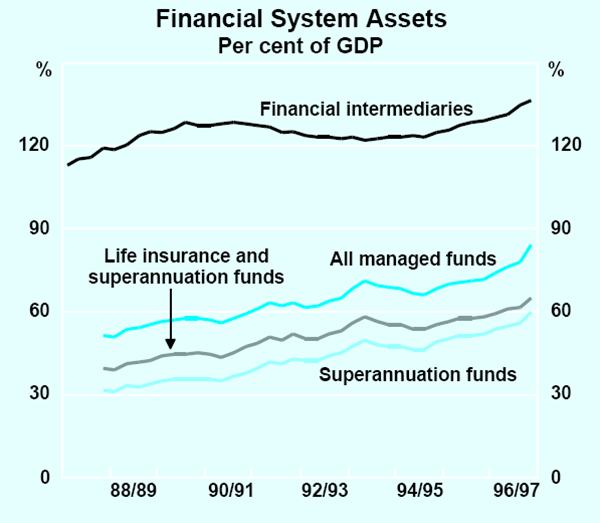
Assets of superannuation funds have increased at an average annual rate of 12½ per cent in the 1990s, and by 20 per cent over 1996/97; they are now equivalent to about 60 per cent of GDP (Graph 1). Growth in life insurance and superannuation fund assets in aggregate has been slower than that of superannuation fund assets alone, as the traditional life insurance business of life offices has been in decline relative to GDP in recent years; life insurance and superannuation fund assets increased by 17.4 per cent over 1996/97.[1] In contrast, the assets of banks and non-bank financial intermediaries have grown considerably more slowly, by an average of 5.8 per cent per annum in the 1990s and by 10.7 per cent over 1996/97. Currently, the assets of these institutions are equivalent to 136 per cent of GDP. Although superannuation fund assets are growing more rapidly than the assets of traditional financial intermediaries, banks and other intermediaries participate in the growth of superannuation to the extent that they offer superannuation products through life office and other funds management subsidiaries.[2]
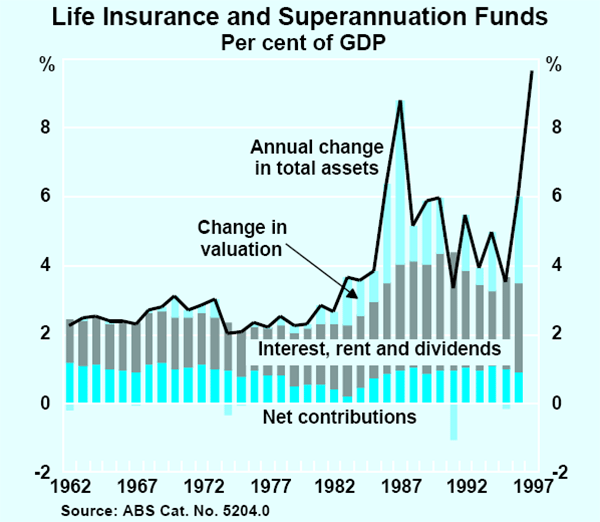
Growth in superannuation fund assets can be decomposed into growth attributable to earnings on existing assets, including valuation changes, and growth from net new contributions. The introduction of award-based superannuation in 1986 and the mandated increases in the Superannuation Guarantee Charge (introduced in 1992) have increased gross contributions to superannuation funds, but withdrawals have also risen strongly. Net contributions have grown only at the same pace as GDP in the 1990s. The annual growth rate of superannuation fund assets, however, has exceeded that of GDP over this period; currently, the annual change in superannuation fund assets is equivalent to almost 10 per cent of GDP (Graph 2). To a large extent, the rapid growth in assets in recent years is attributable to high earnings rates, which have been higher than many people had expected.[3]
The growth of assets of public unit trusts has been even more rapid than that of superannuation fund assets, at around 13.4 per cent in the 1990s and by 38 per cent over 1996/97; public unit trusts represent about 16 per cent of the managed funds sector currently. While the performance of domestic and overseas equities markets has been a major contributor to these high earnings rates, new inflows – including from superannuation funds – have also been important.
Earnings
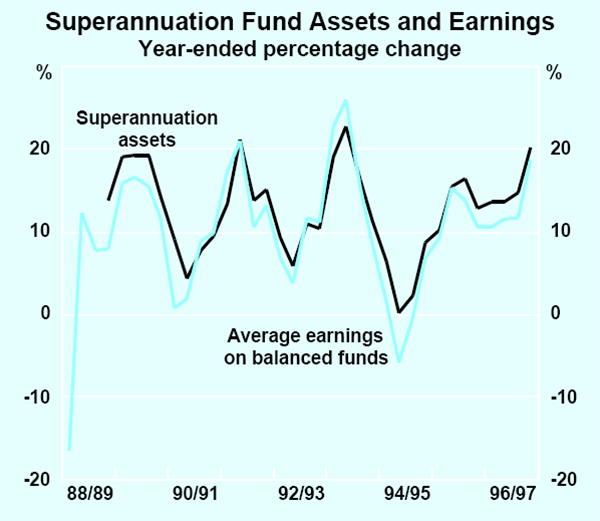
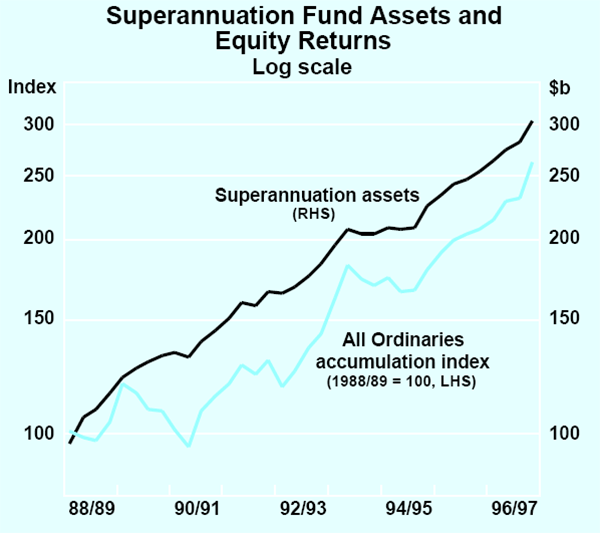
Since 1990, the earnings rates on superannuation fund assets have averaged 11 per cent per annum. This represents an average annual rate of return of over 8 per cent after inflation. The importance of earnings in accounting for growth of superannuation fund assets is suggested by the fact that growth in assets has moved closely with the return on assets achieved by balanced funds (Graph 3). Movements in share markets are a major influence on these earnings rates (Graph 4). Around half of all superannuation fund assets are invested in Australian and overseas equities, with the proportion of assets invested in overseas equities rising by 2 percentage points to 12 per cent over the past five years. The strong rises in equity prices in Australia and overseas in 1996/97 contributed to an earnings rate of about 18 per cent over that year.
The effects of changes in valuation of existing assets are not included in traditional measures of household saving, which measure flows rather than stocks, but they can represent an important part of wealth accumulation. While valuation changes can be volatile from year to year, they have been an important source of growth in superannuation fund assets since the early 1980s (Graph 2). Future earnings rates (including capital gains) of superannuation funds will be important in assessments of the adequacy of household saving rates for supporting reasonable retirement incomes.
Contributions and Withdrawals
Gross contributions to superannuation funds were on a moderate upward trend in the 1960s and 1970s, but have risen rapidly over the past 15 years. The pick-up in contributions in the 1980s is partly accounted for by increased employer contributions arising from award-based superannuation. Mandated employer contributions under the Superannuation Guarantee Charge – of 5 per cent in 1993/94, rising to 9 per cent in 2002/03 – have boosted the trend increase in gross contributions in more recent years. Contributions are currently equivalent to over 6 per cent of GDP, more than double their level in the early 1980s (Graph 5).
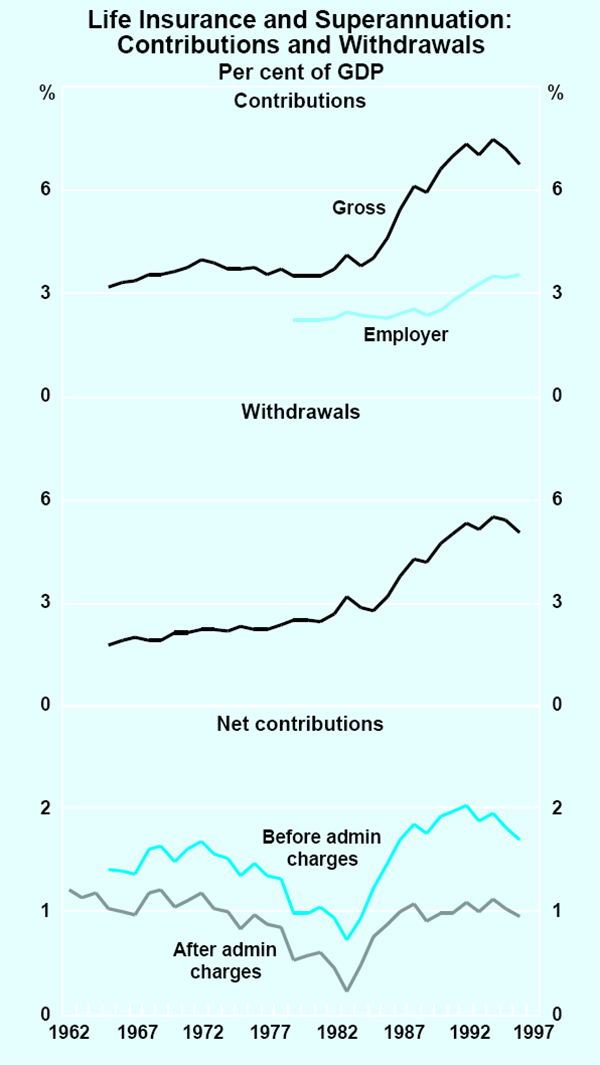
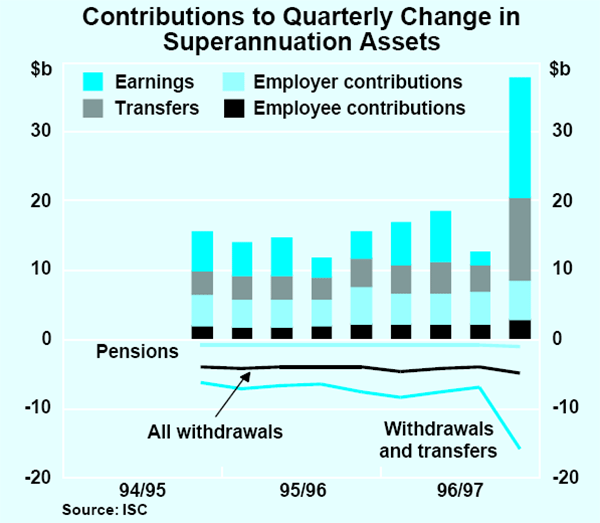
To some extent these data overstate the increase in underlying gross contributions, as they include transfer s between superannuation funds and from life insurance to superannuation funds. Transfers have risen over this period in response to the tightening of rules on preservation of benefits and the introduction of approved deposit and other rollover funds. The evolution of the system from one that was primarily employer-specific to one that, with few exceptions, is compulsory and in which employees increasingly roll over their superannuation benefits into a different fund on changing jobs has been an important factor in explaining the rise in transfers.[4]
These transfers can be quite substantial relative to employer and employee contributions and final withdrawals in the form of pensions or lump sums (Graph 6). Nevertheless, even excluding transfers, gross contributions appear to have picked up significantly from the early 1980s.
Partly offsetting much of the large increase in gross contributions has been an increase in withdrawals (Graph 5). Despite a substantial increase in coverage of the workforce, measures of net contributions as a share of GDP have been fairly steady in the 1990s. Apart from increased transfers, there are two main explanations for the increase in withdrawals:
- The strong rise in returns, and thus asset accumulation, has allowed retirees and others to make larger withdrawals. To the extent that returns exceed growth in incomes, withdrawals can rise more rapidly than contributions, which are generally defined as a fixed percentage of contributors' income. Consistent with these factors, withdrawals have been growing relative to GDP but have remained fairly steady as a share of assets of superannuation funds since the mid 1980s.
- Structural and administrative factors have led to leakages from the system. With higher-income white-collar employees – typically males – tending to have the most extensive superannuation coverage prior to the introduction of award-based superannuation, the substantial increase in the incidence of early retirement of males over the past 15 years has brought forward some withdrawals. In addition, the introduction of award-based superannuation resulted in a large number of lower-income employees accruing small balances in multiple funds. Past rules permitting the withdrawal of balances on leaving a job are likely to have boosted the dissipation of retirement savings held in superannuation funds over this period.
Another factor influencing the growth of superannuation fund assets is the extent of administrative charges, including management costs, which represent another withdrawal from the system. With ongoing administrative charges mainly a function of assets, rapid asset growth arising from the high earnings rates in the 1990s has meant that part of the rise in net contributions has been offset by administrative charges. While the ratio of administrative charges to superannuation fund assets has declined in the 1990s, as a share of GDP administrative charges have increased to close to 1 per cent since the early 1980s.
Prospects
In the past year or so, the rate of growth in superannuation fund assets has exceeded indicators of earnings by a greater margin than had been the case in previous years. This suggests a recent acceleration in the growth rate of contributions. Increases in the rates of mandated employer contributions under the terms of the Superannuation Guarantee Charge will increase gross contributions further, resulting in continued solid growth in superannuation fund assets. In addition, recent regulatory changes designed to prevent leakages of superannuation fund assets prior to standard retirement ages will enhance the preservation of these assets.
One factor that may detract from the accumulation of superannuation fund assets in the near term is that the older members of the ‘baby-boom’ generation are now around age 50. It is possible that early retirements among this cohort in the next few years could boost outflows from superannuation funds and detract from the rate of asset accumulation. On the other hand, labour-force participation rates for males in the 55–64 age group appear to have stopped falling.
Footnotes
Most of the ABS data on superannuation is presented as an aggregation of life insurance and superannuation fund assets. The bulk of these assets is accounted for by superannuation. More detailed coverage of superannuation statistics is available in the quarterly ISC Bulletin. [1]
Around 35 per cent of superannuation fund assets are managed by subsidiaries of financial intermediaries. In addition, the introduction of retirement savings accounts by financial intermediaries means that some of the growth in savings for superannuation will be reflected on the balance sheets of financial intermediaries in future, although the overall asset size of these accounts is small at present. [2]
The existence of defined benefit superannuation funds implies that higher-than-expected earnings rates allow a reduction in the rate of growth of new contributions. [3]
Transfers from life insurance to superannuation funds are recorded as both contributions and withdrawals in the ABS data underlying Graph 5. [4]