Bulletin – February 2002 Recent Developments in Small Business Finance
- Download 877KB
This article focuses on recent trends in small business financing, including the interest rates and fees and charges paid by this sector.[1]
Recent Trends in the Amount of Financing
Intermediated debt
The pattern of financing for a typical small business is quite different from that of large businesses. Potential investors are often reluctant to provide funds directly to small businesses through capital markets, because information on the financial position of small firms is not always readily available. As a result, small businesses rely heavily on loans from financial intermediaries for their funding.
Over recent years, credit provided by financial intermediaries to small business has grown on average at around 5 per cent per year. But over the past year, growth has slowed sharply, to about 1 per cent. Lending to large business has also slowed sharply in recent months, though the growth rate continues to exceed that of small business lending, as has been the typical pattern in recent years (Graph 1).
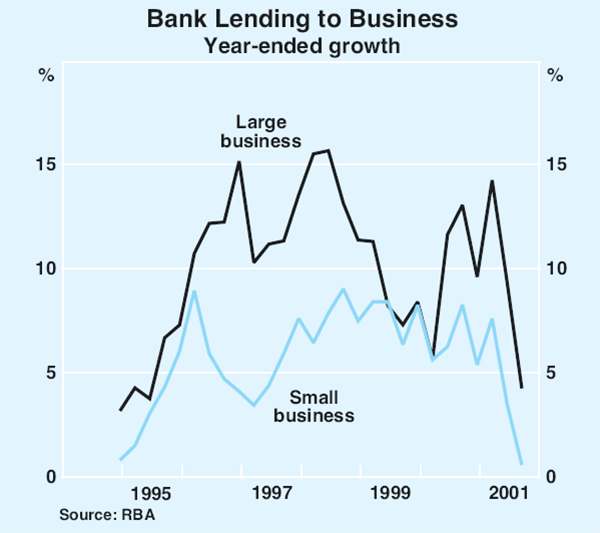
Weakness in business credit could be due either to supply factors (a reduced willingness by banks to lend), or demand factors (a reduced appetite for debt by borrowers). The evidence on these two factors is mixed. While there is anecdotal evidence of some banks being more reluctant to lend to businesses, business surveys have not indicated any greater difficulty in obtaining credit. According to the Yellow Pages survey of small businesses, lack of bank lending has not been a prime concern since early 1999. Moreover, a good part of the weakness in credit has been in the form of reduced use of overdrafts, suggesting that weaker demand for funds has played a significant part in the slowing of credit growth.
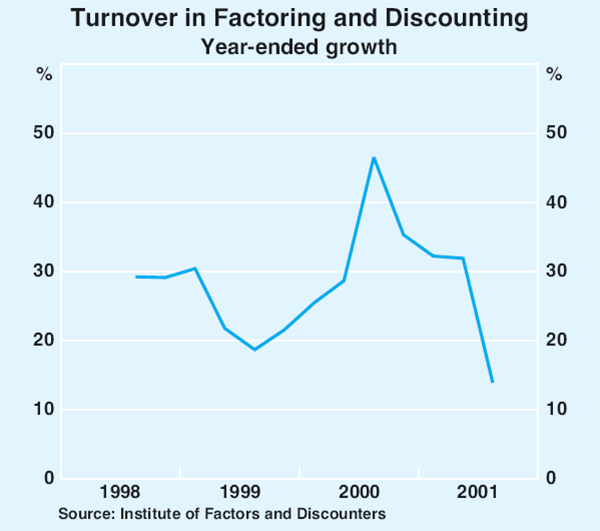
One area of business finance that has shown rapid growth over the past year is factoring and invoice discounting, also called cash flow lending.[2] The increased use of factoring to bring forward cash flow saw its year-ended growth rates approach 50 per cent after June 2000 (Graph 2). Growth rates have since eased. Despite the strong growth in factoring, it remains small relative to overall business financing. Less than 4,000 small and medium businesses use this type of financing, representing less than 0.4 per cent of all small and medium businesses.
Equity finance
Private equity markets for small to medium-sized enterprises remain limited. At least six business matching companies (which match businesses needing capital with ‘business angels’ seeking to invest, usually for a fee) have closed in the past year, including the Australian Stock Exchange's online Enterprise Market service. Others have raised only small amounts of money. Regional stock exchanges in Newcastle and Bendigo started trading in December 2000 and August 2001 respectively. The Newcastle exchange currently has two listings while Bendigo has one.
The Australian venture capital market, on the other hand, continues to record strong growth. Almost $1.4 billion was invested in venture capital investments in the year to June 2001, a 40 per cent increase from the previous year. These figures are, however, still small compared to the figures for gross small business loan approvals, which amounted to $26 billion during 2000/2001.
Despite the sharp falls in technology companies' share prices since March 2000, investments in computer-related and consumer-related industries such as computer software, Internet, electronics, communications and IT in Australia continued to grow strongly and represented almost half of all venture capital investments during the last financial year.
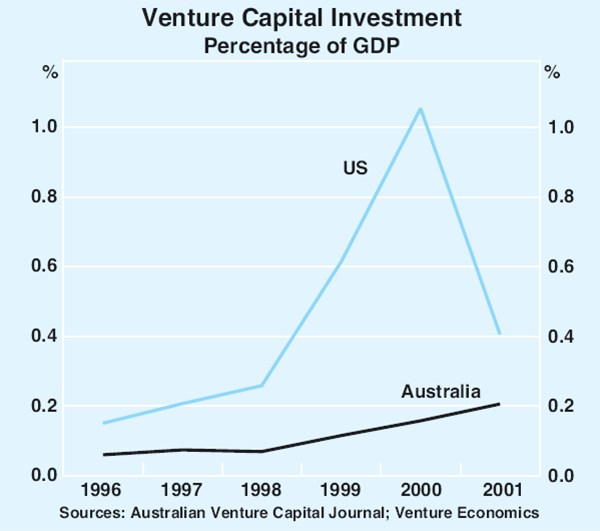
Various government programs such as the Building on Information Technology Strengths Fund and the Industry Innovation Fund have helped to increase the number of seed and start-up programs. Government assistance is considered to be particularly important for seed and start-up investment because they often involve amounts of $500,000 or less, which is considered too small an investment by venture capitalists. The relatively small size of the Australian venture capital market, and a lack of the overheating evident in the US market in 2000, suggest that this market still has ample scope to grow. Venture capital investments on an annual basis are equivalent to about 0.2 per cent of GDP in Australia compared with about 0.4 per cent in the US, despite the big fall in the US market this year (Graph 3).
Interest Rates
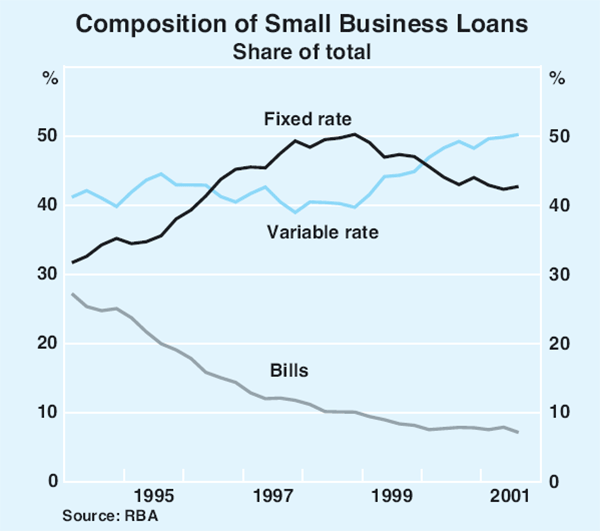
Banks have for some years marketed a number of different products to small business, the interest rate varying with the type of loan – term or overdrafts – and with the security offered by the borrower. About half of small business borrowing from intermediaries is at variable interest rates, 40 per cent at fixed interest rates and the remainder through bill lines (Graph 4).
The variety of products available makes it difficult to identify a single interest rate to summarise developments in small business finance. It is, nonetheless, possible to outline some general trends. Interest rates on variable-rate products for small business have decreased over the past year. The easing of monetary policy, which saw the cash rate fall by 2.00 percentage points over 2001 to 4.25 per cent, has been passed on almost in full to term loans[3] secured by residential property, but the pass-through has been less complete for other types of loans (Table 1 and Graph 5).
| Current level (early February 2002) |
Change since January 2001 |
Cyclical low 1998/99 |
|
|---|---|---|---|
| Small business | |||
| Residential secured: | |||
| – Overdraft | 6.80 | −1.80 | 6.95 |
| – Term loan | 6.25 | −1.95 | 6.65 |
| Other security: | |||
| – Overdraft | 7.50 | −1.70 | 7.45 |
| – Term loan | 6.85 | −1.85 | 7.05 |
| Cash rate | 4.25 | −2.00 | 4.75 |
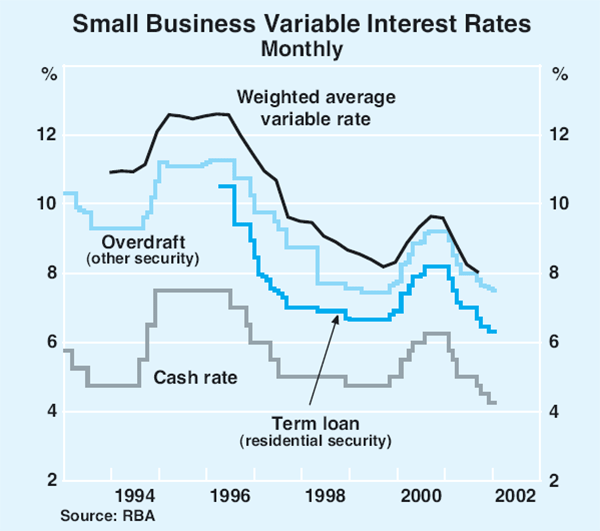
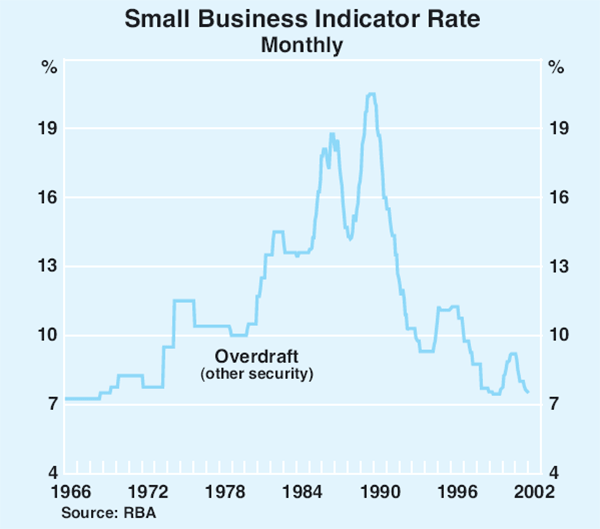
The margin between the interest rate on these other types of loans and the cash rate began to widen in the first half of 2000 as banks increased rates by more than the increases in the cash rate occurring around that time. Since 1999, the margin between small business interest rates and the cash rate has widened by as much as 55 basis points. As a result, even though the cash rate is now below its previous cyclical low in 1999, indicator rates for small business loans are now similar to, or in one case higher than, their 1999 lows. Nonetheless, seen in a long-run context, interest rates on small business loans are relatively low; apart from 2000, the current rates are the lowest since the early 1970s (Graph 6).
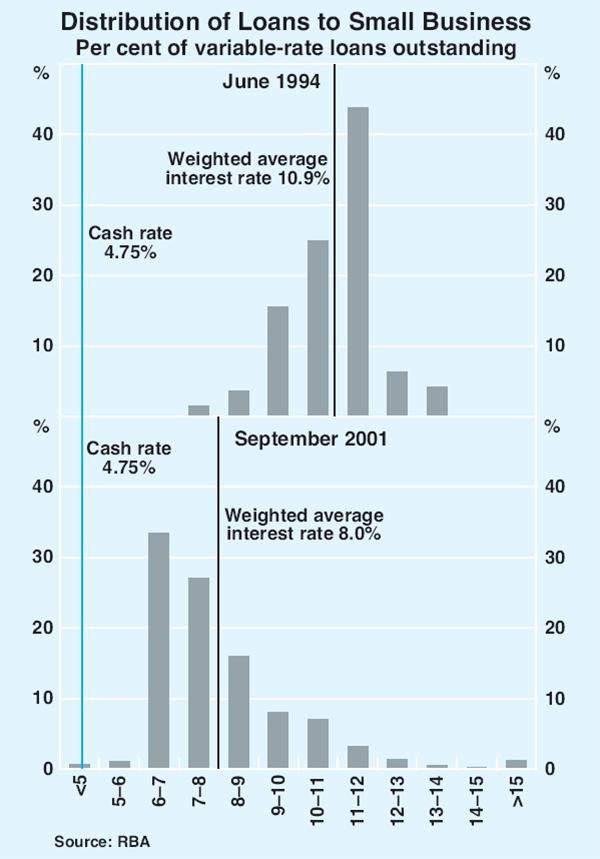
The RBA collects information from banks once a quarter that allows it to calculate the weighted average interest rate paid by small businesses across all types of variable-rate loans. The figures provided by banks include risk margins they add onto their indicator rates and represent the overall rates paid by small businesses. The weighted average variable interest rate was 8.0 per cent at the end of September (the latest available data), compared with 9.6 per cent a year earlier. This fall was a little larger than the fall in the cash rate over the same period – i.e. even though margins on some individual loan products have widened, this has not reflected in the weighted average rate paid. This is because small businesses have continued to shift their borrowing to lower-cost products offered by banks, such as loans secured by housing, or to lower-cost lenders. That is, overall the take-up of low-cost loans by businesses able to provide high-quality security has more than offset the increase in margins paid by other small businesses.
Graph 7 shows the distribution of interest rates paid by small businesses on variable-rate loans as at September 2001. The most common variable interest rate paid was between 6 and 7 per cent. This is the interest rate range that encompasses most residentially-secured products offered by banks.
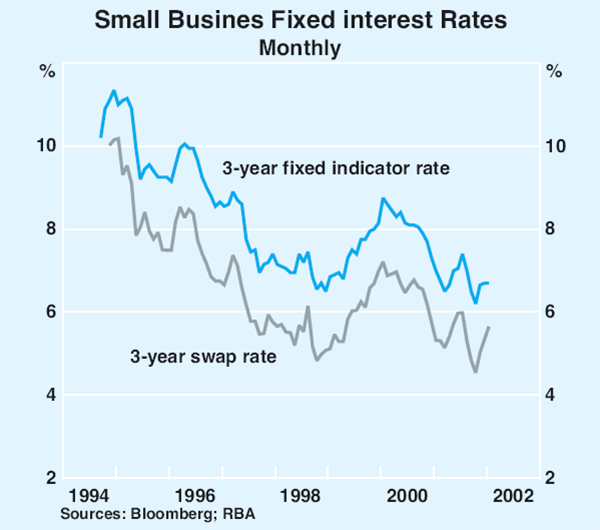
Most fixed-rate borrowing tends to be for terms up to five years, with three years being the most popular term. The interest rate on 3-year loans has fallen by 2 percentage points since its peak of early 2000 and is now slightly above its low point of 1998 (Graph 8). Banks tend to move their fixed interest rates to reflect movements in yields in the wholesale capital markets where these loans are funded.
Bank Fees and Charges
Details of aggregate fees banks collected from small businesses are set out in Table 2. Aggregate fee income from small businesses grew by 11 per cent in 2000, slightly slower than the average annual growth rate since 1997. Most of the growth in fees in the latest year came from merchant service fees that banks earn from card transactions. These have grown broadly in line with growth in turnover on credit cards, which in turn reflects the increasing use of credit cards as a medium for making payments.
| 1997 | 1998 | 1999 | 2000 | Change in 2000 |
Average growth from 1997 to 2000 |
Share of total business fees in 2000 |
||
|---|---|---|---|---|---|---|---|---|
| $ million | Per cent | |||||||
| Deposits | 165 | 207 | 226 | 271 | 20 | 18 | 7 | |
| Loans | 514 | 623 | 634 | 643 | 1 | 8 | 16 | |
| Bank bills | 292 | 271 | 264 | 279 | 5 | −2 | 7 | |
| Merchant fees | 484 | 624 | 733 | 913 | 25 | 24 | 22 | |
| Other fees | 95 | 129 | 150 | 131 | −13 | 12 | 3 | |
| Total | 1,550 | 1,854 | 2,008 | 2,236 | 11 | 13 | 54 | |
|
Source: RBA |
||||||||
Fees from small business lending (including bills) grew 3 per cent in 2000, slightly slower than the growth in credit outstanding over the same period and consistent with the decline in fees on individual loans over the four years to 2000 (Table 3). More recently, banks have increased establishment and account-keeping fees. These increases are, however, small relative to the declines seen since the mid 1990s.
| Loan size $100,000 | Loan size $500,000 | ||||||
|---|---|---|---|---|---|---|---|
| 1997 | 2000 | 2001 | 1997 | 2000 | 2001 | ||
| Loan establishment fee ($) | 925 | 738 | 755 | 4,475 | 3,275 | 3,930 | |
| Overdraft fee (% pa) | 1.12 | 0.93 | 0.95 | 0.93 | 0.57 | 0.57 | |
| Term loan fee (% pa) | 0.37 | 0.45 | 0.46 | 0.15 | 0.17 | 0.18 | |
|
Source: Reserve Bank estimates based on information provided by banks |
|||||||
Fees charged for running a business transaction account have changed little over the past year (Table 4). An exception was the cost of periodic pay deductions to other banks, which rose 8 per cent. Trends evident over recent years have continued. ‘Old technology’ transactions such as cheques are continuing to increase in cost, while newer methods of conducting banking, such as telephone and PC transactions, have fallen. These latter transactions cost only about one-third that of cheque transactions.
| 1994 | 1998 | 2000 | 2001 | |
|---|---|---|---|---|
| Number of free transactions (per quarter) | 90 | 110 | 105 | 105 |
| Cheque withdrawal ($ per cheque) | 0.23 | 0.39 | 0.44 | 0.46 |
| Telephone transactions ($ per transaction) | na | 0.36 | 0.18 | 0.17 |
| Internet transactions ($ per transaction) | na | 0.25 | 0.16 | 0.15 |
| Account-keeping fee ($ per quarter) | 33 | 30 | 30 | 30 |
| Periodic pay deduction ($ per deduction) | ||||
| – own bank | 1.30 | 1.63 | 1.63 | 1.63 |
| – other bank | 2.20 | 2.95 | 2.95 | 3.20 |
|
Source: Cannex |
||||
Footnotes
It is difficult to define a small business precisely. Data presented here on borrowings and weighted average interest rates are based on the assumption that only ‘small’ businesses borrow less than $500,000 at a time. Other data presented here are based on individual banks' classification of businesses. See ‘Box A: Small Business in the Economy’, May 2001 Statement on Monetary Policy for further discussion of what constitutes a small business. [1]
Invoice discounting is where a financial institution (the factor) lends to a business against the security of its trade receivables (typically up to 80 per cent of the value of the receivables) at rates similar to an overdraft facility. When the receivable is paid, the loan is repaid. Factoring is the same, except that the factor takes an active role in collecting trade payments. [2]
Term loans are structured very much like a standard residential mortgage, i.e. the interest rate can be variable or fixed and repayments cover principal and interest costs over the life of the loan. However, business loans usually have a shorter term (between 10 and 15 years) than residential mortgages. [3]