Bulletin – October 2003 Changes to the Reserve Bank of Australia's Index of Commodity Prices
- Download 62KB
Introduction
Australia's export earnings make up around 20 per cent of total domestic income on average, and thus have a significant influence on economic activity. The Reserve Bank of Australia's monthly Index of Commodity Prices is designed to provide a timely indicator of movements in the prices of primary commodities, which account for more than half of Australia's export earnings. The Index is constructed as a Laspeyres index of the prices of 17 of Australia's major commodity exports, and is currently weighted by export values in the 1994/95 base period.[1] These 17 commodities account for around three-fifths of primary commodity export earnings. From time to time changes to the Index are required to ensure that the commodities included in the Index remain representative of Australia's exports, the price measures used reflect the actual prices received for these exports, and the weights given to commodities reflect their relative importance to export earnings. This article reports on the changes that will be made to the Index commencing with the release of the Index for October on 3 November 2003. These changes can be summarised as follows:
- canola and alumina will be added to the Index;
- the price measures for beef and veal and for iron ore will be changed; and
- the Index will be re-based from 1994/95 to 2001/02.
Overall, these changes will not substantially alter the movements in the Index over recent years.
Changes to the Coverage of the Index
While the share of primary commodities in Australia's exports has remained roughly stable at around 55 per cent since the mid 1990s, the mix of commodities has changed somewhat. The share of canola in export receipts increased almost ninefold between 1994/95 and 2001/02, so that it has become more important than rice and lead in recent years. Thus, a monthly average price of canola, calculated from ABS exports data, will henceforth be included in the Index. Alumina has been one of Australia's top 10 primary commodity export earners for some years. A monthly average price for alumina exports can be calculated from ABS data, and this price will also be added to the Index.
Changes to Prices Included in the Index
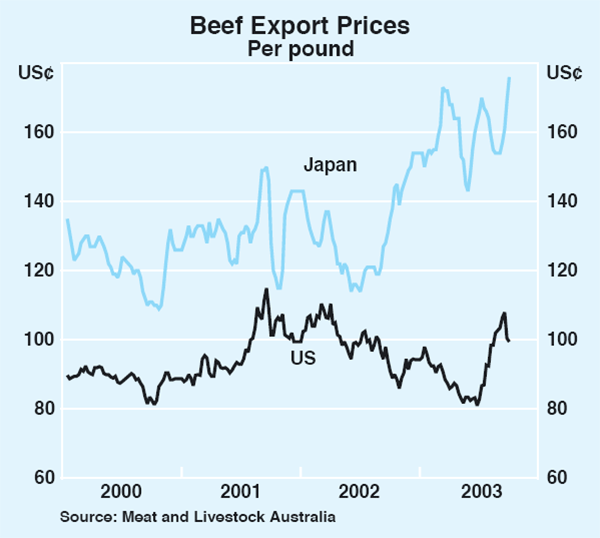
Currently, the price of beef and veal included in the Index is that of a particular type of beef exported from Australia to the US. While the US is a major destination for Australian beef exports, so too is Japan, with exports to each of these destinations comprising around one-third of total beef exports. Movements in beef export prices to the US and Japan can differ markedly at times, owing to country-specific factors (Graph 1). Thus, a simple average of the prices received for beef exports to the US and Japan provides a more representative measure of actual prices for Australian beef exports. This average price will now replace the earlier single-market measure.

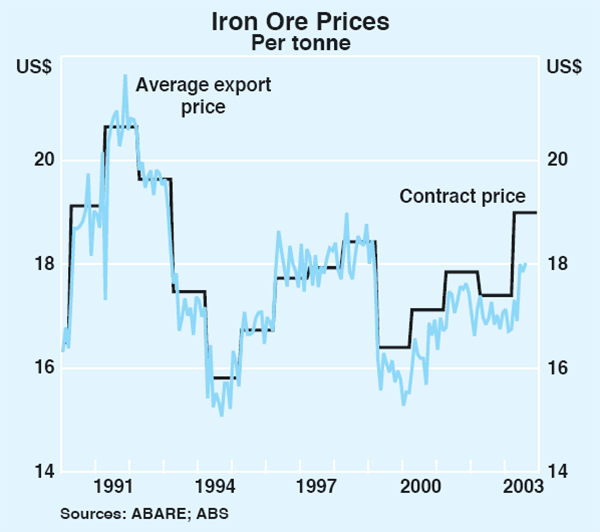
The iron ore price currently included in the Index is an annual contract price for iron ore ‘fines’ exported to Japan. However, the increasing share of ‘lump’ ores in Australia's iron ore exports has reduced the relevance of this price measure (Graph 2). Henceforth, the iron ore price measure in the Index will be a monthly average export price, calculated from ABS data.

Re-basing the Index
The importance accorded to each of the commodities included in the Index currently depends on their share of export values in 1994/95. Periodically, the base period for the Index is updated to adjust the weights in line with changes in the composition of Australia's exports. From November, export values in 2001/02 will be used to calculate new weights for the components of the Index. These will be used to revise the Index back to July 2001; movements in the Index prior to that date will be based on the Index as currently constructed.
The current and new weights are shown in Table 1. The decline in the weight for rural commodities in the Index is largely a result of the decline in the importance of export earnings for wool and sugar between 1994/95 and 2001/02.
| Current weights | New weights | Change | |
|---|---|---|---|
| 1994/95 | 2001/02 | Percentage points | |
| Rural commodities | 33.2 | 29.1 | −4.1 |
| Wheat | 5.5 | 8.3 | +2.8 |
| Beef and veal | 9.6 | 7.9 | −1.7 |
| Wool | 8.6 | 4.1 | −4.5 |
| Cotton | 2.3 | 2.8 | +0.5 |
| Sugar | 5.2 | 2.5 | −2.8 |
| Barley | 1.0 | 1.9 | +0.9 |
| Canola | – | 1.0 | +1.0 |
| Rice | 1.0 | 0.5 | −0.5 |
| Base metals | 15.0 | 15.7 | +0.7 |
| Aluminium | 8.6 | 8.1 | −0.5 |
| Copper | 2.7 | 2.8 | +0.0 |
| Nickel | 1.4 | 2.6 | +1.2 |
| Zinc | 1.2 | 1.5 | +0.2 |
| Lead | 1.1 | 0.7 | −0.3 |
| Other resources | 51.8 | 55.3 | +3.4 |
| Coking coal | 13.8 | 14.7 | +0.9 |
| Steaming coal | 9.4 | 9.7 | +0.3 |
| Gold | 16.3 | 9.4 | −6.9 |
| Iron ore | 9.3 | 9.3 | +0.0 |
| Alumina | – | 7.4 | +7.4 |
| LNG | 3.0 | 4.8 | +1.8 |
| * Based on export values | |||
The relative importance of other resources in the Index has increased since 1994/95, resulting mainly from the addition of alumina to the Index, but also from increased export earnings from energy commodities. Partly offsetting this, the weight of gold in the Index has decreased substantially, reflecting a decline in the prices received for gold exports since the mid 1990s.
The share of base metals prices in the Index has also increased, owing largely to a significant increase in Australian production and exports of nickel.
The New Index
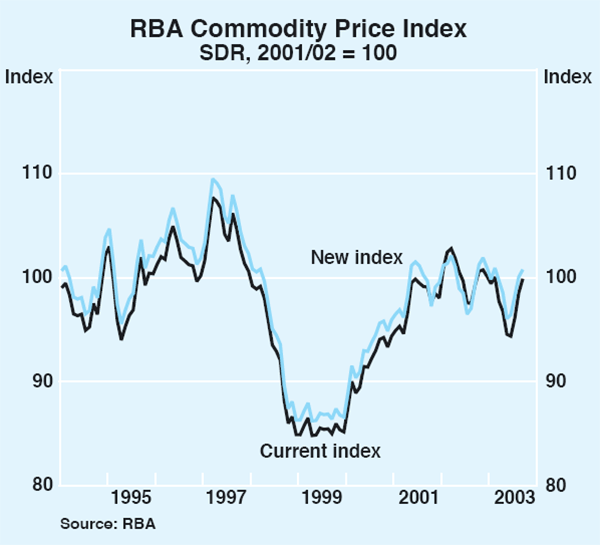
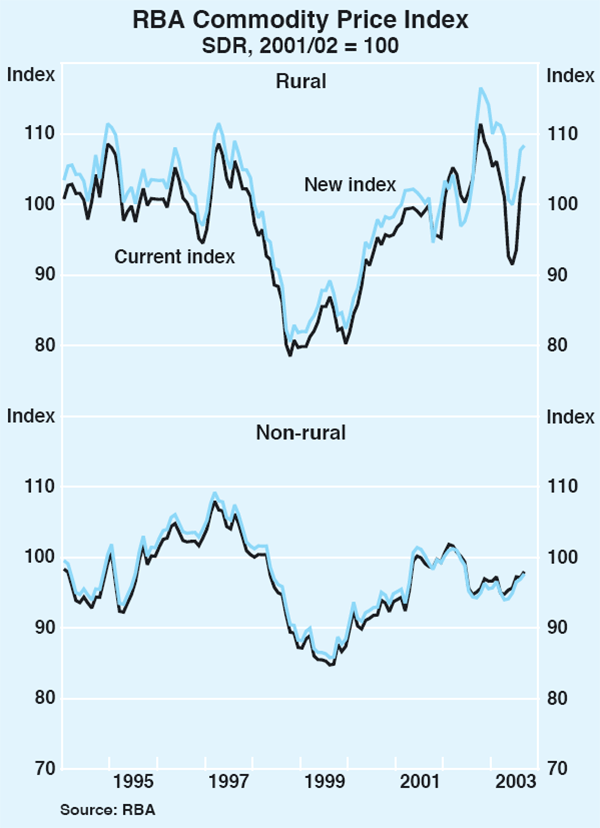
These changes will not substantially affect the movements in the Index over recent years, though the slight downward trend since mid 2001 will become even less apparent (Graph 3). This follows from a more pronounced upward trend in the rural index over the same period (Graph 4). This difference is due largely to the incorporation of the price of beef exports to Japan (which have risen somewhat over this period) in the measure of beef prices. The change in weights associated with the new base period also has an important effect. For example, wheat – the price of which rose sharply during the drought in 2002 – has a much higher weight in the new Index.


Footnote
For a detailed discussion of the construction of the Index see ‘Modifications to the Reserve Bank of Australia's Commodity Price Index’ in the Bank's September 1998 issue of the Bulletin. [1]