Bulletin – April 2006 Recent Investment and Saving Trends Within East Asia[1]
- Download 56KB
Since the mid 1990s, the global distribution of current account balances has changed substantially. Along with the sharp increase in the current account deficit in the US, there has been a significant widening of the current account surpluses in many countries, including Japan, China and the major oil producers. In addition, there has been a marked shift from persistent current account deficits to large current account surpluses in the rest of the east Asia region, which for the current purpose is defined as comprising Hong Kong, Indonesia, Korea, Malaysia, the Philippines, Singapore, Taiwan and Thailand. The large movements of the current account positions in this region have mainly reflected reductions in its investment to GDP ratio; the change in the region's saving ratio has had only a small effect. This trend has attracted considerable attention, including whether the region's investment spending can be raised.[2]
This article discusses the saving and investment patterns since the 1980s in the ‘other east Asia region’ going beyond the aggregates to focus on the sectoral make-up of investment in each country. It shows that much of the ‘boom and bust’ cycle can be traced to construction investment and, to a lesser extent, to a recent decline in machinery and equipment investment in the region. Looking forward, it seems unlikely that overall investment will soon return to the peak levels seen earlier. If the level of saving also remained high, the region's current account surplus would therefore persist.
Current Account Balances in the Region
Economic theory suggests that developing regions, such as east Asia, are likely to run current account deficits. As developing countries generally have smaller amounts of capital relative to labour, and thus relatively high returns to physical investment, capital is expected to flow from developed to developing economies. For much of the 1980s and 1990s, the other east Asia region followed this pattern, recording successive current account deficits except for a few years in the late 1980s (Graph 1). However, since the Asian crisis in 1997–98, the region has consistently recorded current account surpluses that have averaged around 5 per cent of GDP (around US$110 billion in 2005), a turn-around of 7 per cent of GDP compared with the period before the onset of the Asian crisis.
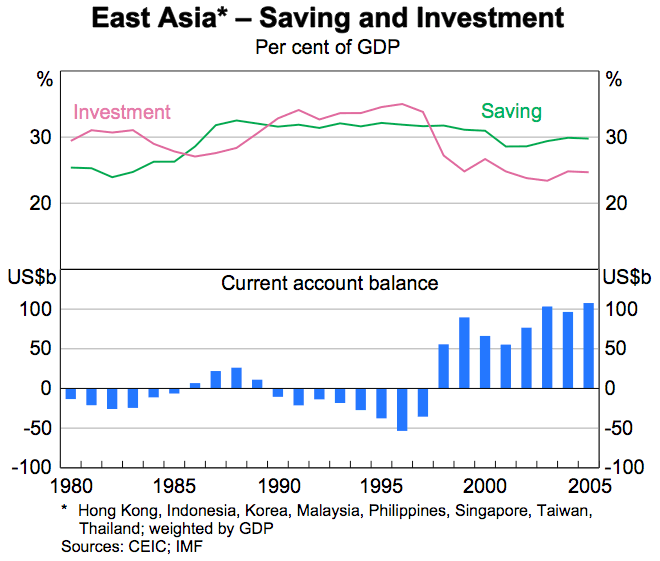
A change in a country's current account position can reflect either a change in national saving, a change in the level of investment, or some combination of the two. Fluctuations in the region's saving ratio have recently had only a relatively small effect on its current account balance. After averaging 25 per cent of GDP in the early 1980s, the saving ratio in this region increased, plateauing at 32 per cent of GDP during the first half of the 1990s. But following the Asian crisis, the saving ratio in the other east Asia region declined only marginally, as government spending was curtailed and households maintained high rates of saving in the face of lower economic growth and the absence of extensive social assistance systems. In 2005, the region's saving ratio was around 30 per cent of GDP.
Investment in the other east Asia region declined in the early 1980s, falling from 30 per cent of GDP to a low of 27 per cent of GDP in 1986. Thereafter, like the saving ratio, investment increased, peaking at 34 per cent of GDP in the mid 1990s. Following the onset of the Asian crisis, this investment boom ended rapidly, capital fled Asia, and the financial sector came under severe strain as currencies depreciated and non-performing loans increased rapidly. The investment ratio fell steeply to reach 25 per cent of GDP by the turn of the century, where it has since remained.
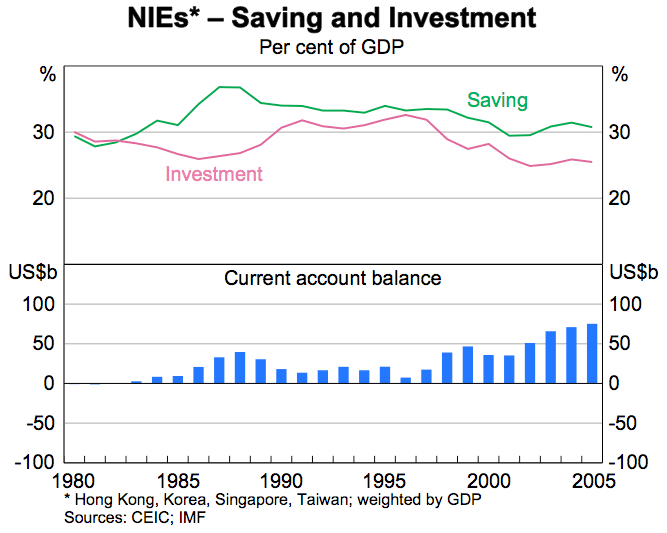
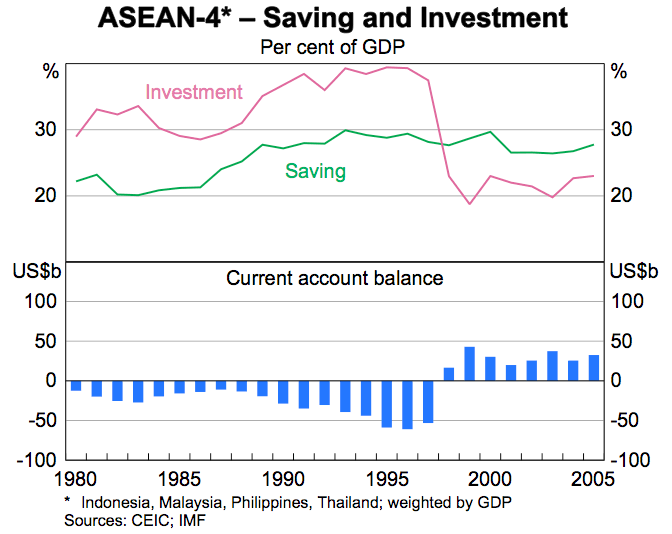
Looking at the region in more detail, some differences can be seen between countries. The region's current account deficits in the 1980s and early to mid 1990s were primarily driven by the ASEAN-4 (Indonesia, Malaysia, the Philippines and Thailand). The newly industrialised economies (Hong Kong, Korea, Singapore and Taiwan, which together have a GDP much larger than that of the ASEAN-4) recorded a small annual surplus throughout this time (Korea was the only country in this group with a deficit; Graphs 2 and 3). Nonetheless, the saving and investment trends across the two groups were broadly similar: each experienced an increase in its saving and investment ratios during the 1980s and 1990s and a subsequent decrease, although the fall in the investment ratio was much larger in the ASEAN-4 group. The shift to a substantial current account surplus since the late 1990s occurred in both groups, and in all countries.
Investment in Detail
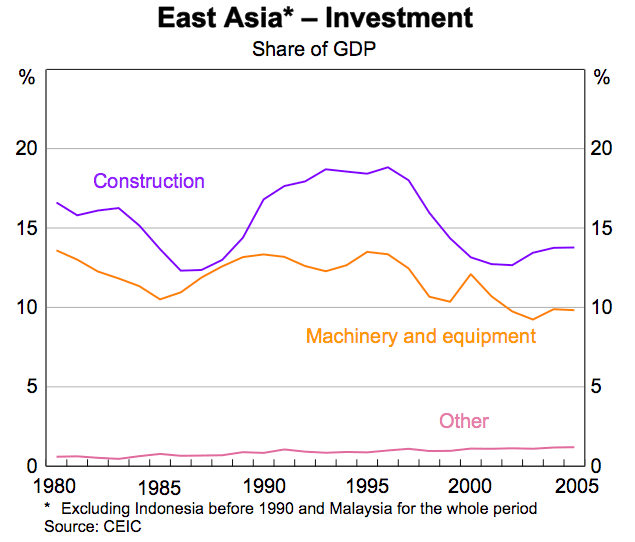
The movements in the investment ratio in the other east Asia region over the past decades have, in large part, been dominated by changes in the level of construction investment, which accounts for well over half of total investment (of which around one-third is residential construction investment). Machinery and equipment investment spending has had a less pronounced cycle (Graph 4). The small ‘other investment’ category, which is mainly breeding livestock and intangibles, has been broadly constant at around 1 per cent of GDP. These trends are discussed below.
Construction investment
The level of construction investment in the region has been fairly volatile. After falling to a low of 12 per cent of GDP in the mid 1980s, construction investment increased sharply through the 1990s, peaking at 19 per cent of GDP just before the Asian crisis. In retrospect, much of this spending appears to have been relatively unproductive. In some countries, long-term infrastructure projects built during this period have underperformed, such as several toll roads. In addition, a large part of the 1990s construction boom was for residential building, particularly in Indonesia, Thailand and Singapore, and significant real estate speculation in these countries spread quickly to retail and office buildings.
The decline in construction investment began in Thailand in early 1997 when a large real estate company defaulted on its foreign debt, and spending in the rest of the region declined quickly throughout 1997 and 1998. Construction investment fell to around 13 per cent of GDP by 2000 and, given the oversupply of office and residential buildings after the earlier boom, has since increased only marginally.
The construction ‘boom and bust’ cycle affected most countries (Graph 5). Construction investment increased sharply in Korea, Indonesia and Thailand in the late 1980s and early 1990s, and the subsequent decline was especially large in Indonesia and Thailand. Construction investment has since recovered somewhat in all three countries, although this trend has been weakest in Thailand. Disaggregated investment data are not available for Malaysia, although partial indicators suggest construction investment there followed a similar trend, with the growth rate of employment in the construction industry initially rising and then falling by more than in the rest of the economy.
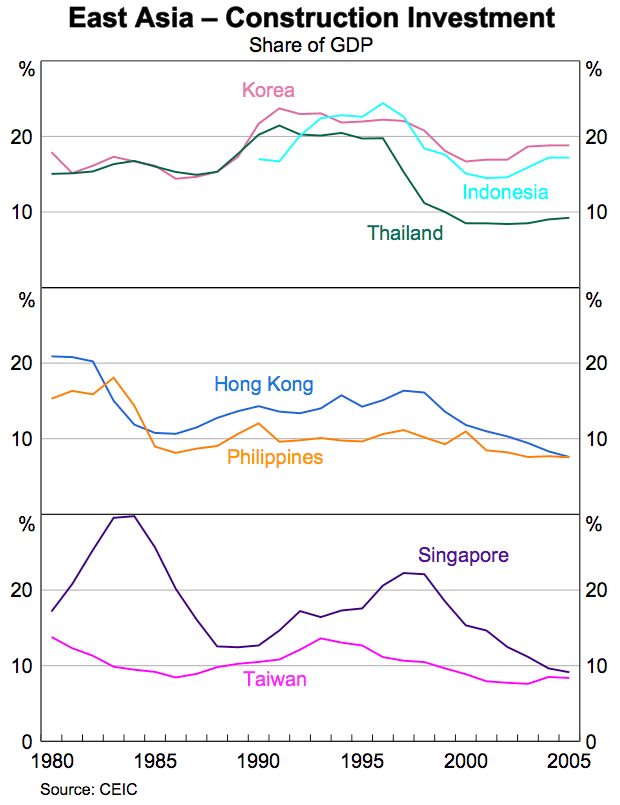
The construction cycle was also pronounced in Singapore, reflecting in part the timing of large public infrastructure projects. In contrast, the initial run-up in construction spending was more modest in Hong Kong, although the decline was large as a result of the recession following the Asian crisis. The Philippines and Taiwan largely missed the 1990s boom and thus also a sharp subsequent decline.
Other investment
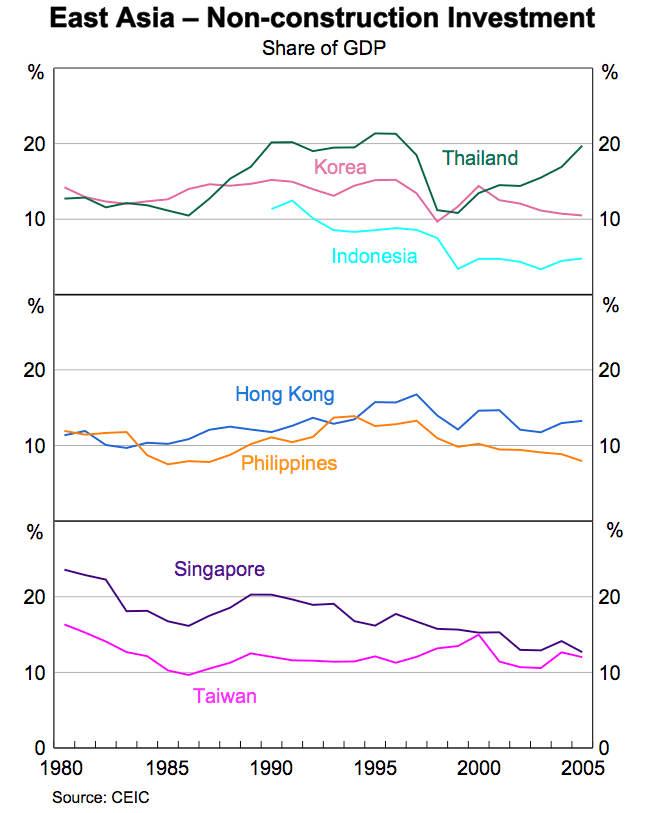
While non-construction investment (primarily machinery and equipment) also increased in most countries of the other east Asia region during the 1990s, the cycle was more moderate compared with that for construction investment. Non-construction investment declined somewhat during the first half of the 1980s, to reach around 12 per cent of GDP in the mid 1980s. Thereafter, it increased gradually, peaking at 14 per cent of GDP prior to the Asian crisis, before declining back. It is currently 11 per cent of GDP, which is the lowest level for non-construction investment for this region in over 25 years.
Thailand experienced the largest increase and then decline in non-construction investment, although its level has subsequently been on a rising trajectory (Graph 6). The cycle in non-construction investment in the other countries of the region examined here has been more moderate, with a relatively smaller increase ahead of the Asian crisis followed by a gradual decline. Unlike in Thailand, there has been little recent recovery in the level of such investment.
Conclusions
Although economic theory suggests that developing regions should have current account deficits, since the mid 1990s the aggregate current account of the other east Asia region has been in surplus. A large decline in investment has been the main factor behind this development, of which around two-thirds represents the decline in construction spending that occurred following the Asian crisis.
Looking forward, while there are reasons to expect that the region's current account surplus will decline, this will probably occur only gradually. There could be some increase in overall investment over time, although maybe not to its previous peak as a share of GDP. On the one hand, the current share of non-construction investment to GDP in the other east Asia region is low compared with its historical level. Hence, with the global economy growing above trend, there may be some increase in this type of investment over the coming years. On the other hand, the excesses in construction investment during the boom of the early 1990s have taken considerable time to be absorbed. While critical infrastructure projects seem set to proceed in some countries, the construction investment ratio for the region seems unlikely to return to the elevated levels seen in the early 1990s, at least in the near term. In regard to saving, while there is probably significant scope for consumption to increase over time, any adjustment is likely to be gradual. As a consequence, the saving ratio could continue to exceed the investment ratio in the other east Asia region for some time.
Footnotes
This article was prepared by David Orsmond and Jessica Trinder of Economic Analysis Department. [1]
For recent discussions of reasons underlying the change in global current account positions, see Bernanke B, ‘The global saving glut and the U.S. current account deficit’, Homer Jones Lecture, St Louis, Missouri, April 2005; International Monetary Fund, ‘Global imbalances: a saving and investment perspective’, World Economic Outlook, September 2005; and Macfarlane IJ, ‘What are the global imbalances?’, Reserve Bank of Australia Bulletin, October 2005, pp 19–27. See also Orsmond D, ‘Recent trends in world saving and investment patterns’ in the same issue of the Bulletin, pp 28–36. [2]