Bulletin – November 2007 Recent Developments in Collateralised Debt Obligations in Australia[1]
- Download 91KB
Introduction
The collateralised debt obligation (CDO) market has grown rapidly, both globally and in Australia, over recent years. CDOs are securities that are issued against a pool of assets that can include bonds, loans or asset-backed securities (ABS) including other CDOs.[2] Increasingly, this exposure is being created synthetically by the use of derivatives written on these assets, rather than physically holding the assets. Moreover, a growing share of CDOs have been backed by tranches of other ABS – these are known as ‘CDOs of ABs’. In the United States in particular, these products have been closely associated with the recent strains in financial markets.
CDOs are generally treated by investors as a fixed-income product in their investment portfolio and hence can usefully be compared to the purchase of a bond. Because they are issued against a pool of assets, CDOs typically have exposure to the credit risk of a number of different borrowers, whereas a bond entails an exposure to a single borrower. Therefore, CDOs can offer investors diversification and provide exposure to traditionally non-marketable assets such as corporate loans. By splitting a portfolio of loans and bonds into differently rated tranches, CDOs enable investors with different risk profiles to purchase that part of the CDO that matches their investment criteria. CDOs, like other forms of securitisation, allow credit risk to be spread across a broader range of investors.
However, the loss profiles of equivalently rated bonds and CDO tranches can differ significantly. As is the case with other ABS, CDO securities are sold in tranches, where the most senior tranche has first claim on the CDO's underlying assets, with the priority of claims decreasing to the most junior tranche. When losses arise, the value of the junior tranches can decline precipitously. Partly reflecting the different loss profiles, spreads on CDOs have tended to be higher than on equivalently rated corporate bonds. Some investors, in seeking higher returns, may have underestimated the risks of these complex securities. This article describes the various features of CDOs and compares them with other fixed-income investments before discussing the growth and nature of the CDO market.
The Structure of a CDO
CDOs are generally structured like other ABS – a special-purpose vehicle buys assets and funds these purchases by selling securities to investors. Beyond this, the form of a CDO can vary depending on factors such as the type and form of collateral as well as management style:
- A cash CDO is one where the underlying portfolio consists of physical loans, bonds and other assets, whereas a synthetic CDO creates the same credit risk exposure by the use of credit derivatives (including entering into credit default swaps).[3]
- Synthetic CDOs can be either funded or unfunded. Funded synthetic CDOs require investors to make an upfront payment at the time the CDO is purchased – similar to the upfront payment required when purchasing conventional bonds – with the proceeds invested in high-quality collateral, typically AAA-rated assets. In the event of default (or some other credit event), the collateral is liquidated and used to meet the obligations under the credit default swap. Unfunded synthetic CDOs do not require an initial cash investment at the time of purchase. Instead, investors are obliged, if a credit event occurs, to make the payments required to satisfy their obligations under the credit default swap.
- In a static CDO, once the underlying portfolio has been constructed, the pool is closed. An investor in a static CDO acquires an interest in an asset pool that, in general, remains unchanged until repayment or default. In contrast, a managed CDO allows a stipulated manager to actively manage the underlying asset pool by substituting similar assets in and out of the pool over the life of the CDO. Typically in Australia, CDOs are static rather than managed.
- Cash flow CDOs use the cash flow from the underlying assets to make payments to the CDO holders. This is generally the structure used for static CDOs. Market value CDOs meet payment obligations through a combination of income derived from the underlying assets and capital gains upon sale of the underlying assets. This is generally the structure used for managed CDOs.
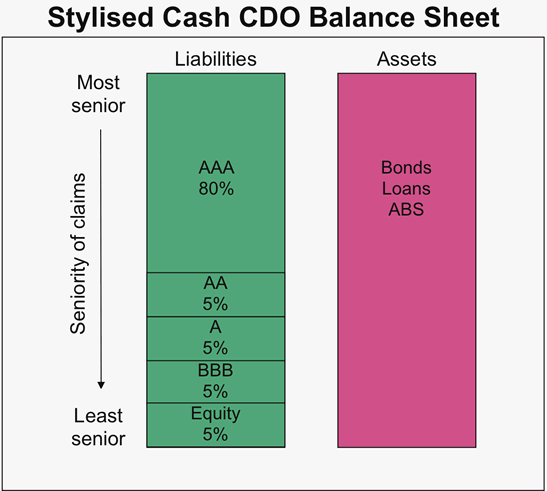
As is typical of other ABS, CDOs are issued in tranches, with the subordinated tranches absorbing any losses on the underlying asset pool before the senior tranches are affected. A stylised example of a CDO is shown in Graph 1. The unrated tranche, or the equity tranche, is often known as the ‘first loss’ tranche. It absorbs all of the initial losses until it is exhausted – in this case the first 5 per cent of losses after sale of the underlying assets – thereby providing protection to the rated tranches. The next most junior tranche – the BBB-rated tranche – is protected against the first 5 per cent of losses, but bears the full risk of the next 5 per cent of losses. If losses amount to 6 per cent of the underlying portfolio, the equity tranche would be exhausted and holders of the BBB‑rated tranche would absorb the remaining 1 per cent of losses. In other words, they would lose a fifth of their investment. The loss profile is discussed in more detail in the next section.
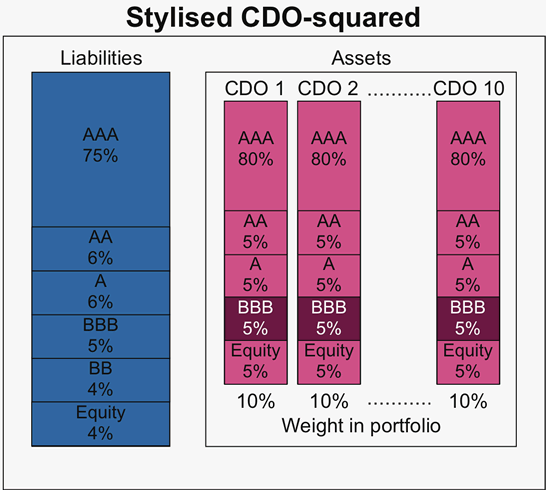
CDOs of ABS are structured in the same way as standard CDOs, except the reference pool is made up of tranches of other asset-backed securities – these can include residential mortgage-backed securities (RMBS), commercial mortgage-backed securities (CMBS) and other CDOs. A ‘CDO‑squared’ is a CDO of ABS that holds other CDOs as collateral.[4]
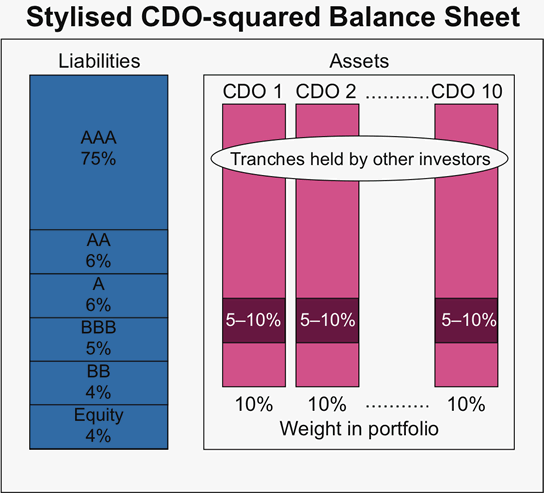
A stylised example of a CDO-squared is shown in Graph 2. The underlying assets of this CDO-squared consist of a portfolio of equal holdings of 10 tranches of other CDOs (each of which is assumed to be exposed to losses from 5 per cent up to 10 per cent of the assets of their respective CDO pools). If each of the 10 underlying CDOs incur losses of 5 per cent, the CDO-squared will not incur any losses. But if each of the underlying CDOs incur an additional 2 per cent of losses (7 per cent in total), two-fifths of the CDO-squared's portfolio will be lost, exhausting the equity tranche and all of the rated tranches except for 80 per cent of the AAA-rated tranche. The loss profiles of CDO-squareds are discussed in the Appendix.
Potential Exposure of CDOs to Losses
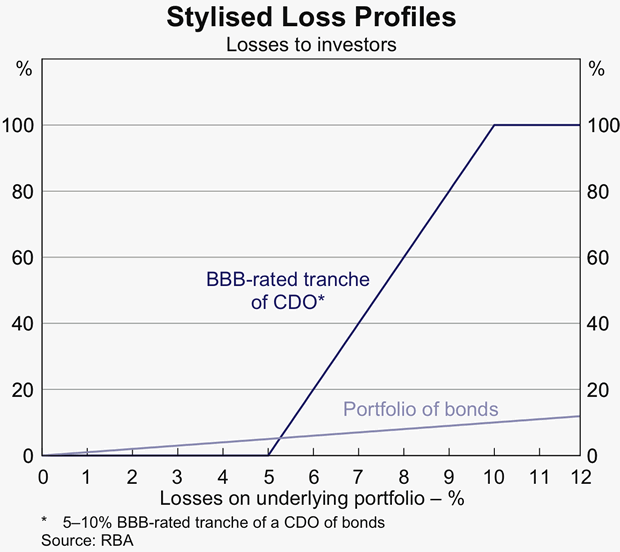
In total, the losses (if any) to investors in a CDO will be the same as on the underlying portfolio of assets. This reflects the fact that a CDO does not change the risk of the underlying portfolio; instead, the risks are merely shifted between the different tranche holders. However, the profile of possible losses of a CDO investor can differ markedly from that of an investor in the underlying portfolio due to the tranched nature of CDOs. In this section, we illustrate these differences based on a stylised example of an investor who invests in two ways: firstly, directly in a pool of corporate bonds; secondly, in a BBB‑rated tranche of a CDO backed by the same corporate bonds, which is protected against the first 5 per cent of losses on the underlying bonds, but absorbs all losses between 5 per cent and 10 per cent.[5]
If losses on the underlying portfolio of bonds amount to 5 per cent, the investment in the bond portfolio naturally suffers a 5 per cent loss of capital (Graph 3). In contrast, due to the subordination in the CDO, the investor in the BBB‑rated tranche does not suffer any loss as he is protected by the junior tranches. However, if the losses were to exceed the value of the junior tranches, the CDO investor experiences a rapid reduction in capital value. If losses on the portfolio were to increase from 5 per cent to 7½ per cent, the CDO investor would lose half his investment. Once the portfolio losses reach 10 per cent in value, the entire investment of the CDO investor is wiped out. In contrast, the investor in the bond portfolio has only lost 10 per cent of his investment at this point.
The swift reduction in the CDO investor's capital is a reflection of the embedded leverage in any tranched portfolio, compared with an untranched portfolio, of risky assets.[6] The degree of leverage is inversely related to the seniority of the tranche – junior tranches tend to have a higher degree of leverage than the senior tranches. Thus, relative to an investor in the underlying portfolio, holders of the senior tranche (AAA-rated) of the CDO are less exposed to losses, but holders of the junior tranches are more exposed to losses.
Credit Ratings of CDOs
The markedly different loss profiles of CDOs and conventional bonds complicate the comparison of credit ratings. Some rating agencies base their ratings on the probability of default while others base their decisions upon expected loss. For those agencies assigning ratings on the basis of probability of default – that is the probability of the first dollar of loss – the different loss profiles between CDOs and bonds mean that a tranche of a CDO (say BBB) is more risky than an equivalently rated conventional bond. This is because once a CDO tranche incurs any loss, it bears all subsequent losses until it is exhausted.
Those rating agencies that assign ratings on the basis of expected loss take into account both the probability of default and the loss severity in the event of default. In practice, however, this added complexity is difficult to integrate into ratings. While this methodology allows for a clearer comparison of the credit risks in CDOs versus bonds, the ratings of CDO tranches are more sensitive, compared to conventional bonds, to changes in a number of assumptions. These include the probability of default, the loss severity in the event of default and, crucially, the correlation between the losses on the various assets that comprise the pool to which the CDO refers. The result is that, even if the rating of a CDO is the same as that of a conventional bond, the risks are not likely to be the same.
Broad Characteristics of the CDO Market
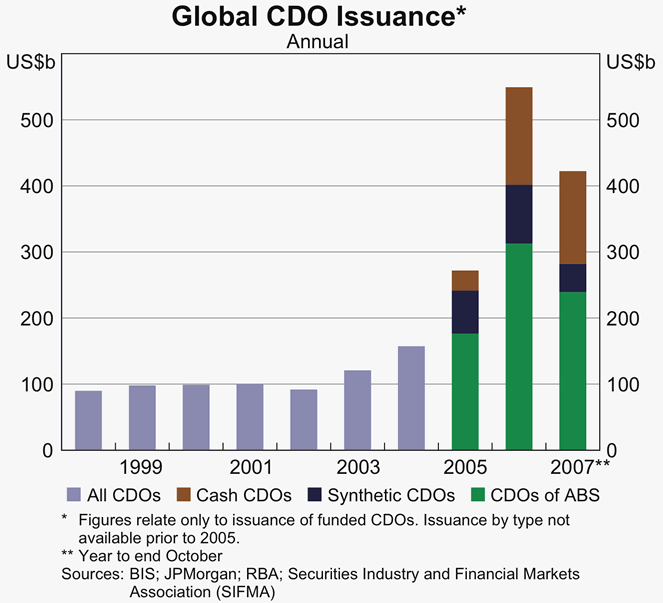
The global CDO market has experienced very rapid growth since 2002, with issuance increasing sixfold over that time (Graph 4). The Australian CDO market has grown even faster over the same time (although from a small base), rising sevenfold (Graph 5).[7] Synthetic CDOs have contributed to the majority of the growth in issuance. However, following the volatility in global credit markets over recent months, issuance has declined sharply. Globally, around US$52 billion has been issued over August, September and October, significantly lower than the monthly average of over US$50 billion over the past year, while there has been only a couple of issues in Australia.
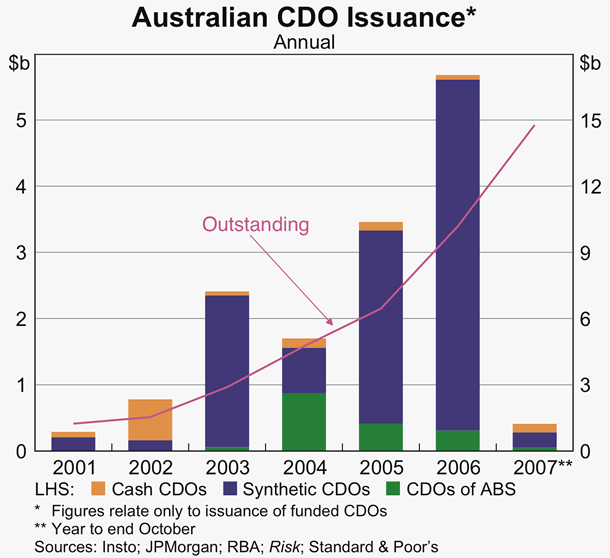
Despite the strong growth in recent years, the CDO market is relatively small both globally and in Australia. It accounts for only 2 per cent of the Australian non-government bond market in Australia (Table 1), similar to the share in the US. RMBS continue to make up the bulk of ABS in Australia, comprising 80 per cent.
| A$ billion | |
|---|---|
| Financials | 311 |
| Non-financial corporates | 133 |
| Asset-backed securities | 224 |
| Of which: | |
| – Residential mortgage-backed securities | 183 |
| – Commercial mortgage-backed securities | 12 |
| – CDOs | 15 |
| – Other(b) | 14 |
|
(a) Includes bonds issued onshore and offshore Sources: ABS; RBA |
|
Australian CDO issues are mostly backed by corporate debt, with corporate bonds and loans accounting for 57 per cent and 27 per cent respectively. The remaining 16 per cent of collateral consists of CDOs of ABS. This is a much smaller share than in the global market, where CDOs of ABS account for around 60 per cent.
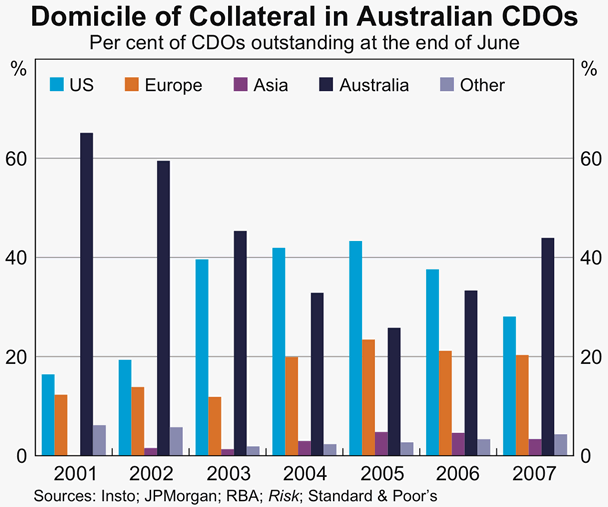
Australian debt makes up just under half of the collateral underlying domestic CDO exposure, with international credits making up the remainder (Graph 6). This largely reflects the smaller number of corporate borrowers in Australia compared with the US or Europe, with the asset pool often supplemented by international credits to obtain greater diversity. It also partly explains the strong growth in synthetic CDO issuance as international credit exposures can be more easily obtained through derivatives.
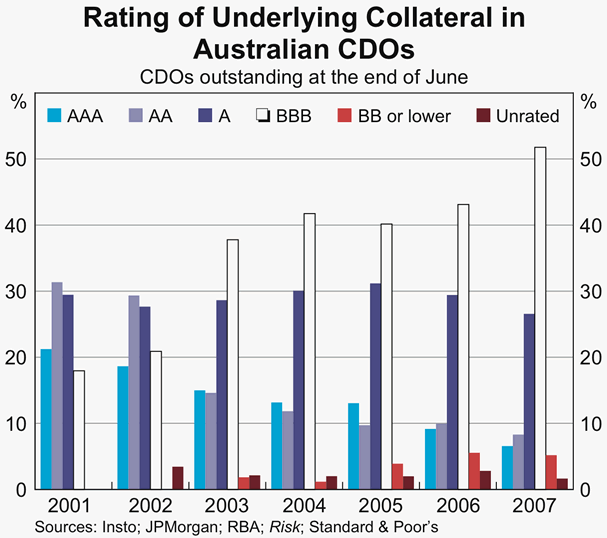
The quality of the collateral backing CDOs in Australia appears to be noticeably higher than in the US. At issuance, around 90 per cent of the bonds and loans in domestic CDOs were investment grade (rated BBB or above by S&P), with 10 per cent sub-investment grade or unrated (Graph 7). In comparison, around 55 per cent of US CDO collateral was sub-investment grade at issuance. This likely reflects the higher concentration of investment grade bond issuers in the Australian market than the US, and the tendency for Australian investors to be relatively more conservative. However, the ratings of the underlying assets in domestic CDOs (at issuance) have declined in recent years – the proportion of collateral rated A or higher has halved from over 80 per cent of all collateral in 2001 to 40 per cent in 2007.
Based on data from rating agencies, it appears that US CDOs have an average exposure to US sub-prime loans of around 30 to 35 per cent. While it is difficult to quantify the exposure of Australian CDOs to the US sub-prime mortgage market, it appears to be very low. The data that are available, which cover around 85 per cent of the Australian market, indicate no exposure. In the remaining 15 per cent of the market, which are mostly CDOs of ABS, there is likely to be some exposure to US sub-prime RMBS.
The exposure of Australian CDOs to the leveraged corporate loan market also appears to be relatively low compared with the global market, where they are estimated to represent more than a third of collateral.[8] There have only been a couple of Australian CDOs that are backed by leveraged loans, although some CDOs of ABS may again have some exposure.
Reflecting the higher quality of the underlying collateral, the ratings of Australian CDOs are also relatively high: of those CDOs currently outstanding, around two-thirds were rated AAA by S&P at issuance, an increase from 58 per cent in 2005. Because of the relatively low exposure to the US sub-prime market, no Australian CDOs have, as yet, had their ratings adjusted. The major rating agencies have all stated that there is unlikely to be any adverse ratings actions on the few Australian CDOs with exposure to the US sub-prime housing market. In contrast, since July 2007, S&P has downgraded 123 US CDOs (with a face value of US$6.2 billion) that have an exposure to US sub-prime mortgages and put a further 45 on negative credit watch.
In terms of the types of investors that purchase CDOs, the available evidence for Australia suggests a larger non-institutional investor presence than is the case in other markets, with Australian CDOs having a higher share of retail and middle-market investors than offshore CDOs. Middle-market investors include local governments, university and charity endowment funds, high net worth individuals and smaller boutique fund managers.
Over the past five years, around 20 per cent of new issuance in Australia has been taken up by large fund managers – high-yield bond funds typically buy the equity and lower-rated tranches, while standard bond funds buy the higher-rated tranches. According to market liaison, middle-market investors continue to account for the bulk of investors, taking up around two-thirds of new issuance. A large share of local governments have invested in CDOs, with data suggesting that recently just over a third of NSW local governments had an investment in CDOs. Of those identified as holding CDOs, the average holding was around 15 per cent of their investment portfolio, although the dispersion around this number is wide. Some of these councils had exposures to US CDOs that were backed by US sub-prime loans.
Primary and Secondary Market Pricing
Spreads on Australian CDOs at issuance have tended to be higher than for equivalently rated securities. Over the past year, AAA-rated CDOs have been priced, on average, at spreads to the swap rate of around 90 basis points (ranging from 17 to 190 basis points) compared with 14 basis points (ranging from –18 to 68 basis points) for AAA-rated corporate bonds.
In part, the premium reflects the fact that these ratings are based on the likelihood of the first dollar of loss, with the severity of loss given default greater for CDOs. Spreads tend to remain wide, however, even when ratings based on expected loss are included. This probably reflects investor uncertainty as to whether this added complexity has been adequately taken into account – in practice, even when rating agencies use different methodologies, there tends to be little difference in the rating. The premium also reflects other factors that make it difficult to value CDOs with much precision. These include: compensation for exposure to ‘correlation risk’ – credit ratings for CDOs are highly sensitive to changes in the estimated correlation of default on the underlying assets, which is difficult to estimate and subject to a large degree of uncertainty; a liquidity premium – since the secondary market is illiquid, investors require compensation for holding securities that may be difficult to later sell; and a premium for ‘model risk’, reflecting the fact that CDO-pricing models are still evolving, creating additional uncertainty about the robustness of model estimates.
While the lack of domestic CDO issuance in recent months makes it difficult to examine the impact of the recent volatility in global credit markets on primary-market CDO spreads in Australia, secondary market prices are available for retail CDOs that are listed on the Australian Securities Exchange. However, this market is not very liquid and these CDOs only make up 6 per cent of the Australian CDO market by value. Since the end of May, the prices of the 12 listed CDOs have fallen by around 6 per cent. Liaison with market participants indicates that price falls in the unlisted segment of the Australian CDO market have been somewhat larger.
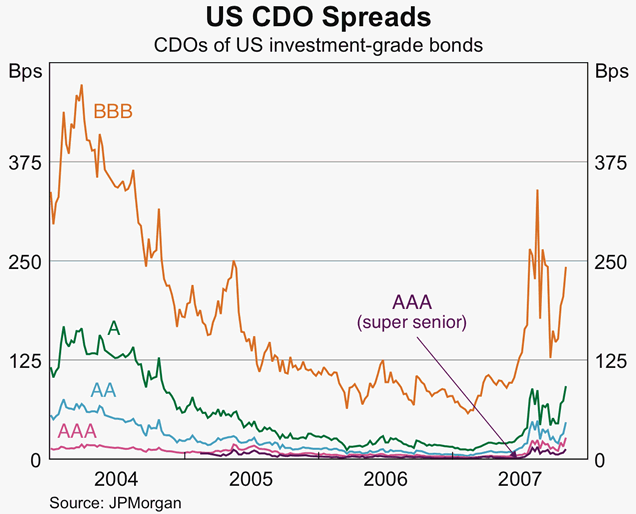
Spreads on US CDOs that reference CDS on investment grade bonds rose sharply in July and August – these CDOs are comparable to a large share of the Australian CDO market that is also backed by investment grade CDS (Graph 8). Spreads on the lowest investment grade tranche – BBB-rated – rose by over 130 basis points while the more highly rated tranches rose between 10 and 40 basis points. Spreads have narrowed since then, but remain at elevated levels. In contrast, spreads on US CDOs that are backed by sub-prime RMBS have increased much more.
Conclusion
While the CDO market has grown rapidly in recent years, it is still relatively small compared with the overall bond market. However, for some investors, particularly some retail and middle-market investors, CDOs constitute a significant proportion of their financial assets. By their construction, CDOs are much more complex than conventional bonds, and no single rating is able to adequately convey the range of risks facing investors. Expected loss and risk profiles vary significantly across bonds and CDOs due to subordination, but broadly speaking, the higher level of spreads on CDOs versus equivalently rated bonds reflects the higher risks associated with these securities. It would appear that some investors, attracted by the higher spreads, were not fully aware of the risks to which they were potentially exposed.
Appendix – Potential exposures of CDO-squareds to losses
This appendix extends the earlier simple example of loss profiles to CDO-squareds, based on a stylised example of an investor who invests in three ways: directly in a pool of corporate bonds (as before); a BBB‑rated tranche of a CDO backed by corporate bonds (as before); and an A-rated tranche of a CDO‑squared that references the BBB-rated tranche of 10 equally weighted CDOs, with each ‘inner’ CDO backed by corporate bonds (Graph A1).
As discussed above, due to the subordination in the CDO, the CDO investor does not suffer any losses on the underlying bond portfolio up to 5 per cent in value, as they are protected by the junior tranche (Graph A2). However, once the losses exceed the value of the junior tranche, the CDO investor experiences a rapid reduction in capital value; once the portfolio losses reach 10 per cent in value, the entire investment of the CDO investor is wiped out.
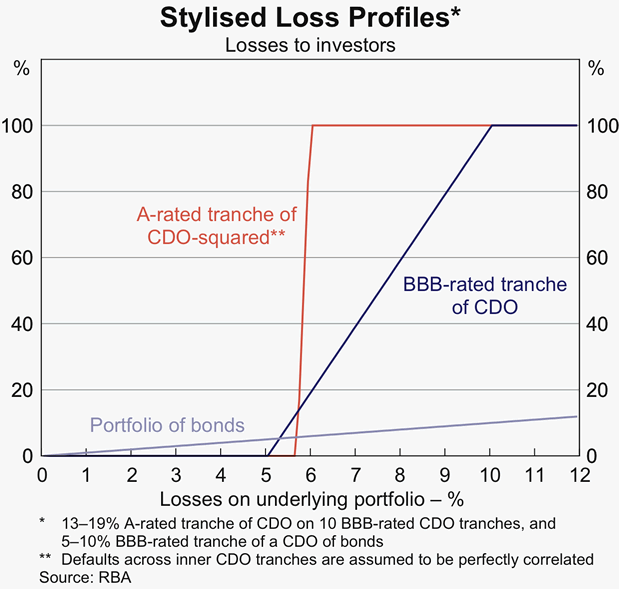
Overall, the CDO-squared starts to bear losses at the same time as the BBB-rated tranche of the CDO – once losses on the underlying bond portfolio exceed 5 per cent of the total. If there are an additional 5 per cent of losses on the underlying portfolio (10 per cent in total), such that the BBB-rated CDO tranche is exhausted, then the entire CDO-squared is wiped out.
However, since the A‑rated tranche of the CDO-squared benefits from a 13 per cent loss buffer, 13 per cent of the additional 5 per cent of losses on the underlying bonds, 0.65 percentage points, is absorbed by the junior tranches of the CDO-squared. Hence, the investor in the A-rated tranche of the CDO-squared is exposed to those losses on bonds that exceed 5.65 per cent in value. While the investor in the CDO-squared tranche benefits from the higher degree of subordination, once portfolio losses exceed 5.65 per cent in value, he experiences a rapid reduction in the capital value of his investment. Once losses on the underlying portfolio reach 5.95 per cent in value, the CDO-squared investor loses all his investment. In contrast, the investor who purchases the BBB tranche of the CDO issue has lost almost a fifth of his investment, while the investor in the untranched portfolio incurs losses of 5.95 per cent. Once they start to bear losses, losses for the CDO-squared investor occur at a faster pace than for the CDO investor who, in turn, experiences losses at a faster pace than the investor in the untranched portfolio of bonds.
The comparison of CDO and bond ratings is even more complex for CDOs of ABS. This is due to the fact that, in assigning a rating to a CDO-squared, one needs to consider the correlation between the underlying assets across the different CDO tranches, in addition to the correlation between the underlying assets within a given CDO tranche. This is a difficult exercise, with the additional layer of modelling complexity, as well as the additional leverage in a CDO-squared structure, increasing the sensitivity of the ratings of CDO-squared tranches to changes in the underlying assumptions. As a result, the risks of CDOs of ABS, CDOs and conventional bonds are unlikely to be the same, even if all three securities have the same credit rating.
Recent rating downgrades of US CDOs linked to US sub-prime RMBS illustrate the greater rating sensitivity of CDOs of ABS versus CDOs. Rating agencies have recently downgraded a large number of US RMBS, with the vast majority of the downgrades relating to tranches rated A and lower. In contrast, the ratings on more senior tranches of CDOs linked to US RMBS have also been downgraded, with around one-third of tranches rated AA and higher having been downgraded.
Footnotes
This article was prepared by Susan Black and Alan Rai of Domestic Markets Department. The article provides an update to ‘Collateralised Debt Obligations in Australia’, Financial Stability Review, September 2005, pp 53–61. [1]
The term CDO is sometimes used generically to describe any type of ABS, including residential mortgage-backed securities (RMBS) and commercial mortgage-backed securities (CMBS). In this article, however, we consider the latter two as separate products. [2]
Credit default swaps (CDS) are over-the-counter contracts where one party receives ‘insurance’ premia from counterparties in return for agreeing to pay compensation in the event of default (or some other credit event) by the specified corporate borrower, or ‘reference entity’. The premia will be larger where the reference entity is considered to have greater credit risk. [3]
While they are less common, ‘CDO-cubeds’ are CDOs that invest in CDO-squareds. [4]
The Appendix provides an example of the different loss profiles between a portfolio of bonds, CDOs and CDO-squareds. [5]
The tranched nature of a CDO is similar to a company that has a range of tranched securities: senior debt, subordinated debt and equity. The equity holders in a company are the most leveraged of all the company's financiers, with the amount of leverage decreasing as one moves up the capital structure. [6]
Global and Australian issuance figures refer to funded CDO tranches, and exclude unfunded tranches of synthetic CDOs. [7]
Standard & Poor's (S&P) defines leveraged loans as loans to sub-investment grade borrowers or loans with spreads that exceed 125 basis points. [8]