Financial Stability Review – October 2018 3. The Australian Financial System
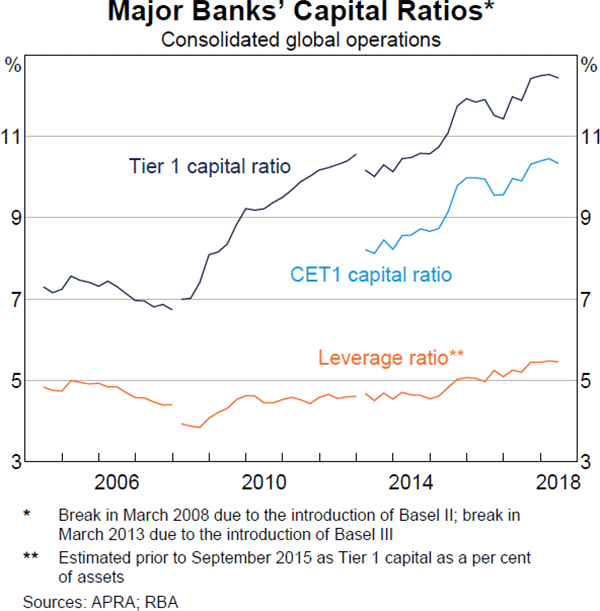
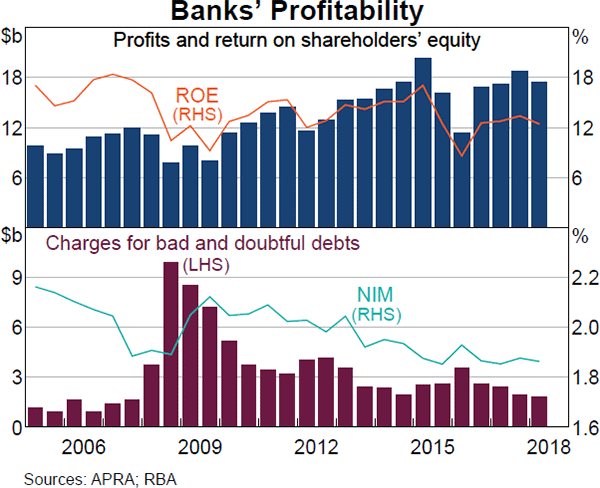
Australian banks' capital ratios are at or very near the ‘unquestionably strong’ benchmarks set by the Australian Prudential Regulation Authority (APRA). These benchmarks leave capital ratios around 50 per cent higher than a decade earlier and well within the range that has historically been sufficient to withstand financial crises. Banks have also substantially strengthened their liquidity management by switching funding to more stable sources and increasing their holdings of liquid assets. This transition is now largely complete, with banks operating around their targets for headline liquidity requirements. The strengthening of capital positions and liquidity management has reduced banks' return on equity (ROE) relative to its historical average. But ROE appears to have stabilised at a level that is still high by international standards. Charges for bad debts remain at historic lows despite a small pick-up in household loan arrears, reflecting the strength of the underlying collateral held by banks as well as the improving performance of business loans.
At the same time, the challenges for banks in embedding a strong risk culture have become more apparent. The extent of these challenges has been clearly highlighted by the Royal Commission into Misconduct in the Banking, Superannuation and Financial Services Industry. APRA's recent prudential inquiry into the Commonwealth Bank of Australia (CBA) attributed the misconduct at CBA to a range of culture deficiencies, such as overconfidence, an unwillingness to challenge or be challenged, and a legalistic approach to non-financial risk management. Financial institutions are responding to these issues in a way that, over time, will contribute to a more resilient financial system.
Interest rates in short-term wholesale funding markets have risen notably this year, despite the official cash rate remaining stable. Historically, developments like this have been associated with rising credit risk and bank stress, but there is no sign of that presently. However, recent developments may imply that these markets are more sensitive to changes in demand and supply.
Non-bank financial institutions are generally in good shape. Profitability in the general insurance industry has increased at the same time as insurers have reduced risk through additional reinsurance. There are substantial changes underway in life insurance as Australian banks and AMP sell, or look to sell, their life insurance businesses. To date these businesses have been acquired by overseas specialists that are well placed to address the long-standing issues that have depressed profits over recent years. There are also large current or prospective changes in the prudentially regulated superannuation sector. Superannuation funds should be able to manage this because they have very little debt.
Bank asset performance remains healthy
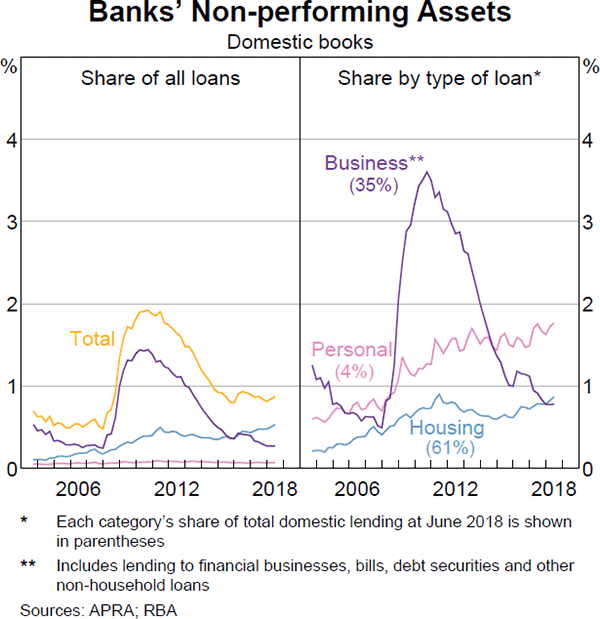
While Australian banks' domestic asset performance deteriorated slightly over the first half of 2018, it remains broadly in line with that seen over the past few years. This recent decline in asset performance has mainly been concentrated in housing loans, with non-performing business loans remaining largely unchanged (Graph 3.1). The share of non-performing housing loans has been drifting up during the past few years. It is the highest it has been in recent years, but it is low in absolute levels and compared with that in other advanced countries. The modest increase partly reflects the ongoing effects of the end of the mining boom on Western Australia, the impact of slower credit growth (as this slows growth in the denominator for this ratio relative to the numerator), and a seemingly modest deterioration in the performance of some loans originated before the tightening of lending standards in recent years. As such, the share of housing loans that are non-performing remains highest in Western Australia; in other states, non-performing housing loan ratios have picked up only marginally from a low base.
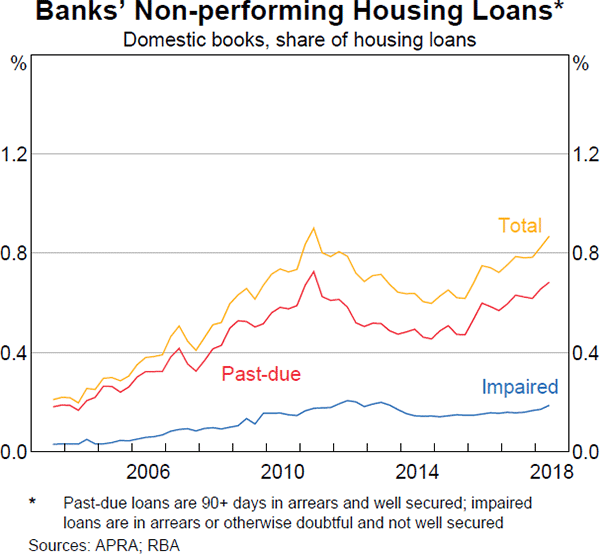
The majority of banks' non-performing housing loans remain well secured, with the impaired share low (Graph 3.2).[1] However, there is a risk that some past due housing loans could become impaired if the value of the dwelling securing the loan were to fall substantially. Another risk is that borrowers struggle to adjust to higher repayments following the expiry of interest-only (IO) loan periods. However, many loans have had IO periods routinely expire over the years with little sign of financial stress. Furthermore, RBA analysis suggests most IO borrowers are well placed to accommodate the higher payments at the end of their IO period and only a small number could not alleviate their situation by refinancing.[2] For households more generally, the available evidence suggests that there is little sign of widespread financial distress but it remains an area to monitor (see the ‘Household and Business Finances’ chapter).
Personal lending is a very small share of total lending and household borrowing and so is not a substantial risk to banks. However, the non-performing loans ratio for personal loans remains elevated. This partly reflects the cyclical effects of economic conditions in the mining-exposed states and some structural changes in the types of borrowers that take out personal loans.[3]
Credit growth has continued to ease
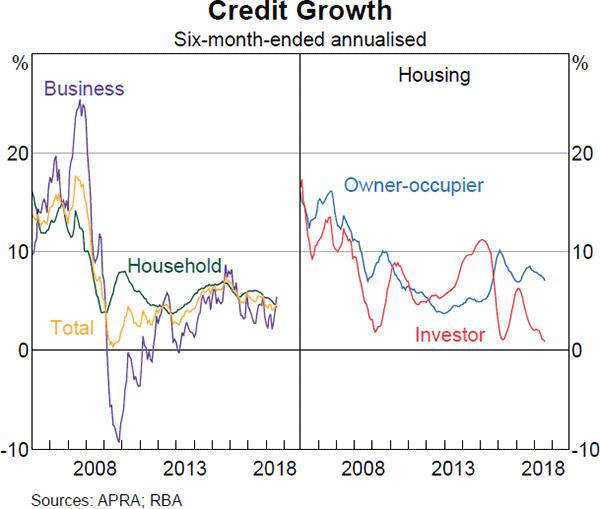
The easing in total credit growth over the past six months has mainly reflected slower investor housing credit growth (Graph 3.3). In liaison, banks have mostly attributed the weaker investor demand for credit to a downturn in sentiment towards the housing market. While both investors and owner occupiers have experienced tighter lending standards, growth in owner-occupier housing credit is only a little slower than a year ago and is within the range of growth rates seen over the past few years.
Business credit growth was little changed in recent months. The moderate growth in business credit over recent years has not materially constrained investment, which is typically financed primarily with internal funds rather than debt. Within business credit, the major banks' commercial property exposures have remained largely unchanged.
Lending to the business sector by foreign-owned banks operating in Australia has increased at a faster pace than lending by Australian-owned banks. Foreign banks now supply 19 per cent of business credit in Australia, up from 12 per cent in 2012; this growth has mainly been driven by infrastructure and commercial property lending. Much of the growth is from banks headquartered in Asia, but lending from European-headquartered banks is now also growing strongly after easing sharply in the aftermath of the global financial crisis. In the past, rapid expansion by foreign banks has amplified the credit supply cycle and prompted domestic banks to loosen lending criteria to retain market share. In the current upswing, however, these risks have been contained to date. Australian-owned banks' appetite to lend to commercial property has declined and they have tightened lending standards, partly in response to closer attention from APRA.
Banks have scaled back their international exposures
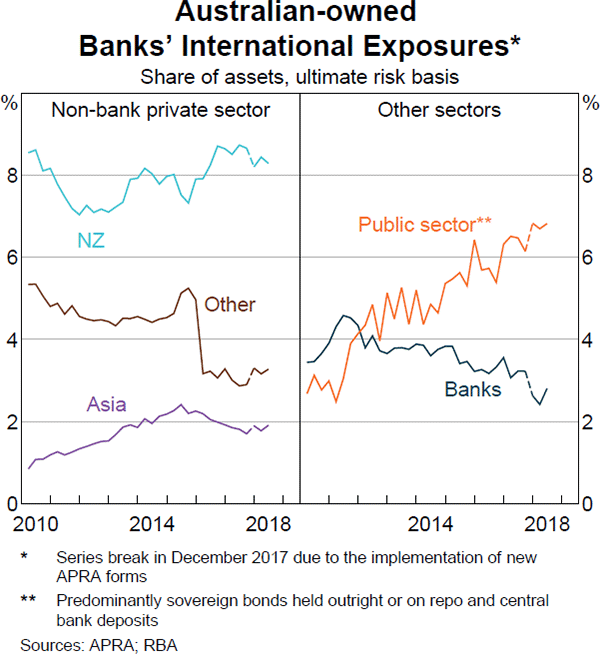
Australian-owned banks have sold foreign subsidiaries and scaled back their overseas lending to the private sector over recent years, reducing their international exposures (Graph 3.4). The decline has occurred across a range of countries, with the notable exception of their exposures in New Zealand. The international exposures of Australian-owned banks are now mainly comprised of lending in New Zealand and sovereign exposures (both government bonds and central bank deposits, mainly issued by advanced countries and held to satisfy regulatory requirements). Non-bank private sector lending outside of Australia and New Zealand accounts for just 5 per cent of banks' assets.
The increase in lending in New Zealand has been mainly for housing. Arrears for the banks' New Zealand housing loans are currently around their lowest level in at least a decade. However, as in Australia, high household indebtedness remains a risk factor for the New Zealand economy and the banks (as discussed in ‘The Global Financial Environment’ chapter).
The pull-back in international lending has occurred as banks focus on more profitable domestic lending, which has boosted ROE. It has also reduced the complexity associated with operating in multiple jurisdictions. Furthermore, the capital released from asset sales has eased banks' adjustment towards their ‘unquestionably strong’ capital benchmarks. However, the greater concentration in Australia and New Zealand, whose economies have historically been highly correlated, has also reduced diversification. This has been compounded by their retreat from wealth management, since profits from that business have historically been uncorrelated with interest income and tend to be more stable in a downturn.
Despite limited international exposure, the performance of Australian banks' assets is still sensitive to global shocks. Mostly this is through the impact of global shocks on the domestic economy. For example, APRA's latest stress test of Australian banks showed that a sharp downturn in China that resulted in a severe recession in Australia would lead to sizeable losses on Australian-owned banks' assets. Under this scenario, APRA's tests show that the aggregate Common Equity Tier 1 (CET1) ratio of the 13 banks in the test would fall by around 300 basis points, to just over 7 per cent.[4]
Banks have increased their resilience to funding shocks …
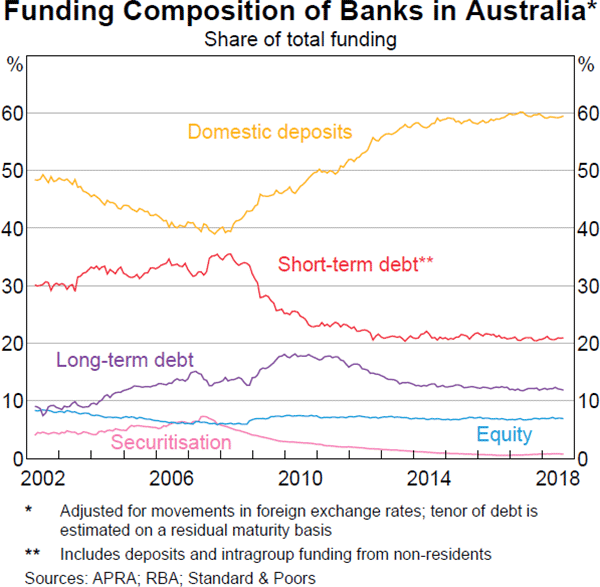
Australian banks have largely completed the transition to a more resilient funding model. The composition of bank funding has remained broadly steady over the past few years. This follows a long period of banks sharply increasing their deposits funding while reducing their use of short-term wholesale debt (Graph 3.5). Banks' Liquidity Coverage Ratios (LCR) – which measure banks' holdings of liquid assets to protect them from periods of intense liquidity stress – have also remained fairly stable, at around 125–135 per cent since late 2016. Further, their Net Stable Funding Ratios – which measure the extent to which stable liabilities are used to fund less liquid assets – have been steadily rising and are now around the banks' target levels.
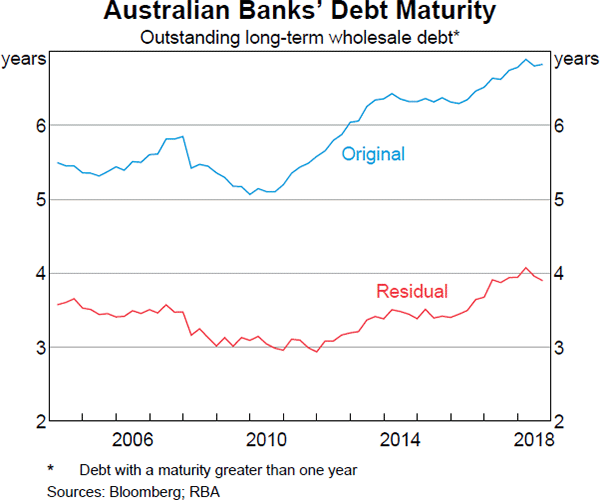
Another way that banks have been building resilience is by actively managing their future refinancing needs, including by extending the maturity of their debt. Since 2012 banks have increased the weighted average residual maturity of outstanding long-term debt from three years to four years (Graph 3.6). This extension has had little impact on their cost of funding given the current absence of term risk in bond prices of late. Banks have good access to funding and have capacity to issue more term debt.
Spreads on short-term debt issued by Australian banks have increased materially since the beginning of the year to reach their highest level since the global financial crisis (Graph 3.7). In the past, this has typically been an indicator of higher perceived near-term credit risk of banks. However, this is not the case in the current instance. Measures of long-term credit risk, such as credit default swap premia and bond spreads, have remained very low. Nor do higher short-term funding costs indicate that banks are struggling to acquire the funding needed for normal business. In particular, retail deposit interest rates have generally declined slightly while deposits have continued to grow faster than banks' assets (despite slowing recently).
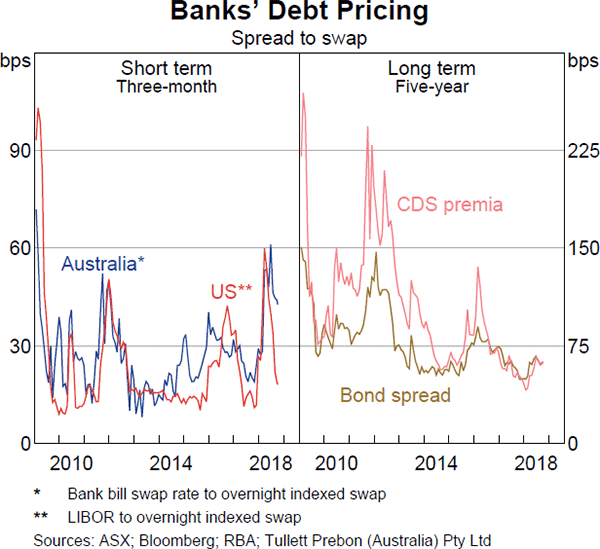
Further, spreads on banks' bonds remain low and net bond issuance has been well above issuance patterns in recent years.
Instead, the current rise in short-term spreads seems to have been caused by a range of other factors, which are outlined in more detail in the RBA's August 2018 Statement on Monetary Policy. One factor is a decline in demand by banks to hold bank bills (since the introduction of the LCR in 2015) and by investment funds (more recently, due to a reallocation into riskier assets). Another factor is the reduced depth in a range of short-term money markets particularly towards the end of reporting quarters, which appears to be driven by regulatory changes and a greater focus on market misconduct since the global financial crisis. The first of these factors may be contributing to a rise in the average level of the bank bill swap rate (BBSW), while the second mostly affects the variability of this rate. A persistent rise in the average level of BBSW would not imply a threat to financial stability, though it imposes additional costs on banks or their customers. However, the recent volatility in BBSW is a sign that markets have less capacity to accommodate shocks to supply and demand, which may indicate that funding markets are more prone to impairment than previously.
… while also increasing their ability to withstand credit losses
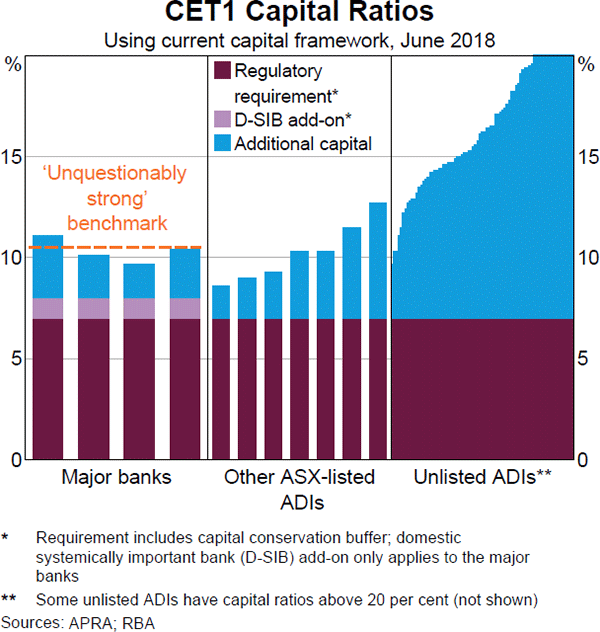
Australian banks have mostly completed the transition to meet APRA's higher ‘unquestionably strong’ capital benchmarks. Major banks' CET1 ratios are all at, or close to, APRA's benchmark of 10½ per cent (using current risk weights) (Graph 3.8).[5] Some banks' capital ratios will be further lifted over the coming year by the announced divestments of their wealth management and life insurance businesses. Other authorised deposit-taking institutions (ADIs) also appear to have accumulated sufficient capital to meet APRA's 50 basis point increase in minimum capital requirements.
The increase in capital has made banks more resilient to solvency shocks. Major banks' Tier 1 capital ratios are now more than 50 per cent higher than they were before the financial crisis, and are within the top quartile of large banks internationally (Graph 3.9). The major banks' Tier 1 capital ratios (12½ per cent) are now also well within the range that research has found would have been sufficient to withstand the majority of historical bank crises (after adjusting for a 5 percentage point increase when calculated on an internationally comparable basis).[6] Their leverage ratios (a non-risk-adjusted ratio of Tier 1 capital to total exposures) have also improved, rising by more than one third over the past decade to be well above the proposed minimum requirements.
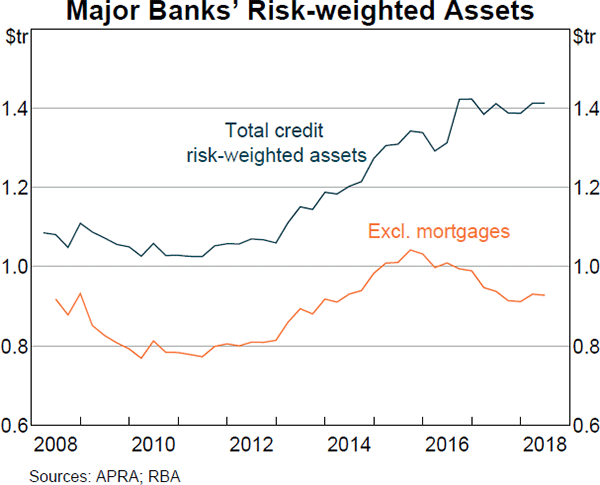
In liaison, the major banks note that they have a greater appetite to undertake capital-intensive institutional lending if demand exists, given that they have neared the completion of the transition to higher capital ratios. Consistent with this, risk-weighted assets excluding mortgages have stabilised over the past half year (Graph 3.10). This follows two years in which banks actively reduced institutional exposures in an attempt to raise their capital ratios in a way that minimised the impact on ROE.
Proposed revisions to capital standards will also modify risk weights to increase the risk-sensitivity of the capital framework and incorporate changes to global minimums. APRA's proposals, released for consultation in February, increase capital requirements for higher-risk residential mortgage lending (particularly high-loan-to-valuation (LVR) investor, interest only and non-conforming mortgages). APRA is currently considering submitted responses to its proposals and will issue drafts in the coming months.
APRA proposed some potential revisions to the capital framework in August. These aim to make Australian ADIs' capital ratios more internationally comparable, so that international creditors do not underestimate their ‘unquestionably strong’ status. The proposals would have no impact on the amount of capital banks require. One proposal is for ADIs to report an ‘internationally comparable’ capital ratio, calculated using a standardised method determined by APRA, in addition to their current reporting. A second option is to calculate a single (higher) capital ratio using international standards and simultaneously raise each ADI's minimum capital ratio requirement by the same amount (to ensure the minimum amount of capital is unchanged). APRA also flagged potential changes to the allocation of capital requirements, which could involve converting some portion of the minimum capital requirement into the capital conservation buffer in order to increase flexibility in cases of stress. APRA is now seeking feedback on these approaches by November, including whether there is sufficient value to warrant making changes.
Banks' profits have stabilised since 2014 (Graph 3.11). This follows several years of strong growth and reflects a number of factors. Non-interest income has declined, as banks have sold or scaled back a number of their fee-generating activities. In addition, the earlier benefits from falling charges for bad and doubtful debts have largely ended. Slower asset growth and a slightly narrower net interest margin (NIM) have also contributed, but this has been mostly offset by slower growth in expenses. As profits and capital have both stabilised, so too has banks' ROE. ROE is now a few percentage points lower than its historical average, as capital levels have risen. But it remains high compared with international peers. These strong profit levels give banks considerable scope to absorb any rise in credit losses, without a reduction in capital, in the event of an economic downturn.
Analysts expect bank profits to be broadly unchanged in the year ahead. Net interest income growth is widely expected to be slow as housing credit growth moderates and NIMs narrow. In addition, analysts expect the charge for bad and doubtful debts will not fall further, particularly if housing arrears continue to rise. The financial impact of the various inquiries into the financial services sector remains a key uncertainty.[7] Responses to the inquiries could result in higher risk management expenses or changes to business structures that curb profits, as well as additional penalties and/or compensation for past misconduct.
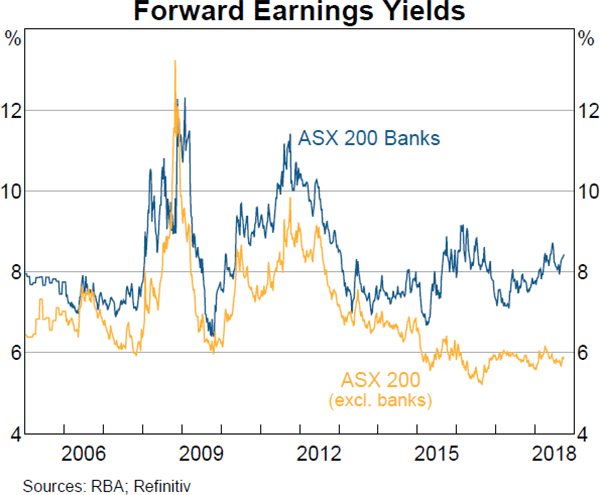
The uncertainty surrounding banks' future earnings has raised their cost of capital, as measured by the forward earnings yield on their stocks (Graph 3.12). The increase in banks' forward earnings yields over the past year has been relatively modest. However, they have diverged significantly from those of the rest of the Australian equity market over the past five years. This has seen banks' current forward earnings yields remain a little above their pre-crisis average, despite a large decline in risk-free rates.
Bank culture needs strengthening
There has been a strong focus on shortcomings in Australian banks' culture this year. Most notably, the Royal Commission has exposed numerous examples of poor behaviour throughout the finance industry, including: inappropriate lending; excessively strict recovery of bad debts; charging fees without providing a service; not operating in the best interests of superannuation members; and unscrupulous selling and claims handling in life and general insurance. APRA's prudential inquiry into CBA, which was commissioned in 2017 in response to a number of incidents at CBA, closely examined the drivers of that bank's governance failures. The inquiry report, which was released in April, attributed these failures to cultural issues within the organisation. In particular, it highlighted a culture of excessive confidence in its risk management skills (driven by many years of financial success), a legalistic approach to non-financial risk management, an insular approach to external concerns about CBA's conduct (including from regulators) and insufficient internal challenge. While focused on CBA, the report has been widely viewed as having relevance for other financial institutions and companies more broadly.
International experience has shown that poor culture can have significant adverse effects on banks, including on their financial performance and capital position. The direct impact on Australian banks' financial position from fines and compensation payments to date has been modest relative to their profits. The largest has been CBA's recent $700 million settlement with the Australian Transactions Reports and Analysis Centre (AUSTRAC) for breaches of anti-money laundering provisions. A more significant impact on their near-term profitability could stem from change to their business models to address the risk of future misconduct. There could also be an impact if consumers lost confidence as a result of revelations of misconduct.
While issues around culture have come to the fore, there were already important changes to bank governance underway that should make banks more resilient. One important change has been the commencement in July of the Banking Executive Accountability Regime (BEAR) for large ADIs. A key aspect of the BEAR is to require banks to identify ‘accountable persons’ and to develop accountability ‘maps’ and statements. This aims to ensure that banks are clear about who holds ultimate responsibility for each of the risks the bank faces, reducing the chance that risks are not accounted for and addressed in a timely manner. APRA has also responded to the evidence that inappropriate incentives have encouraged poor behaviour by publishing clear guidance in April on what it considers best practice for variable remuneration. Of particular note is APRA's finding that banks have been unwilling or unable to claw back incentive payments that are later shown to have been earned through excessively risky behaviour. The Australian Securities and Investments Commission (ASIC) has also responded with a plan to embed some of its supervisory staff within financial institutions.
Some banks have already started to revise their variable remuneration structures in response to APRA's guidance and all banks have been working to improve their practices more generally. ASIC recently approved a revised banking code of conduct developed by the Australian Bankers' Association (ABA). This code, which will apply to all members of the ABA from July 2019, is better aligned with banks' stated aim of ensuring that their behaviour is in line with community expectations. In particular, it requires banks to increase transparency around the charging of fees, and the terms under which they lend to small businesses.
Some additional changes to the financial services industry are likely to be made over the coming years, including following the release of the Royal Commission's final report scheduled for early 2019. A key theme in the interim report (which covered the first four rounds of hearings) was that misconduct arose from a culture of placing short-term profit ahead of customers' interests. Governance and risk management policies have failed to prevent this culture, which has been supported by variable-based remuneration. The report also questioned the capability and effectiveness of regulators to enforce rules, and banks' compliance with responsible lending laws and their ability to manage conflicts that arise when they develop and sell financial products. Questions in the report will be explored in upcoming hearings and dealt with in the Commission's final report. Likely changes to the financial services industry should help both restore trust and reduce the risk of future misconduct. It is important that the response to these findings balances the need for banks to be able to efficiently recover bad debts with the need to protect consumers from inappropriate conduct.
Non-ADI debt financing is growing rapidly, but remains small
Tighter prudential regulation of ADIs over recent years has contributed to some lending activities migrating to less regulated non-ADI lenders. While this may be beneficial in providing alternative funding sources for borrowers, it could also entail risks given the lighter regulation. To date this risk is contained as debt financing from the non-ADI sector has remained steady at around 7 per cent of the financial system, well below the share in 2007 (Graph 3.13). The risk of contagion from non-ADIs to banks is also limited given the low level of banks' exposures to the sector (only a few per cent of their financial assets). Legislation passed earlier this year will also make it easier to monitor ‘shadow banking’ activities by requiring larger non-ADI lenders to regularly disclose the scale of their lending activity to APRA. The legislation also provides APRA with reserve powers to impose rules on non-ADIs if their activities are judged to pose a material risk to financial stability.
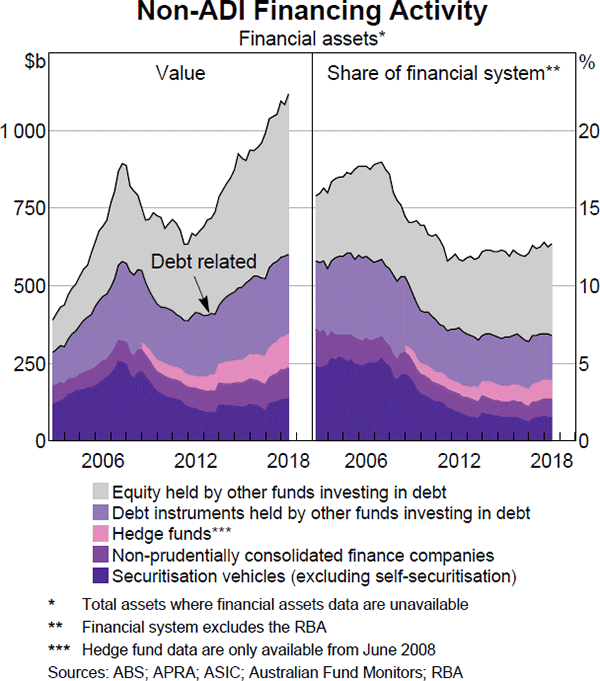
Property lending is one area that warrants particular attention given it has seen the most significant tightening of prudential standards. Growth in residential mortgage lending by non-ADI lenders remains high and well above that at banks, partly because higher interest rates charged by banks for investor and IO loans have made non-ADIs more competitive. This rapid growth has been funded by non-bank issuance of residential mortgage-backed securities (RMBS), which remains higher than in recent years (though lower than in 2017) (Graph 3.14). That said, non-ADI lending still accounts for less than 5 per cent of outstanding residential mortgages and its contribution to overall housing credit growth remains limited.
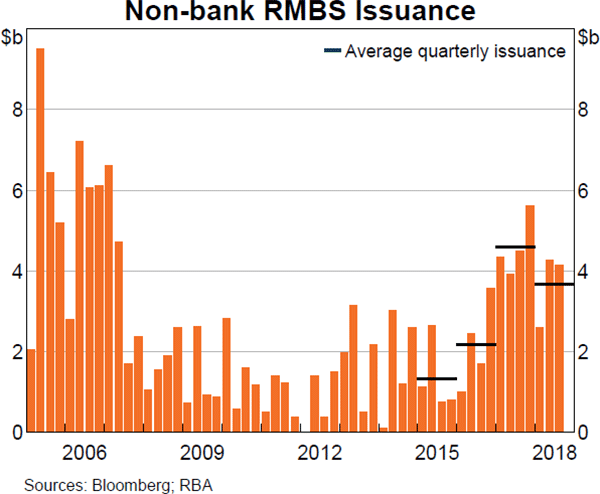
A constraint to the growth of lending by non-ADIs is their higher cost of funding. While conditions in RMBS markets are supportive of issuance, spreads are still significantly above pre-crisis levels and much higher than the cost of banks' main funding sources, deposits and unsecured debt. Non-ADI lenders' funding costs are also more affected by the recent increase in BBSW rates, since all of their funding is tied to that rate.
There are limited data on the scale of non-ADIs' lending for property development, but the Bank's liaison suggests that this continues to increase strongly, most notably in Victoria. If this were to result in overbuilding that increases the chance of a large correction in property prices, it could pose a direct risk to financial stability. This risk is exacerbated by non-ADI development financiers (mainly managed funds) requiring lower levels of pre-sales and allowing greater leverage. But they reportedly also charge much higher margins, which should limit the potential for overbuilding. In addition, when banks provide senior debt alongside non-ADI lending, there is a degree of regulatory oversight.
Conditions vary across segments of the insurance sector
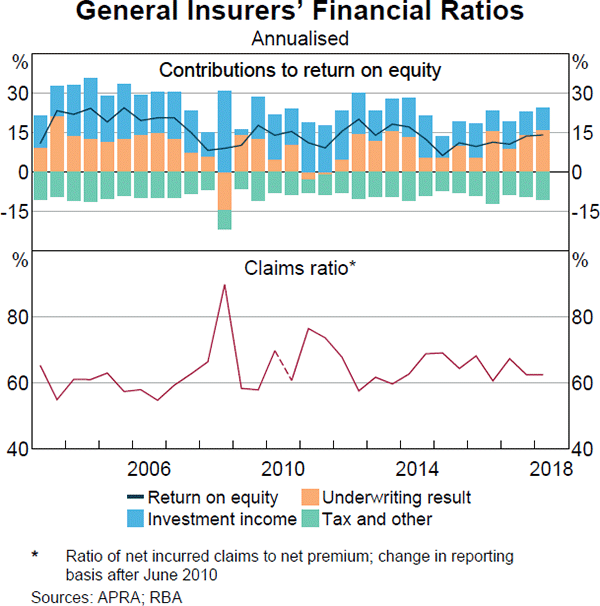
The resilience of the general insurance industry has continued to strengthen over the past year. The industry remains well capitalised and reinsured. Capital is equivalent to 1.8 times APRA's prescribed amount, and profits have improved despite subdued investment returns as bond returns have fallen (Graph 3.15). The increase in profits reflects premium price increases in some commercial, home and motor insurance business lines. These have reversed earlier downward pressure on underwriting margins. Natural disaster costs were in line with expectations. ROE has increased over the past few years, despite direct insurers' reducing risk through additional reinsurance arrangements.
The profitability of lenders mortgage insurers (LMI) remains under pressure. However, the sector remains well capitalised, at 1.6 times APRA's prescribed amount. Profits continue to be affected by decreasing revenue, as banks reduce high-LVR mortgage lending (which is generally insured) and claims increase, particularly from Western Australia and Queensland. The constraint on revenue seems likely to persist given APRA's efforts to ensure prudent lending standards discourage the flow of new high-LVR loans. The Productivity Commission's recommendations to improve choice for LMI customers, if adopted, could pose an additional challenge to the business models of these insurers.
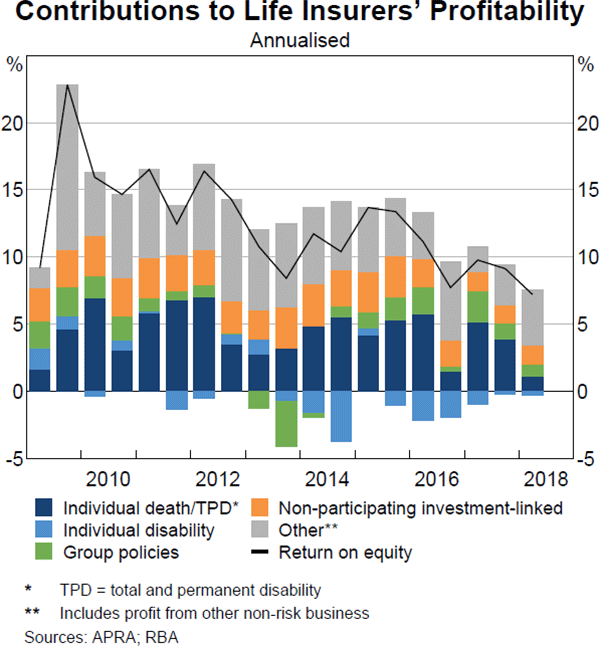
The life insurance industry in Australia is undergoing substantial change. Almost all Australian banks have now sold or announced the sale of their life insurance businesses, while AMP is examining a sale. This follows a period of poor profitability and concerns around the reputational risk associated with vertically integrated business models. To date these businesses have been sold to large global insurance specialists. These new owners are well placed to improve the profitability of these businesses and undertake necessary investments in legacy processes and systems given their underwriting expertise, increased scale and strong financial resources.
The new business owners will need to address persistent structural issues affecting profitability. These have included historical underpricing, loose product definitions, generous product benefits and rising claims, especially for mental health. ROE remains low and these issues will take some time to resolve given the long-term nature of life insurance contracts (Graph 3.16). The decision to require insurance within superannuation funds to be offered on an opt-in basis for younger members poses a further challenge to life insurers' profitability unless premiums are increased for other members.
The superannuation industry is well placed to manage likely changes
The superannuation sector is a large and growing part of Australia's financial system. Total assets now amount to $2.7 trillion, accounting for three-quarters of the assets in the managed fund sector. This is a higher share than in other advanced economies and equivalent to around two-thirds of the size of the Australian banking system.
Significant changes to the sector are likely over coming years. Changes will likely flow from the Productivity Commission's superannuation review, the issues raised at the Royal Commission and APRA's moves to improve member outcomes, as well as the sale by most major banks of their wealth management businesses. In particular, the focus on underperforming funds could lead to closures or material changes in the way these funds are managed. While this transition will involve complexities and give rise to operational risk, the lack of debt within APRA-regulated funds (which are not generally permitted to borrow) means that these risks are manageable without risk to members' funds.
In contrast, self-managed superannuation funds (SMSFs) are permitted to use debt with limited recourse. The use of such debt has increased in recent years, mainly to fund the purchase of property. While this creates risk to retirement funding for some individuals, leverage in SMSFs as a whole is just a few per cent of total assets and the share of rental properties owned by SMSFs remains small. At this stage, this borrowing poses little risk to broader financial stability. Nonetheless, banks have been pulling back from lending to the sector in recognition of the financial and reputational risks associated with this form of lending.
While financial stability risks are lower in the superannuation industry because of its low level of debt funding and longer-term investment focus, its large size means it could still amplify financial market shocks. This could happen if superannuation fund managers change their asset allocations and/or members switch between investment choices rapidly. That could be particularly important for banks if the increase in their cost of capital were to be amplified during periods of stress by superannuation funds reducing their holdings of bank stocks. Superannuation funds could also create risks if they seek to boost returns by investing significantly more in leveraged assets (such as property development).
Financial market infrastructures have continued to support the economy
Financial market infrastructures (FMIs), including systemically important payment systems, central counterparties (CCPs) and securities settlement systems, play a central role in the financial system. They connect different financial market participants to facilitate payments and the clearing and settlement of financial products.
Given their central role in the financial system it is important that FMIs are available whenever financial market participants need to use them. There are two key FMI entities located in Australia. The Reserve Bank Information and Transfer System (RITS) is used by banks and other approved institutions to settle payment obligations on a real-time basis. The other is the ASX clearing and settlement facilities, which facilitate the clearing and settlement of trades in securities and derivatives. Given the importance of these FMIs to the financial system, both have high minimum reliability targets (99.95 per cent for RITS and at least 99.8 per cent for the ASX clearing and settlement facilities). Over the past financial year, both entities met or exceeded these targets. More recently, however, on 30 August, the Reserve Bank experienced a major power outage at its head office site that resulted in large-scale within-day disruption to its IT systems, including systems providing settlement and payments processing services. The Bank is conducting a detailed investigation of this incident and the associated risk-mitigation steps that flow from it.
A recent review of ASX's technology governance and operational risk frameworks highlighted that, in these areas, it has fallen behind best practice in financial services. This review was commissioned following a number of operational incidents across ASX's trading, clearing and settlement systems that occurred over the past few years. The review identified a number of improvements, including recommendations designed to ensure that ASX's technology and operational risk are managed on a consistent, enterprise-wide basis. ASX has established a program to address the findings of this review, building on existing initiatives underway in these areas. The detail on the findings, along with ASX's work program to address these findings, is provided in the Bank's 2018 Assessment of ASX.[8]
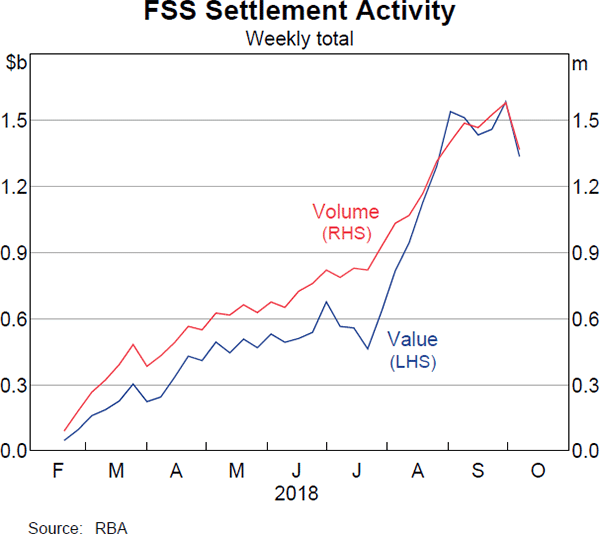
A major change to RITS in the past year has been the addition of the Fast Settlement Service (FSS). The FSS facilitates the immediate settlement of payments on the New Payments Platform, a fast payment system that was publicly launched in February.[9] FSS settlement activity has grown steadily, with a noticeable step-up since July in line with rollout activities at two more of the major banks (Graph 3.17). The FSS adds to the resilience of the Australian payments system as it can be used as an alternative means of settling payments, as well as to reduce the build-up of credit risk between participating financial institutions, and it is available on a 24/7 basis.
Cyber security, an important element of operational resilience, is attracting increasing focus across the financial sector (see ‘Box D: Cyber Risk’). Over the past few years, the Bank has reviewed both RITS and the ASX for consistency with international guidance on cyber resilience for FMIs. In addition, given the dynamic nature of cyber threats, the Bank has a program of ongoing work to strengthen RITS' security controls and recovery planning. As part of this work RITS has recently undergone two external reviews, which assessed it as being compliant with all Society for Worldwide Interbank Finanical Telecommunication (SWIFT) mandatory security controls and with an international information security standard (ISO 27001).
While operational resilience is key for all FMIs, the role of CCPs is to manage financial risk. Given this, global standard setters have developed an international CCP workplan to promote CCP financial resilience, recovery planning and resolvability. The Bank uses the international guidance developed under this workplan in its supervision of CCPs. It has recently concluded an assessment of the ASX CCPs against the guidance and is in the process of assessing LCH Ltd's SwapClear service. The Bank has concluded that ASX's practices are consistent or broadly consistent with the international guidance, and ASX has a plan in place to address the gaps that have been identified. Further details are provided in the Bank's 2018 Assessment of ASX. In addition to the work on CCP resilience and recovery arrangements, the Council of Financial Regulators agencies are developing a resolution regime for CCPs and other FMIs.
Footnotes
Impaired loans are those that are not well secured and there are doubts as to whether the full amounts due will be obtained in a timely manner. Past-due loans are at least 90 days in arrears, but well secured. [1]
For more discussion, see Kent C (2018), ‘The Limits of Interest-only Lending’, Address to the Housing Industry Association Breakfast, Sydney, 24 April. [2]
For more discussion, see RBA (2018), ‘Box B: Recent Trends in Personal Credit’, Financial Stability Review, April, pp 29–32. [3]
See Byres W (2018), ‘Preparing for a rainy day,’ speech at the Australian Business Economists' Forum, Sydney, 11 July. [4]
This benchmark includes a 1 percentage point buffer (using current risk weights) over the minimum future requirement. [5]
An IMF study found a Tier 1 capital ratio of 15 to 23 per cent is appropriate for many advanced economies (see Dagher et al (2016), ‘Benefits and Costs of Bank Capital’, IMF Staff Discussion Note No 16/04). The 5 percentage point uplift stems from APRA's stricter application of global bank standards. [6]
These inquiries include the Royal Commission, the Productivity Commission's Inquiry into Competition in the Australian Financial System, and the Australian Competition and Consumer Commission's Residential Mortgage Products Price Inquiry. [7]
RBA (2018), ‘Assessment of ASX Clearing and Settlement Facilities’, Assessment Report, September. [8]
See RBA (2018), ‘Box D: The New Payments Platform and Fast Settlement Service’, Financial Stability Review, April, pp 49–52. [9]