RDP 8810: The Relationship Between Actual Investment and Survey-Based Expectations 3. The Application of Survey-Based Expectations to Business Investment
December 1988
- Download the Paper 549KB
The ABS publishes investment intentions data for private non-farm enterprises.[5] The data are used extensively in forecasting business investment but in Australia there has been little study of the systematic relationship between these expectations and actual outcomes. An analysis of the forecast errors of two surveys of investment spending in the USA found that “the accuracy of the two surveys is rather attractive in many instances” (Kopcke, 1985).
The ABS surveys the business sector three times a year about their investment intentions for the year ahead. Expected investment series are collected for the forthcoming financial year in January-February (J–F), April-May (A–M) and July-August (J–A). Actual investment spending can be divided by the expected investment series to calculate annual realisation ratios for planned investment. A realisation ratio different from unity therefore indicates a difference between expected and realised investment which can be due to a combination of systematic causes and unexpected developments.
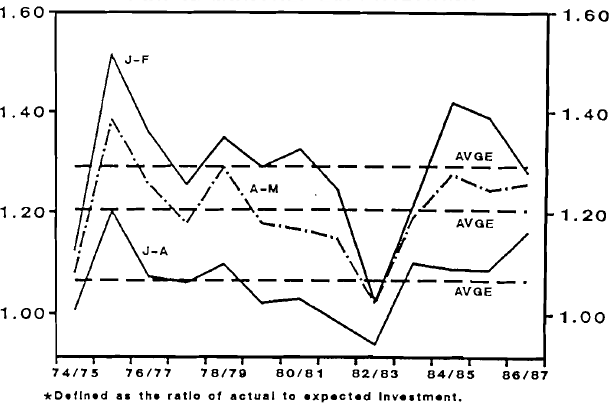
Chart 1 plots the realisation ratio for three surveys over the period 1974/75 to 1986/87.[6] As is shown in this chart, on average each of these survey expectations understate the actual outcome. The closer the collection of the survey expectations to the reference period, the smaller the average degree of understatement. In addition to the expectations apparently being biased, the variance of the survey expectations is greater than that of the actual investment. Forecasts of investment based on correction factors for the average degree of bias (i.e. the average realisation factor) can therefore at times be quite inaccurate.
REALISATION FACTORS*
FOR 12 MONTHLY EXPECTATIONS
Our aim is to develop a simple model which provides a basis for quantifying the bias in the expectations data. To begin with, it is useful to decompose actual outcomes and the ABS expectations data – which are surveyed in current price terms – into the underlying prices and quantities.[7] That is,

| where | P is the price deflator for investment |
| Q is the volume of investment | |
| the superscript: ˆ refers to the survey expectation. | |
Equation (1) implies that deviations of the realisation ratio from unity are (approximately) the product of two errors:
- valuation errors – where the actual cost of a unit of investment turns out to be different to the expected cost; and
- changes in investment plans – where the actual quantum of investment turns out to be different to the expressed intention due to changes in plans and delays.
For example, a realisation factor greater than unity – i.e. V >  – can be due to
unanticipated inflation and/or a higher volume of investment spending than originally planned by
companies. In order to estimate this multiplicative model, the logarithmic form of equation (1)
is adopted where:
– can be due to
unanticipated inflation and/or a higher volume of investment spending than originally planned by
companies. In order to estimate this multiplicative model, the logarithmic form of equation (1)
is adopted where:

As Carmichael (1979) argued, the neoclassical model is a general model capable of incorporating many of the variables typically introduced in eclectic econometric models. As such it can be used to derive the factors underlying Q. Demand for output enters the investment demand function since the firm is constrained by its current level of sales. Relative prices affect the desired capital stock. The price of output enters the present value calculation and profits enter via the maximisation principle and through the output constraint as firms economise on labour.
Investment can therefore be written:

| where: | I is the level of business investment |
| P is the rate of inflation in capital goods | |
| Y is the level of output net of investment | |
| f is relative factor costs including funding costs (r) and labour costs (w) | |
| II is company income (profits) |
It seems natural to use “news” in these variables to attempt to explain revisions to investment plans. We therefore assume that differences in the actual and survey values of investment relate to news in the underlying model arising from differences in the information available at the time the expectations are formed as opposed to the time the investment is realised:

The derivation of expected values for the right hand side variables is discussed in Section 4 but it must be acknowledged that there is no unique method for generating such expectations. No such derivation is required for the left hand side of (4) since we are using survey data.
Footnotes
Private New Capital Expenditure, ABS Cat. No. 5625.0 and 5626.0. The data used in this study are consistent with the June quarter 1987 survey publication. [5]
For a discussion of recent trends and prospects in investment realisation ratios and business investment see Treasury (1988). [6]
See also Richards (1987). [7]