RDP 8904: Changes in the Behaviour of Banks and their Implications for Financial Aggregates 3. The Deregulation of the Early 1980s and Re-Intermediation
July 1989
- Download the Paper 932KB
There was a further major round of deregulation between 1983 and 1985. The changes included: the removal of interest rate ceilings on overdrafts under $100,000; the removal of the restrictions on savings banks' ability to accept large deposits from profit-making bodies and to offer chequeing facilities; and the abolition of minimum and maximum maturities on savings and trading bank deposits, which allowed banks to enter the market for overnight deposits. In addition, exchange controls were removed, the exchange rate was floated and new banking authorities were granted.
These changes improved the banks' ability to compete in areas where they were already operating and also allowed them to enter areas of business that were previously not available. As a result, banks were able to gain market share at the expense of non-banks – a process often referred to as re-intermediation.
The removal in August 1984 of the restriction that prevented banks from raising deposits of less than 14 days was particularly important in this regard. It led to major changes in the market shares of banks and merchant banks in the overnight money market.
After August 1984, banks built up their overnight deposits substantially. Some of these deposits would have come from the substitution out of longer-term bank deposits but, as the overall size of the market for overnight deposits has expanded only a little faster than the general pace of financial intermediation, this effect looks to have been fairly small. Rather, most of the increase in banks' overnight deposits probably came from the capture of market share from merchant banks.
But while the entry of banks into the overnight market was a clear example of banks gaining at the expense of non-banks, it was only part of the general increase in the competitiveness of banks. Deregulation also affected the relationship between banks and their NBFI subsidiaries. It reduced the incentive for the banks to channel business through the non-bank subsidiaries they had set up to carry out business they could not do themselves. This was particularly the case for banks which had affiliated finance companies, and is likely to have been a factor in the subdued performance of the finance company sector since deregulation, where the four largest corporations are wholly owned by major trading banks.
The overall effects of the many deregulatory changes that took place are difficult to quantify but their significance can be seen in the shift of overall market shares between banks and non-banks that took place around this time.
Until the early 1980s, non-bank borrowing grew much faster than M3. From 1968 to 1982, growth of non-bank borrowings averaged 22 per cent per year, while growth in M3 averaged 12 per cent. However after 1981/82, this difference narrowed sharply.
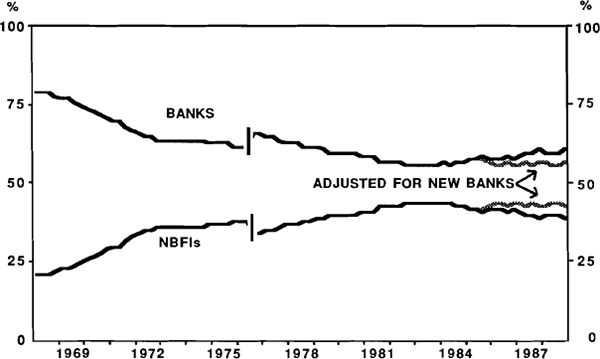
The effects on market shares can be seen in Graph 7. It shows the percentage of total deposits held by NBFIs and banks, both adjusted and unadjusted for the effects of asset transfers associated with the formation of new banks. During the period 1968 to 1982 the deposit share of banks fell from nearly 80 per cent to about 55 per cent. This trend has since been halted and partly reversed. The increase in the market share of banks in recent years would be greater if measured in terms of credit rather than deposits. This is because banks have been providing credit in ways which did not involve raising deposits, in order to avoid the cost of SRDs (see Section 4 below).
Footnote
Break in series in 1976. Before 1976, figures for NBFI deposits calculated from annual Financial Flow Accounts data; thereafter from data collected under the Financial Corporations Act. [7]