RDP 9012: Some Calculations on Inflation and Corporate Taxation in Australia 5. Real Income and the Corporate Tax Burden
December 1990
- Download the Paper 636KB
Using the calculations for the inflationary distortions arising from tax treatment of depreciation, stocks and debt, a measure of inflation-adjusted corporate income can be calculated. Table 3 shows taxable corporate income as reported in the National Accounts for the non-financial corporate sector. Subtracting the spurious profits on depreciation and stocks and adding the gains on debt produces the final inflation-adjusted income measure.
The difference between nominal taxable income and inflation-adjusted income (column 6) provides an indication of the total inflationary distortion to taxable income. These figures show that nominal income was consistently larger than real income, although in 1987–88, gains on debt nearly offset reductions in income due to tax treatment of depreciation and stocks[7].
Note that the inflationary distortion varies significantly across types of assets and liabilities. Real income from fixed assets and stocks is overestimated in inflationary periods, resulting in a higher tax burden. Stocks are penalised particularly severely. In contrast, the real income on debt is always underestimated, implying a lower tax burden on debt financing.
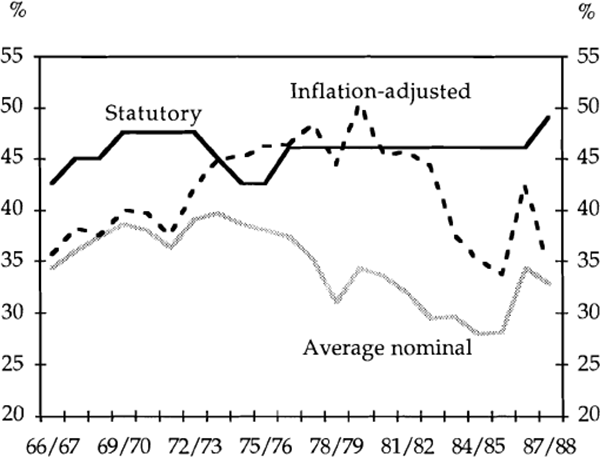
Table 4 shows average effective tax rates, both nominal and inflation-adjusted, and the estimated change in aggregate corporate tax liability that has resulted from the effects of inflation on conventionally measured taxable income. Inflation is shown to have increased corporate tax payments by an average of a little more than $1 billion per year over the 10 years to 1987/88.
| Total Taxes Paid ($ Million) |
Statutory Corporate Tax Rate (%) |
Average Nominal Tax Rate (%) |
Inflation-Adjusted Tax Rate (%) |
Additional Tax From Inflation ($ Million) |
|
|---|---|---|---|---|---|
| (1) | (2) | (3) | (4) | (5) | |
| 1966–67 | 771 | 43 | 34 | 36 | 28 |
| 1967–68 | 922 | 45 | 36 | 38 | 56 |
| 1968–69 | 1,062 | 45 | 37 | 37 | 2 |
| 1969–70 | 1,323 | 48 | 39 | 40 | 43 |
| 1970–71 | 1,334 | 48 | 38 | 40 | 55 |
| 1971–72 | 1,398 | 48 | 36 | 38 | 47 |
| 1972–73 | 1,826 | 48 | 39 | 42 | 132 |
| 1973–74 | 2,181 | 45 | 40 | 45 | 262 |
| 1974–75 | 2,268 | 43 | 39 | 45 | 335 |
| 1975–76 | 2,540 | 43 | 38 | 46 | 453 |
| 1976–77 | 2,793 | 46 | 37 | 46 | 537 |
| 1977–78 | 2,694 | 46 | 35 | 48 | 728 |
| 1978–79 | 3,050 | 46 | 31 | 44 | 917 |
| 1979–80 | 4,334 | 46 | 34 | 50 | 1,378 |
| 1980–81 | 4,574 | 46 | 33 | 45 | 1,205 |
| 1981–82 | 4,086 | 46 | 32 | 46 | 1,225 |
| 1982–83 | 3,699 | 46 | 29 | 44 | 1,238 |
| 1983–84 | 4,532 | 46 | 30 | 38 | 979 |
| 1984–85 | 5,253 | 46 | 28 | 35 | 1,078 |
| 1985–86 | 5,538 | 46 | 28 | 34 | 931 |
| 1986–87 | 7,130 | 46 | 34 | 42 | 1,352 |
| 1987–88 | 7,806 | 49 | 33 | 36 | 659 |
|
(1) Income tax payable by pete's (ANA, Table 29) |
|||||
Effective tax rates, calculated as total taxes paid relative to taxable income, are always lower than the statutory rate as a result of various tax deductions and credits. The inflation-adjusted tax rate is generally higher than the nominal tax rate, supporting the view that inflation raises the corporate tax burden (Chart 1). The gradual narrowing of the gap between nominal and inflation-adjusted tax rates in recent years appears to reflect two factors: the growth of corporate debt, with its associated tax advantages, and the more moderate rates of inflation in the 1980s, which appear to have reduced the distortions to depreciation allowances in particular.

Footnote
To the extent that nominal interest rates adjust to preserve after-tax real rates for borrowers and lenders, the above calculations will overstate the benefit to firms from the inflationary gains on debt. [7]