RDP 9106: The Direction of Australian Investment from 1985/86 to 1988/89 2. Aggregate Data Trends
August 1991
- Download the Paper 382KB
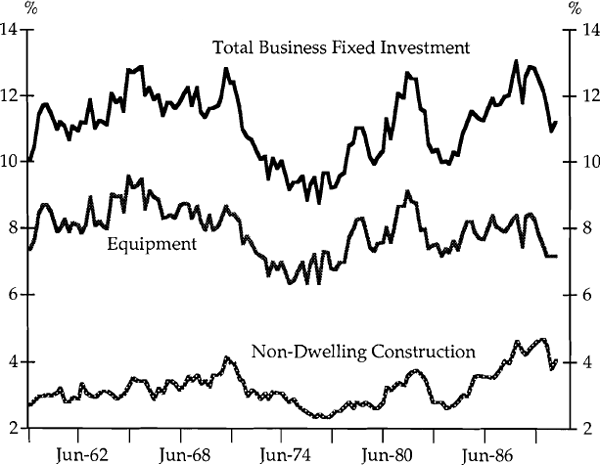
In constant price terms, the surge in business fixed investment over 1985/86 to 1988/89 represents the most significant boom in the last 30 years (Graph 1). In current price terms this growth in business fixed investment is not as significant, with investment in equipment growing more slowly in current price terms over this period (Graph 2).[1]


National Accounts data[2] suggests that over the four years to 1988/89 real business fixed investment grew at an average annual rate of 8.5 per cent compared to an average fall of 0.3 per cent per annum for the preceding four years. Within the total, expenditure on equipment rose by an average of 7.7 per cent per annum while expenditure on non-dwelling construction rose by an average of 10.1 per cent per annum. From 1988/89 to 1989/90 real business fixed investment fell by 0.3 per cent.
There is another source of information on investment – the Capital Expenditure Survey (CAPEX). At the disaggregated level, results from this survey have been shown to be more accurate than the National Accounts capital stock estimates (Lattimore (1989 and 1990)).[3] This survey has a narrower coverage than the National Accounts data, primarily because it excludes rural and community services investment.[4]
Capital expenditure survey data show that during the period 1985/86 to 1988/89, growth in real new private capital expenditure in the non-rural sectors averaged 10.8 per cent per annum. Growth in expenditure on plant and equipment rose by 9.5 per cent per annum while expenditure on building and structures averaged 13.5 per cent per annum. From 1988/89 to 1989/90 real new private capital expenditure fell by 1.7 per cent.
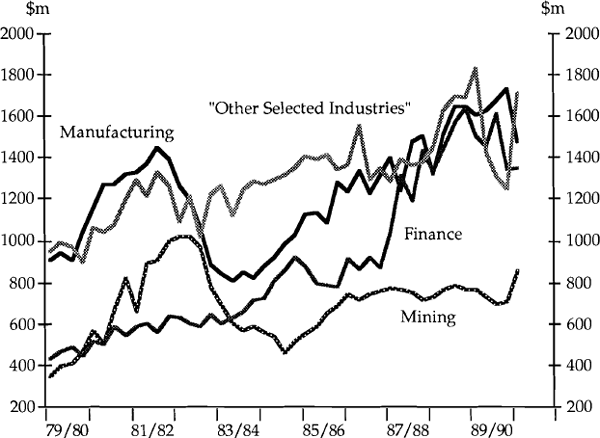
Over the period 1985/86 to 1988/89 the finance sector accounted for 47.1 per cent of the growth in private investment captured by the CAPEX survey, manufacturing contributed 27.0 per cent, mining 10.2 per cent and “other selected industries” 15.7 per cent.[5] The “other selected industries” sector had the highest share in total CAPEX in 1985/86 (35.1 per cent) and the mining sector had the lowest share for the same year (15.6 per cent). However, the finance sector experienced the largest growth in investment between 1985/86 and 1988/89 (79.1 per cent), while “other selected industries” recorded the lowest growth in investment over the same period (15.7 per cent). At this level of disaggregation the investment boom appears to have been broadly based (Graph 3). However, the results that follow show that growth in investment was concentrated in a few industries.

Footnotes
For a discussion of the estimated price series used by the ABS to deflate computer imports (which takes into account increases in the technical capacity of computers), see McCarthy (1989). [1]
Australian Bureau of Statistics (1990a), Cat. no. 5206.0. [2]
The disparities in the National Accounts data are thought to be largely due to errors in classifying investment by units using taxation data. [3]
When we compiled our data base the construction industry was also excluded from CAPEX. Although this industry has since been included in published CAPEX data, we elected to ignore this industry's relatively small investment. In 1988/89 total investment by the construction industry was 4.0 per cent of total CAPEX, while building and structures investment by the construction industry was only 2.7 per cent of total building and structures investment covered by CAPEX. [4]
“Other selected industries” sector includes electricity, gas, sewerage, wholesale, retail, transport, communication, entertainment, restaurant and hotel industries (see Appendix 1). [5]