RDP 9212: Changes in the Characteristics of the Australian Business Cycle: Some Lessons for Monetary Policy from the 1980s and Early 1990s 2. Asset Price Inflation, Borrowing and the Business Cycle
December 1992
- Download the Paper 759KB
(a) Developments Following Financial Deregulation
During the early 1980s, the more-or-less complete deregulation of the Australian financial system proceeded very rapidly. The most important regulatory changes were:
- the lifting of interest ceilings in 1980 (except for owner-occupied housing);
- credit directives ceasing by the end of 1981;
- the introduction of a tender system for all government securities by 1982, which permitted the separation of monetary and debt management;
- the floating of the $A and removal of all exchange controls by December 1983; and
- the domestic banking system being opened to competition from foreign banks by 1985.
In addition, there were important innovations in the financial system, as assets with characteristics similar to money began to multiply. Cash management trusts emerged, for example, and were instrumental in forcing banks to offer competitive market-related interest rates on deposits.
These changes greatly enhanced the market's perception of the future profitability of banks. Figure 2.1 shows bank share prices and the All Ordinaries index. Bank share prices rose even more quickly than the market average from early 1984, greatly enhancing banks' ability to finance new lending. Moreover, credit could be allocated according to the price mechanism, rather than by quantity rationing (with banks choosing the least risky amongst queues of borrowers). Banks became “liability managers”, first deciding how much to lend, and then using their control over deposit rates to attract the funds. These developments improved longer-run growth possibilities from the supply side of the financial system.

But business expectations also became more buoyant from the mid 1980s, greatly enhancing the demand for loans:
- the recovery from the 1983 recession was rapid, and profits rose in the cyclical upswing;
- the new Labor Government implemented a “Prices and Incomes Accord” with the union movement, which effectively reduced real wages and increased the profit share of GDP;
- in the early stage of the recovery fiscal policy was initially expansionary, but by 1985 the government implemented a longer-run program of fiscal consolidation to reduce the constraints on growth imposed by the balance of payments situation; and
- as the 1980s proceeded, the government embarked upon a broad program of other micro-economic reforms. Tax reforms, including the introduction of dividend imputation in 1987, were of particular importance.
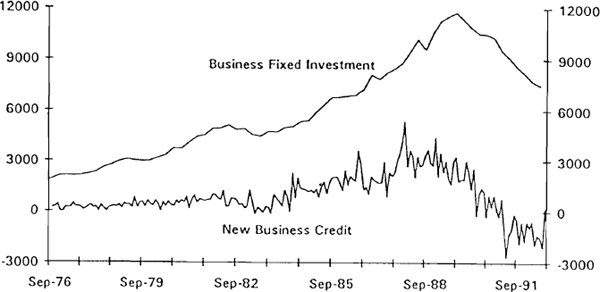
Economic growth and investment accelerated rapidly from the end of 1983, and while being checked by tighter monetary policy in 1985 and 1986, accelerated again as the world economy picked up momentum in the second half of the 1980s. New investment was particularly strong at this time, with business credit provided by financial intermediaries playing an important role in financing it, as shown in Figure 2.2.
Improved growth expectations certainly appear to have been reflected in the behaviour of asset prices. Figure 2.3 shows equity prices, commercial property prices and house prices in the first panel, and aggregate asset prices in the second.[1] Equity prices began to rise sharply relative to the consumer prices from 1984. While Australian share prices fell with the world-wide market break in October 1987, the price of equities remained relatively high (compared with a basket of consumer goods). Moreover, the other components of wealth began to inflate more rapidly in the late 1980s. Commercial property prices rose sharply from mid 1987, peaking in 1989. At this time there was sustantial investment in hotels, shopping centres and offices. Residential house prices rose on a sustained basis from the middle of 1987.
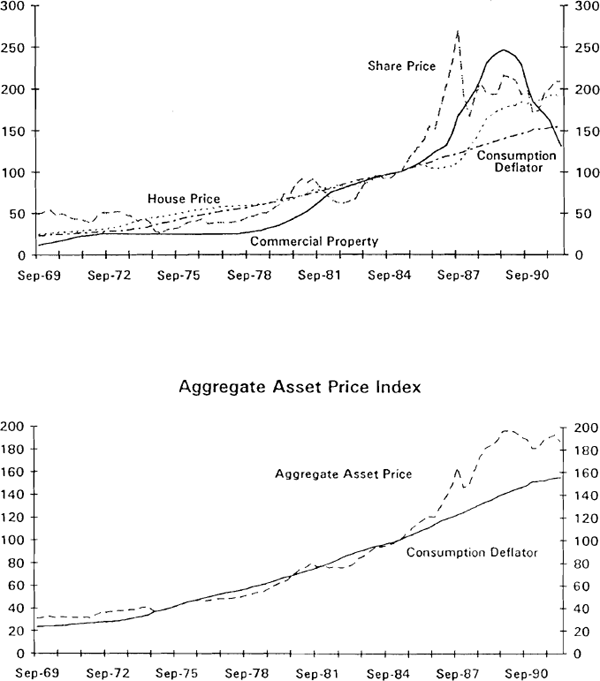
While fundamentals certainly were a factor in the initial rise in asset prices, it is also possible that speculative dynamics were important in continuing the process. Recent research has stressed the importance of positive feedback in asset price behaviour – a rising market leads to further price increases, and vice versa. Positive feedback effects from rising asset prices in the domestic economy, or through international spillover effects, can push asset prices beyond levels justified by fundamentals. Such increases risk excessive growth in nominal wealth, and hence demand, with adverse consequences for inflation.
There are reasons to believe that the same factors which influence the behaviour of asset prices also affect borrowing from financial intermediaries in liberalised financial markets. On the demand side, borrowing is likely to be driven by expectations about the future profitability of investment, which is also reflected in the market valuation of current assets. Similarly, the demand for loans may be driven by speculative activity in circumstances of asset price inflation, as economic agents position themselves to take advantage of capital gains. On the supply side, recent theories about the behaviour of financial intermediaries emphasise the importance of non-diversifiable market risk, related to the cycle in economic activity, and the role of asset values in providing collateral for loans.[2] Most loan defaults occur in economic downturns, while asset values and levels of collateral are relatively low. In these circumstances, banks tend to be relatively less willing to lend. When the outlook for activity improves, on the other hand, perceived credit risks decline and collateral improves as asset prices begin to rise. Banks and other financial institutions become more willing to lend.
Figure 2.4 distinguishes between business and housing credit: the growth rate of business credit is shown in the top panel with both equity and commercial property price inflation, while housing credit is displayed with house price inflation in the middle panel. Growth rates of credit extended by all financial institutions (AFI credit) and aggregate asset prices are displayed in the third panel of Figure 2.4. Asset prices are more volatile than credit. Nevertheless, broad swings in the components of the asset price index, and the aggregate index itself, tend to lead the respective credit variables. Following financial liberalisation in the first half of the 1980s, both asset price inflation and credit growth rose to historically very high levels. Since business credit constitutes about 65 per cent of total credit in Australia, most of this sharp rise is explained by corporate borrowing. Subsequently, asset price inflation declined sharply.
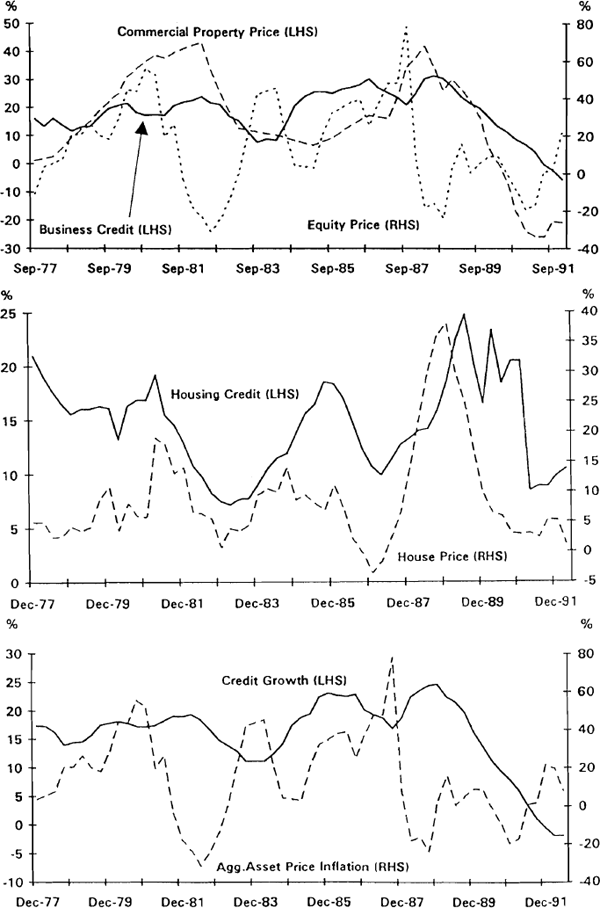
To the extent credit was extended on the basis of asset prices that were not based on fundamentals, but had become overvalued because of speculative dynamics, it is not difficult to see how financial fragility problems might have emerged. Outstanding levels of debt would prove to be too large, and a period of balance sheet restructuring and more cautious lending attitudes might follow. Figure 2.4 shows that the recent decline in asset prices precedes the marked slowing in credit growth.
(b) Determinants of Asset Prices
Asset prices are conditioned by expectations about the future and, being determined in auction markets, may jump quickly to new levels. In theory, asset prices are determined as the present discounted value of expected future returns. That is, they depend on expectations about future nominal returns, and a rate of time discount.
Within this framework there are three broad channels through which asset prices are affected:
- economic fundamentals;
- monetary policy; and
- speculative dynamics that drive asset prices temporarily away from fundamentals.
Economic fundamentals may shift because of changes in such factors as financial regulations, technology, productivity, the profit share (influenced partly by incomes policy), taxation arrangements, fiscal policy and world economic activity. A number of these factors, which may have contributed to pushing up asset prices in Australia during the second half of the 1980s, were mentioned in Section 2(a). Such asset price movements should be thought of as permanent relative price shifts, reflecting anticipated changes in real income and wealth.
The impact of monetary policy on asset prices is not completely separate from the first channel, since it influences expectations about future activity and inflation. At the same time, though, it impacts on the rate at which future expected returns are discounted. This is important, if monetary policy is to counter excessive pressures on goods prices arising from other factors driving the business cycle. However, it also means that monetary policy errors may be transmitted to the economy through wealth effects. Thus excessively easy monetary policy may give rise to asset price inflation in the first instance, and hence rising nominal (and real) wealth, and goods price inflation later on.
The third potential influence on asset prices concerns market inefficiencies, which give rise to positive feedback effects, and “bubble-like” movements in asset prices unrelated to economic fundamentals. Cutler, Poterba and Summers (1990) examined a wide range of asset prices from thirteen different countries, and found such effects to be so pervasive that they were likely to be inherent features of the speculative process. Over short horizons, all asset prices appear to be driven by their recent past behaviour, reverting to fundamentals only in the longer run. Such short-term asset price movements also influence nominal wealth, and facilitate borrowing and spending, with possible implications for the business cycle and inflation.
It is relatively straightforward to formalise these relationships. For example, if q represents share prices, then the return on holding shares is the expected rate of change of the price of those shares, plus the expected dividend return. Arbitrage between bonds and shares therefore implies:
where i is the return on bonds, π is expected profits, and an “e” superscript denotes expectations. Since in the steady state the expected change in asset prices is zero (or perhaps some constant), a long-run equilibrium relationship is implied between share prices, profits and the return on bonds:
Similar propositions apply to other asset prices. Thus commercial property prices depend on the expected changes in property values, commercial rental returns and the interest rate. Residential property prices depend on expected appreciation of house prices, rental returns and the interest rate.
The rest of this section examines empirical evidence on the nature of asset price determination in the Australian economy. The main interest is to see whether there is evidence of speculative dynamics in the short run, with reversion to fundamentals in the long run. Table 2.1 presents cointegration tests (using the Johansen procedure) based on the long-run relationship expressed in equation (2.2) in its first two panels. Results for the All Ordinaries share price index are shown first. This asks whether there is a long-run relationship between share prices, profits (proxied by the total gross operating surplus in the economy available for dividend, interest and rental income) and the two-year bond rate. Results for the aggregate asset price index are shown in the second panel, using the same explanatory variables. In neither case was it possible to identify a cointegrating relationship.
| Long-run Coefficient | Short-run Coefficient | Max λ Cointegration Test | Trace Cointegration Test |
|||
|---|---|---|---|---|---|---|
| (Sample Period: 1969Q3 – 1992Q1) | ||||||
| Share Price | Ho:r=2 | 3.78 | Ho:r≤2 | 3.78 | ||
| GOS | 0.61 | Ho:r=1 | 5.91 | Ho:r≤1 | 9.69 | |
| 2-year Bond Rate | 0.05 | Ho:r=0 | 6.38 | Ho:r≤0 | 16.07 | |
| Agg. Asset Price | Ho:r=2 | 4.21 | Ho:r≤2 | 4.21 | ||
| GOS | 0.54 | Ho:r=1 | 5.53 | Ho:r≤1 | 9.75 | |
| 2-year Bond Rate | −0.07 | Ho:r=0 | 8.91 | Ho:r≤0 | 18.65 | |
| Share Price | Ho:r=3 | 3.22 | Ho:r≤3 | 3.22 | ||
| GOS | 0.97 | Ho:r=2 | 6.12 | Ho:r≤2 | 9.34 | |
| 2-year Bond Rate | −0.10 | Ho:r=1 | 6.88 | Ho:r≤1 | 16.23 | |
| % Change Dow Jones | 16.26 | Ho:r=0 | 32.58*** | HO:r≤0 | 48.81** | |
| % Change Share Price (t−2) | 0.27** | |||||
| Agg. Asset Price | Ho:r=3 | 3.96 | Ho:r≤3 | 3.96 | ||
| GOS | 0.92 | Ho:r=2 | 6.11 | Ho:r≤2 | 10.08 | |
| 2-year Bond Rate | −0.09 | Ho:r=1 | 7.25 | Ho:r≤1 | 17.32 | |
| % Change Dow Jones | 19.17 | Ho:r=0 | 32.66*** | HO:r≤0 | 49.99** | |
| % Change Asset Price (t−2) | 0.22** | |||||
| Note: The Johansen procedure is used to test for cointegration between the log of the respective asset price index, the log of the gross operating surplus (GOS), and the two-year bond rate. The per cent change of the Dow Jones Index is then added to the cointegrating system. Four lags are used. Three asterisks denotes rejection of the null hypothesis shown at the one per cent level, two asterisks at the five per cent level, and one asterisk at the ten per cent level. | ||||||
The Johansen procedure, unlike other approaches to cointegration, estimates both the long-run relationship and the short-run dynamics of the model as a system.[3] However, if the short-run dynamics of asset price determination are strongly influenced by other factors, it may be difficult to identify the underlying equilibrium relationship. In terms of equation (2.1), the expected rate of change of asset prices in the short run may be important, and related to variables that play no role in equilibrium in the longer run. If this were so, the inclusion of rates of change of these other variables, thought to have influenced expectations in the short-run, might improve the power of the cointegration tests.
One important possibility here is that extreme movements in foreign asset prices may have had international spillover effects on speculation in Australian assets. The bubble-like upward movement in international equity prices in 1987, followed by the world-wide market break in October 1987, is a potentially important case in point. Figure 2.3 shows a similarly sharp upward movement in Australian equity prices in 1987, and subsequent reversal. It was this pattern which caused the first of the two extreme peaks in the aggregate asset price index during the late 1980s.
Such international spillover effects should play no role in determining longer-run equilibrium asset values for the Australian economy. Yet their importance in the short-run may make it difficult to identify the “fundamental” factors determining asset prices in the longer run. To test this proposition, the rate of change of the Dow Jones stock price index for the United States was included in the above systems. The results for the All Ordinaries and aggregate asset price index are reported in the third and fourth panels of Table 2.1. In both cases, it proved possible to identify a single cointegrating relationship. Moreover, all of the long-run coefficients had the expected sign. The domestic Gross Operating Surplus in the Australian economy has a strong positive influence on Australian asset prices in the longer run, interest rates have a negative impact, and the rate of change of the Dow Jones index has the expected positive sign. In addition, short-run dynamics of the share price and the aggregate asset price indexes, respectively, are consistent with the presence of positive feedback effects. In both cases, the second lag of the change in asset prices is positively and significantly correlated with their level in the current period.
(c) Credit and Asset Prices
It has long been thought that much of the borrowing in the 1980s in countries such as the United States, Japan, the United Kingdom, Scandinavian countries and Australia was related to the marked rise in asset prices. In Australia, this argument was first advanced by Macfarlane (1989).[4] The sort of model that underlies a lot of thinking about this period is set out in Goodhart (1992). Modifying this model to be consistent with equilibrium prevailing in the long run, loan demand is given by:
where q is the share price or, alternatively, the aggregate asset price index, i is the loan rate, and L is the outstanding stock of loans. Loan demand may depend positively on the level of asset prices, which summarises expectations about future income and wealth. The sign is ambiguous, however, because it is possible that borrowers may substitute to other forms of finance as asset prices change. For example, if equity prices are very high, there may be substitution towards equity finance. Loan demand depends negatively on the loan rate. Loan supply is given by:
It depends positively on the actual level of asset prices, which determine wealth and hence collateral available to banks, and positively on the interest rate. Loan supply and demand also depend negatively on the level of outstanding debt in this model.
Setting loan supply equal to loan demand yields a long-run equilibrium relationship between the outstanding level of credit, the level of asset prices, and the interest rate:
As before, short-run dynamics, which may be important for identifying the long-run equilibrium between these variables, are automatically taken into account when the Johansen procedure is used to estimate equation (2.5). This implies estimating the cointegrating relationship between credit, asset prices and the interest rate. While the expected signs are ambiguous, their estimated empirical values will provide some insight into the longer-run relationship between asset prices and credit.
The results are presented in Table 2.2 for the share price index in the first panel, and the aggregate asset price index in the second panel. In both cases, there appears to be a single cointegrating vector, implying a long-run equilibrium relationship between the level of credit, the value of assets and the interest rate. The long-run coefficients are positive for asset prices and negative for the interest rate. The positive asset price coefficient suggests that expected wealth on the demand side, and the value of asset collateral on the supply side, dominate any (negative) substitution effects in demand.
| Long-run Coefficient | Short-run Coefficient | Max λ Cointegration Test |
Trace Cointegration Test | |||
|---|---|---|---|---|---|---|
| (Sample Period: 1976Q1 – 1992Q1) | ||||||
| AFI Credit | Ho:r=2 | 4.49 | Ho:r≤2 | 4.49 | ||
| Share Price Index | 1.35 | Ho:r=1 | 12.34 | Ho:r≤1 | 16.84 | |
| Loan Rate/100 | −1.57 | Ho:r=0 | 23.56** | Ho:r≤0 | 40.39** | |
| % Change Credit (t−1) | −0.92*** | |||||
| AFI Credit | Ho:r=2 | 3.73 | Ho:r≤2 | 3.73 | ||
| Agg. Asset Price | 1.62 | Ho:r=1 | 10.56 | Ho:r≤1 | 14.30 | |
| Loan Rate/100 | −1.72 | Ho:r=0 | 27.82*** | Ho:r≤0 | 42.12** | |
| % Change Credit (t−1) | −0.92*** | |||||
Note: The Johansen procedure is used to test for cointegration between the log of credit, the log of the share or asset price index, and the loan rate. Six lags are used. Three asterisks denotes rejection of the null hypothesis shown at the one per cent level, two asterisks at the five per cent level, and one asterisk at the ten per cent level. | ||||||
The negative interest rate sign suggests that demand-side factors dominate any (positive) supply-side effects of the level of interest rates.
These results are consistent with the views outlined earlier concerning how financial fragility problems might arise. As asset prices start to rise, loan demand rises for speculative purposes, and loan supply expands because rising nominal wealth provides adequate collateral. However, if asset prices overshoot, because of positive feedback, or international spillover effects, their reversal will leave outstanding levels of debt that are “too large”. In the absence of renewed growth in asset prices, equilibrium can be restored only by winding back the outstanding stock of credit. To the extent that credit is important in financing expenditure, this will have implications for the business cycle.
(d) Some Implications for Monetary Policy
Economic theory suggests that monetary policy in liberalised financial markets influences economic activity and inflation (via the Phillips curve) through wealth and intertemporal substitution effects. Causation is from monetary policy to unobservable expected future income, wealth and spending. Credit does not itself cause economic activity, but it may reflect intertemporal substitution and wealth effects.
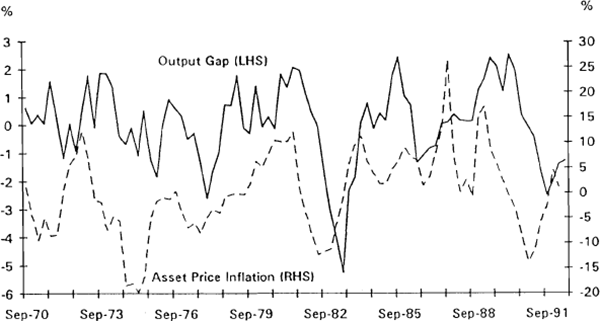
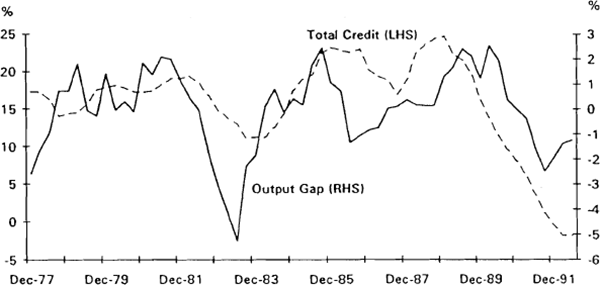
The central role of asset prices in leading the business cycle is illustrated in Figure 2.5, which shows the output gap (measured relative to a trend defined by the Hodrick-Prescott filter) and the four-quarter-ended percentage change in the aggregate asset price index. The rate of growth of credit is also shown in the second panel, though here the relationship is more tenuous, with credit leading the upturn in 1988 and the downturn in the early 1990s, but at other times lagging the cycle in real activity. Econometric evidence derived from estimating equation (2.6) over the period 1969 Q3 to 1992 Q1, confirms that aggregate asset prices are a highly significant leading indicator of the output gap:
Ho : α1.....α4 = 0 Chi – Square Value 50.22***
Ho : β1.....β4 = 0 Chi – Square Value 10.37**
Three asterisks denotes significance at the 1 per cent level and two asterisks at the 5 per cent level.
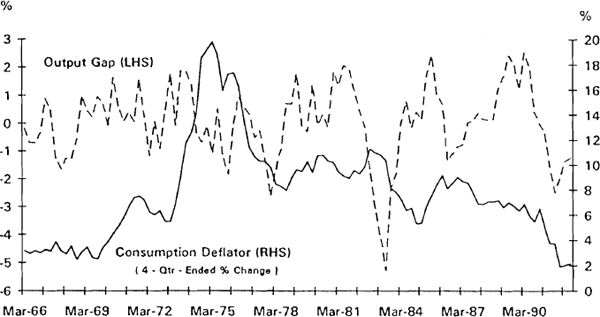
This linkage between asset prices in the monetary transmission mechanism and the output gap is important, since a principal objective of monetary policy is to achieve low inflation. Previous research has shown that the output gap has had a significant and stable influence on Australian inflation over sample periods estimated to the late 1980s.[5] This is illustrated in Figure 2.6, which shows the output gap and the four-quarter-ended percentage change in the consumption deflator. Subsequently, this relationship weakened; the late 1980s saw a very strong upswing in economic activity which did not result in increased inflation.
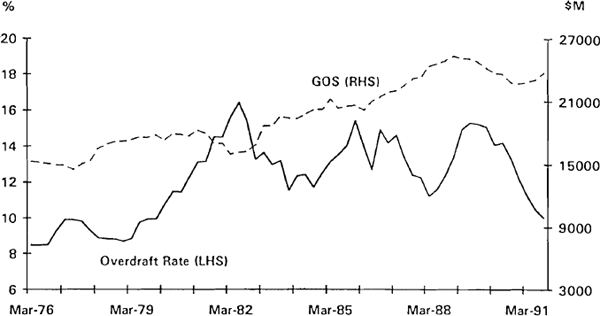
The main explanation of this recent anomaly is the success of the Accord in containing wages growth despite tight labour market conditions. Wage restraint in the face of rising nominal demand implied a continuation of earlier improvements in Gross Operating Surplus (GOS) during the 1980s. Profits rose through 1987 and 1988, while interest rates at first declined (see Figure 2.7). These pressures, however, appear to have spilled over into the asset price inflation that was under way at the time. Consistent with the above empirical findings, the divergent movements of GOS and interest rates contributed to the strength of asset prices in the late 1980s. As nominal wealth rose, so too did collateral available to banks for lending, further fueling asset price inflation.
Strong profits, favourable business expectations, rising asset prices and related borrowing contributed to the strength of economic activity during the upswing in the business cycle in the late 1980s. While the Accord could delay the impact of strong economic activity on inflation for a time, it could not be expected to do so indefinitely. If monetary policy had not been tightened in the late 1980s, increased demand pressures would eventually have led to a rise in goods price inflation. Since wealth effects are a key element of the monetary transmission mechanism, any “cooling” of economic activity required the asset price inflation be brought to a halt.
Perhaps the most important lesson of this period, however, is that speculative increases in asset prices and borrowing, once under way, are difficult to reverse in the short run. During such periods, asset prices appear to be less directly responsive to monetary policy, implying the need for higher interest rates than would otherwise be the case. This appears to be due to anticipated capital gains from speculative buying which, if realised, would make even very high nominal interest rates seem of less consequence. Reinforcing this, as Macfarlane (1989) has emphasised, the tax deductability of nominal interest payments for businesses encouraged borrowing (rather than use of equity) to finance asset purchases. These circumstances were somewhat akin to a “knife edge”, making it difficult to control the extent to which expectations about the future would decline, once the asset price inflation was reversed.
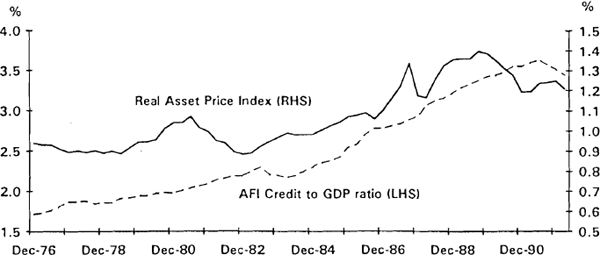
A second implication of the above analysis is that banks do not appear to have distinguished between collateral values justified by economic “fundamentals”, and those inflated by speculation. Corporate borrowing during the late 1980s proved, with hindsight, to be much too large in relation to the underlying value of assets. When asset price inflation was reversed, a period of slowing and then negative credit growth followed. This is illustrated in Figure 2.8, which shows the AFI credit to GDP ratio and the aggregate asset price index as a ratio to the consumption deflator. Both series appear to have changed trend in an upward direction during the 1980s. The decline in asset values at the end of the 1980s leads the decline in the credit to GDP ratio. There can be little doubt that this process is a painful one, with balance sheet restructuring by banks tending to make for cautious lending attitudes.
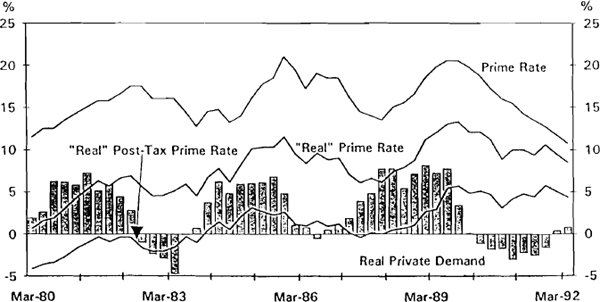
These financial considerations appear to be a major explanation of the slow nature of the recovery at present. While the demand for loans declined in line with business expectations during the recession, the supply curve of loans has also moved inwards. Figure 2.9 shows the prime lending rate in nominal and real terms, as well as the after-tax real prime rate, during the early 1980s and early 1990s recessions. Real lending rates remain high for this stage of the cycle.
However, while there are important lessons to be learned from the experiences of the 1980s, the difficulties implied on the basis of this experience for the conduct of monetary policy in the future can be exaggerated. This is because financial liberalisation of the 1980s was a once-and-for-all major structural change.
The removal of constraints on financial intermediaries released pent-up demand for investments. This contributed to, and was reinforced by, strong growth and rising profits. As expectations about future returns improved, and asset prices rose, financial institutions were prepared to lend more and more. The problems of managing this transition to liberalised financial markets was then complicated by the positive feedback aspects of asset price dynamics, that had not been fully foreseen, and hence excessive borrowing. In these respects, the lack of experience of policy makers and market participants in asset price and borrowing dynamics in liberalised financial systems is likely to have been a contributory factor.[6]
The general nature of the difficulties encountered is underlined by the fact that Australia's experience was by no means unique. While the household and corporate sectors were affected to different degrees, most other countries that liberalised their financial markets had broadly similar experiences. Since managing the transition from a regulated to a deregulated financial system is now largely behind them, it is unlikely that these particular shocks will be repeated in these countries.
One lesson that should not be drawn from the experiences of the 1980s and early 1990s is that any asset price inflation is a bad thing. Discussions about whether monetary policy should target asset price inflation directly come very close to this notion.[7] This would be an over-reaction to recent events. Asset prices, it was noted earlier, adjust in response to expectations about future activity and returns, as well as in response to monetary policy and short-run speculative dynamics. Asset price adjustments in response to changing fundamentals represent relative price shifts that have little to do with on-going inflation. In this sense, it is doubtful whether economies will significantly recover from their current relatively weak state, and borrowing resume, until there is some improvement in fundamentals, and hence in the relative price of assets. The task for monetary policy is to permit these relative price adjustments to occur, while avoiding speculative bubbles and excessively easy monetary policy when the upturn reaches a more mature stage.
Footnotes
Weighted by the average components of wealth derived in Callen (1991). [1]
These are discussed in Blundell-Wignall and Gizycki (1992). See in particular Bernanke and Gertler (1989) and Greenwald and Stiglitz (1990). [2]
See Johansen (1988) and Johansen and Juselius (1990). The main advantage of such system estimation is that it facilitates the identification of the number of cointegrating relationships characterising the set of variables. [3]
In the case of business lending by Australian financial intermediaries, Blundell-Wignall and Gizycki (1992) find that the market value of corporate equity (as collateral) is a key determinant of loan supply, in a model of the demand and supply functions for business loans. [4]
See Blundell-Wignall, Lowe and Tarditi (1992). [5]
It is worth noting that one has to go back to the 1890s and 1920s/30s to find parallel episodes. [6]
This was discussed at the recent international conference on inflation at the Reserve Bank. See Blundell-Wignall (ed.) (1992). [7]


