RDP 9404: Wage Dispersion and Labour Market Institutions: A Cross Country Study
Appendix 1: Wage Dispersion Summary Statistics
Michael Coelli, Jerome Fahrer and Holly Lindsay
June 1994
Table A1.1: Coefficient of Variation of Nominal Wages (x 100)
|
Period
|
Sectors
|
1960–73
|
1974–83
|
1984–90
|
| Australia |
1969–90 |
10 |
22.3 |
20.1 |
21.7 |
| Belgium |
1975–90 |
8 |
|
15.5 |
18.2 |
| Denmark |
1966–90 |
10 |
14.0 |
7.7 |
8.1 |
| Finland |
1960–90 |
10 |
18.5 |
10.1 |
11.1 |
| France |
1977–87 |
9 |
|
10.1 |
10.4 |
| Germany |
1970–89 |
9 |
14.6 |
13.8 |
13.6 |
| Iceland |
1973–89 |
9 |
18.7 |
17.3 |
19.2 |
| Italy |
1970–90 |
8 |
27.0 |
20.8 |
19.2 |
| Japan |
1970–90 |
10 |
25.4 |
25.9 |
28.0 |
| Luxembourg |
1975–90 |
9 |
|
23.7 |
25.0 |
| Norway |
1962–90 |
10 |
20.0 |
21.8 |
22.0 |
| Sweden |
1980–90 |
10 |
|
12.4 |
14.3 |
| United Kingdom |
1971–87 |
10 |
16.0 |
18.6 |
21.5 |
| United States |
1960–87 |
10 |
18.0 |
19.8 |
20.8 |
| AVERAGE |
|
|
19.5 |
17.0 |
18.1 |
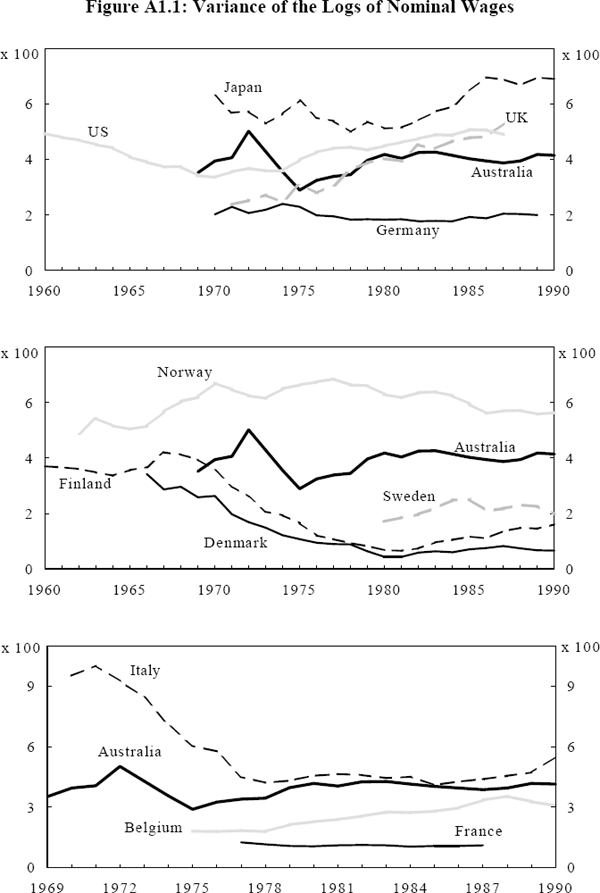
Table A1.2: Variance of the Log of Nominal Wages (x 100)
|
Period
|
Sectors
|
1960–73
|
1974–83
|
1984–90
|
| Australia |
1969–90 |
10 |
4.17 |
3.73 |
4.04 |
| Belgium |
1975–90 |
8 |
|
2.15 |
3.10 |
| Denmark |
1966–90 |
10 |
2.46 |
0.78 |
0.71 |
| Finland |
1960–90 |
10 |
3.47 |
1.07 |
1.32 |
| France |
1977–87 |
9 |
|
1.12 |
1.08 |
| Germany |
1970–89 |
9 |
2.14 |
1.95 |
1.94 |
| Iceland |
1973–89 |
9 |
3.33 |
2.72 |
2.86 |
| Italy |
1970–90 |
8 |
9.31 |
5.01 |
4.58 |
| Japan |
1970–90 |
10 |
5.75 |
5.45 |
6.68 |
| Luxembourg |
1975–90 |
9 |
|
5.65 |
6.54 |
| Norway |
1962–90 |
10 |
5.77 |
6.52 |
5.78 |
| Sweden |
1980–90 |
10 |
|
1.93 |
2.26 |
| United Kingdom |
1971–87 |
10 |
2.54 |
3.58 |
4.89 |
| United States |
1960–87 |
10 |
4.03 |
4.38 |
4.98 |
| AVERAGE |
|
|
4.30 |
3.29 |
3.63 |
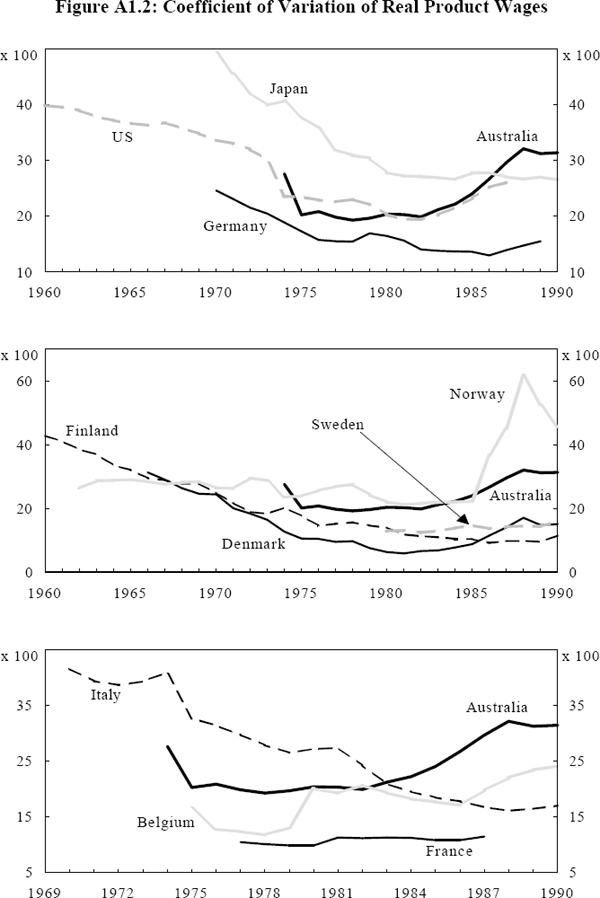
Table A1.3: Coefficient of Variation of Real Product Wages (x 100)
|
Period
|
Sectors
|
1960–73
|
1974–83
|
1984–90
|
| Australia |
1974–90 |
10 |
|
20.9 |
28.2 |
| Belgium |
1975–90 |
8 |
|
16.2 |
20.3 |
| Denmark |
1966–90 |
10 |
23.8 |
8.6 |
12.7 |
| Finland |
1960–90 |
10 |
30.2 |
14.6 |
10.1 |
| France |
1977–87 |
9 |
|
10.6 |
11.1 |
| Germany |
1970–89 |
9 |
22.4 |
16.0 |
14.1 |
| Iceland |
1973–89 |
9 |
22.6 |
18.0 |
24.1 |
| Italy |
1970–90 |
8 |
39.6 |
28.8 |
17.4 |
| Japan |
1970–90 |
10 |
44.2 |
31.6 |
27.0 |
| Luxembourg |
1975–90 |
9 |
|
26.5 |
27.5 |
| Norway |
1962–90 |
10 |
28.0 |
23.9 |
40.9 |
| Sweden |
1980–90 |
10 |
|
12.8 |
14.5 |
| United States |
1960–87 |
10 |
35.9 |
21.7 |
24.0 |
| AVERAGE |
|
|
30.8 |
19.2 |
20.9 |
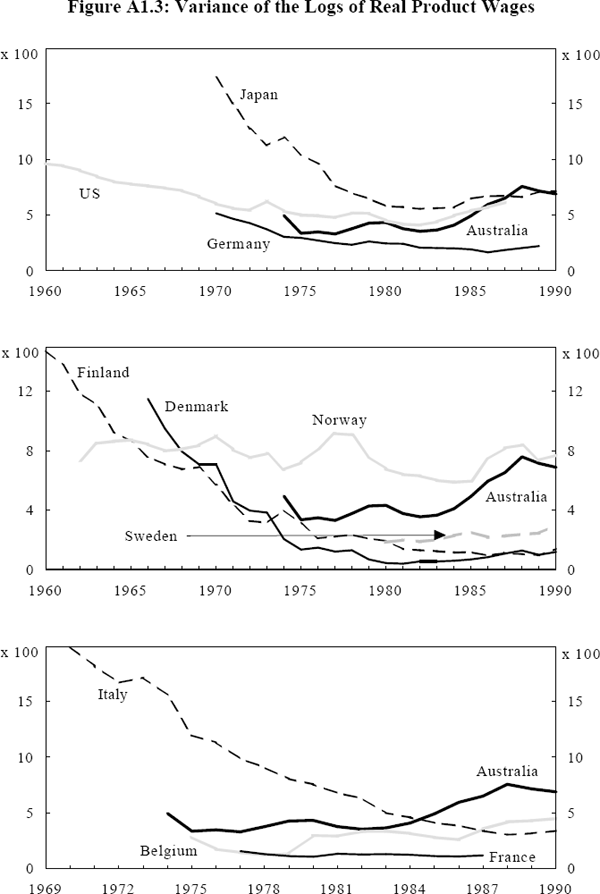
Table A1.4: Variance of the Log of Real Product Wages (x 100)
|
Period
|
Sectors
|
1960–73
|
1974–83
|
1984–90
|
| Australia |
1974–90 |
10 |
|
3.84 |
6.16 |
| Belgium |
1975–90 |
8 |
|
2.36 |
3.58 |
| Denmark |
1966–90 |
10 |
6.93 |
1.00 |
0.95 |
| Finland |
1960–90 |
10 |
8.14 |
2.17 |
1.11 |
| France |
1977–87 |
9 |
|
1.27 |
1.15 |
| Germany |
1970–89 |
9 |
4.45 |
2.51 |
1.95 |
| Iceland |
1973–89 |
9 |
4.48 |
2.86 |
5.03 |
| Italy |
1970–90 |
8 |
17.98 |
9.15 |
3.64 |
| Japan |
1970–90 |
10 |
14.10 |
7.57 |
6.63 |
| Luxembourg |
1975–90 |
9 |
|
6.92 |
8.22 |
| Norway |
1962–90 |
10 |
8.20 |
7.33 |
7.26 |
| Sweden |
1980–90 |
10 |
|
1.93 |
2.44 |
| United States |
1960–87 |
10 |
7.46 |
4.75 |
5.55 |
| AVERAGE |
|
|
8.97 |
4.13 |
4.13 |


