RDP 9807: Inflation Targeting in a Small Open Economy 3. Non-traded and Traded Inflation – Some Empirical Evidence
July 1998
- Download the Paper 422KB
We maintain throughout the paper that aggregate and non-traded inflation follow fundamentally different processes. This is confirmed by our analysis of Australian data. Dwyer, Kent and Pease (1994) have shown that the domestic currency price of traded goods depends on the world price and the exchange rate. This implies that the exchange rate plays a significant role in the determination of aggregate inflation, as we confirm below. In contrast, we show that the price of non-traded goods is determined primarily by domestic conditions, namely unit labour costs.
For the purpose of empirical estimation we construct measures of both the aggregate and non-traded underlying CPI for the Australian economy.[5] Disaggregated price series are used to construct measures of the underlying CPI for the traded and non-traded sectors. Price series are associated with either traded or non-traded sectors according to the classification scheme in Dwyer (1992). A sector is classified as traded if at least 10 per cent of production in that sector is exported or directly import competing. Remaining sectors are used to construct a measure of the non-traded CPI; further details are provided in Appendix A.[6]
Figure 1 shows our measures of underlying CPI inflation for both traded and non-traded goods and services. The published series for aggregate underlying CPI inflation is also shown.
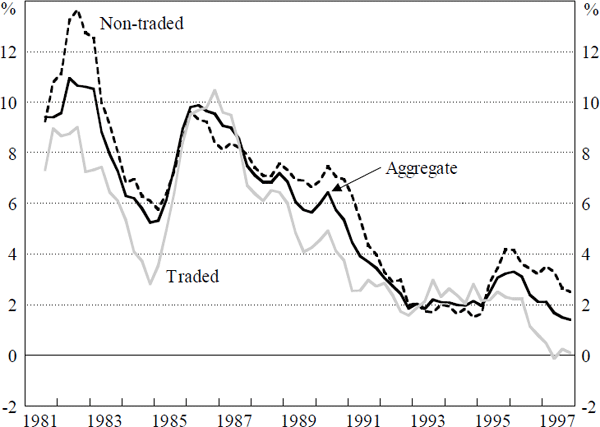
There are three episodes during the 1980s and 1990s for which traded and non-traded inflation behave somewhat differently.[7] The first episode is that of the early 1980s wage-push during which non-traded inflation reached almost 14 per cent, while traded inflation remained steady at around 9 per cent. The second episode coincides with the strong depreciation of the Australian dollar in 1985/86. The depreciation led to a rapid increase in traded inflation to rates above non-traded inflation, which had also increased, but to a lesser extent. Towards the end of this episode, non-traded inflation turned down almost a year before traded inflation. The third episode begins in 1995 when non-traded inflation increased against the background of strong domestic conditions, while the exchange rate appreciation reduced traded inflation.
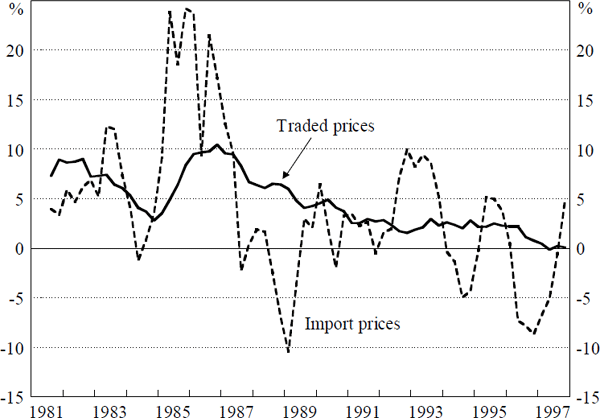
Figure 2 compares underlying CPI inflation of traded goods and services with import price inflation.[8] The volatility of import price inflation reflects rapid and complete first stage pass-through of the exchange rate to the price of imports (Dwyer, Kent and Pease 1994). In contrast, our measure of CPI inflation in the traded sector is less volatile. This is because our measure is based on final retail prices, and therefore, it incorporates a sizeable non-traded component due to the costs of bringing goods to market (Dwyer and Lam 1994). What we loosely refer to as traded inflation in our theoretical model, is in reality closer to import price inflation. While our measure of CPI inflation in the traded sector is not directly comparable with our theoretical definition, non-traded CPI inflation is consistent with our model. For this reason we focus our empirical analysis on the distinction between aggregate and non-traded CPI inflation.[9]
Following de Brouwer and Ericsson (1995), we adopt an error-correction framework in our estimation of Australian inflation. The model assumes a long-run relationship between the underlying CPI, unit labour costs and import prices. The mark-up of retail prices over the cost of production is determined in the short run by the output gap (see Appendix A for a further discussion). We estimate a model for both aggregate and non-traded inflation from September 1979 to December 1997. Results for parsimonious specifications are shown in Table 1, and indicate that a rise in unit labour costs and/or import prices will increase both measures of the CPI.
| Aggregate CPI inflation | Non-traded CPI inflation | ||
|---|---|---|---|
| Constant | 0.016*** (0.009) |
−0.009 (0.019) |
|
| Lagged aggregate/non-traded CPI (log level) |
−0.075* (0.015) |
−0.081* (0.015) |
|
| Lagged unit labour costs (log level) |
0.043* (0.013) |
0.066* (0.018) |
|
| Lagged import prices (log level) |
0.030* (0.006) |
0.020* (0.005) |
|
| Aggregate CPI inflation % change | (lag 2) |
0.234* (0.086) |
|
| Unit labour costs % change | (lag 0) |
0.201* (0.047) |
|
| (lag 3) |
−0.151* (0.046) |
||
| (lag 4) |
0.075*** (0.040) |
||
| Import prices (landed) % change | (lag 2) |
0.017 (0.011) |
|
| (lag 3) |
0.017*** (0.010) |
||
| Output gap | (lag 1) |
0.106* (0.033) |
|
| (lag 2) |
−0.099*** (0.050) |
||
| (lag 3) |
0.134* (0.034) |
0.087* (0.022) |
|
| Long-run elasticity – Unit labour costs | 0.579* (0.091) |
0.810* (0.097) |
|
| – Import prices | 0.399* (0.068) |
0.244* (0.079) |
|
| Linear homogeneity | {0.442} | {0.311} | |
| R-bar squared | 0.917 | 0.851 | |
| LM test – 4th order autocorrelation | {0.642} | {0.331} | |
Notes: Numbers in parentheses () are standard errors. Numbers in braces {} are p-values. *, ** and *** represent significance at the 1%, 5% and 10% levels respectively. |
|||
An increase in output above potential implies inflationary pressure. The significance of the coefficients on the lagged level of underlying CPI indicates that cointegration exists.[10] Homogeneity is not rejected in either model.[11]
Estimated long-run elasticities for aggregate and non-traded CPIs are shaded in Table 1. Import prices, and hence, the exchange rate, have a greater effect on the aggregate CPI with a long-run elasticity of 0.40. Unit labour costs have a greater effect on the non-traded CPI, with a long-run elasticity of 0.81, compared with 0.24 for import prices.[12]
In summary, our empirical results are consistent with the premise that aggregate inflation and non-traded inflation follow distinct processes. The exchange rate has a greater impact on aggregate inflation through its determination of traded goods prices, while prices in the non-traded sector depend more on domestic conditions.
Footnotes
Underlying CPI excludes items whose prices are seasonal, volatile or determined by government policy. [5]
A similar methodology has been applied to producer price series in Knight and Johnson (1997). [6]
The average level of non-traded inflation is noticeably higher over this period. This could be due to a productivity difference between the traded and non-traded sectors (Balassa 1964; Samuelson 1964). Alternatively, the trend in the relative price of non-traded to traded goods and services could be due to measurement problems that tend to understate quality improvements in services which have a larger weight in the non-traded consumption basket (Moulton and Moses 1997). [7]
The price of imports is equal to the free on board price of merchandise imports (excluding oil, computers and ‘lumpy’ items such as aircraft). [8]
In some respects it may appear to be more appropriate to distinguish between import price inflation and domestic inflation, rather than traded and non-traded inflation (Svensson 1998; Ball 1998). However, a small open economy takes the prices of both imports and exports as given, with the prices of domestically produced import substitutes also being closely linked to world markets. To the extent that export goods are consumed domestically, their prices will also be determined by world markets. A large proportion of Australian exports are either resource or rural based, and therefore are not directly relevant to measures of consumer price inflation. Also, Dwyer, Kent and Pease (1994) showed that prices of manufactured exports are determined according to a world market for manufactured goods, and therefore should move closely with the price of imports (which are themselves largely manufactures). [9]
Augmented Dickey-Fuller tests suggest that these variables are integrated of order one and that at least one cointegrating relationship exists. We do not present these results, however, similar findings are reported in de Brouwer and Ericsson (1995). [10]
We may expect that homogeneity should be rejected in this model if there is greater productivity growth in the traded sector relative to the non-traded sector. One way to address this problem would be to include a linear time trend to capture any productivity differential. Including a linear time trend did not alter our main findings. [11]
We also investigated the stability of these models by estimating over a rolling fixed window of 60 observations beginning in September 1974. There was a gradual increase in the importance of import prices and a decrease in the importance of unit labour costs in explaining inflation, consistent with increased openness of the economy. However, these models exhibit instability for sample periods beginning in the early 1980s, particularly in the case of aggregate inflation. The source of this instability is difficult to discern. [12]