RDP 2004-06: Profitability of Reserve Bank Foreign Exchange Operations: Twenty Years After the Float 4. Intervention Since the Float
September 2004
- Download the Paper 585KB
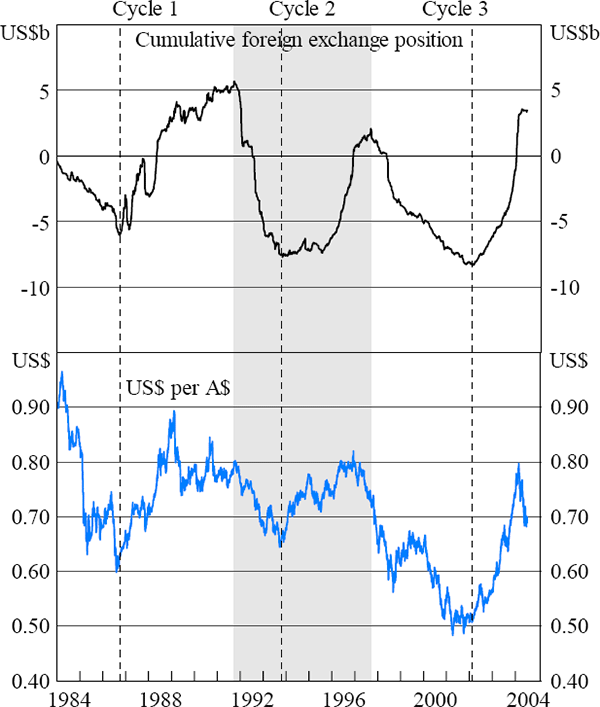
Over the post-float period, there have been three broad cycles of foreign exchange intervention reflecting the three cycles in the exchange rate: one in the second half of the 1980s; one in the first half of the 1990s; and one since 1997 (Figure 1). Each cycle began with the Australian dollar falling and the RBA selling foreign exchange, with the position reversed during the second phase of the cycle as the exchange rate rose.
Sources: RBA; Reuters
The timing of each cycle shown in the graph is defined in terms of the major turning points in the RBA's cumulative foreign exchange position resulting from intervention.[2] For instance, the initial phase of the first cycle extended from December 1983 to September 1986 during which the RBA was a net seller of foreign exchange with cumulative net sales peaking at US$6.0 billion in September 1986. From there through to September 1991, the RBA was a net buyer. Total purchases over that period amounted to US$11.7 billion, so that the cumulative position since the float moved from a net short position of US$6.0 billion in September 1986 to a net long position of US$5.7 billion in September 1991. The subsequent cycle saw net sales of foreign exchange between October 1991 and October 1993, and net purchases from November 1993 to September 1997, while the final cycle saw net sales from October 1997 to February 2002 and net purchases from March 2002 onwards.[3]
As noted, the RBA's approach to intervention has evolved over the past 20 years. In the early post-float period, the approach was characterised by the phrase ‘testing and smoothing’ and, reflecting this, transaction values were typically small and relatively frequent. This pattern of intervention continued through to 1986, when the sharp fall in the exchange rate resulted in intervention volumes being lifted significantly; about A$2 billion of intervention was undertaken over July and August 1986, with the largest amount done on a single day – over A$200 million – several times the previous maximum daily amount.
From the early 1990s onwards, the RBA further changed its approach to intervention. There was no longer any semblance of ‘testing and smoothing’, but rather the focus was very clearly on attempting to limit large-scale overshooting of the exchange rate. As a result, there have been prolonged periods of no intervention, punctuated by short-lived episodes of heavy intervention when the exchange rate had moved to either very low or very high levels.
Table 1 provides some summary statistics on the RBA's foreign exchange transactions in the market, for the entire period since the float, and in each of the three cycles of intervention outlined earlier.
| Post-float period(b) | Cycle 1 | Cycle 2 | Cycle 3 | ||||||||
|---|---|---|---|---|---|---|---|---|---|---|---|
| Depreciation(c) | Appreciation(c) | Depreciation | Appreciation | Depreciation | Appreciation | Depreciation | Appreciation | ||||
| Number of days in the period | 2,433 | 2,930 | 729 | 1,302 | 547 | 1,004 | 1,157 | 624 | |||
| Per cent of days with a transaction(d) | 28 | 51 | 53 | 67 | 24 | 28 | 15 | 54 | |||
| Per cent of days with purchases | 12 | 48 | 21 | 60 | 3 | 28 | 10 | 54 | |||
| Per cent of days with sales | 19 | 4 | 40 | 9 | 21 | 0 | 4 | 0 | |||
| Average purchase size (A$m) | 20 | 52 | 10 | 56 | 37 | 39 | 31 | 54 | |||
| Average sale size (A$m) | 69 | 106 | 21 | 108 | 152 | 46 | 157 | N/A | |||
| Largest daily purchase (A$m) | 250 | 659 | 75 | 659 | 150 | 286 | 250 | 376 | |||
| Largest daily sale (A$m) | 1,256 | 1,025 | 251 | 1,025 | 1,256 | 90 | 1,189 | N/A | |||
|
Notes: Data reported in this table refers to the daily sum of purchases or sales
of foreign exchange, not individual transactions per se. |
|||||||||||
Overall, in the 20 years since the float of the Australian dollar, the RBA has transacted with the market on 40 per cent of trading days. A large proportion of these transactions represent cover for Government business and, reflecting this, the RBA has transacted to purchase foreign exchange on about three times as many days as it has to sell foreign exchange. For the same reason, the average size of purchases is around half the average size of sales. Because of the change in the style of intervention after the 1980s, the figures for the latter period are quite different from those in the earlier period:
- the proportion of days on which the RBA intervened in the market declined after the 1980s. In the episode between 1983 and 1986, as the exchange rate fell, the RBA intervened in the market to buy Australian dollars on 40 per cent of days. In the subsequent two episodes when the exchange rate fell, the RBA intervened in the market on only about 21 per cent and 4 per cent of days, respectively;
- the average transaction size increased. The size of average daily sales of foreign exchange to support the Australian dollar in the 1983 to 1986 episode was about A$20 million, but rose to around A$155 million in the subsequent two episodes; and
- the maximum size of daily intervention increased. For example, the largest daily sale of foreign exchange was equivalent to about A$250 million in the 1980s episode, but about A$1,200 million in each of the subsequent two cycles.[4]
Since the float in 1983, the net position resulting from sales and purchases of foreign exchange by the RBA (including transactions with the Australian Government) has fluctuated around zero. This provides an approximate indication that the RBA has not systematically tried to support or weaken the Australian dollar over the floating period as a whole.
Footnotes
Changes in the RBA's net foreign exchange position are measured as the net of transactions with the market, the Government, and all other counterparties. Foreign currency received as earnings on foreign assets has been included as a ‘purchase’ of foreign exchange. The RBA takes into account such earnings in calculating how much foreign exchange to buy in the market to cover sales to the Government. Earnings therefore influence the discretionary actions of the RBA. [2]
The exact dates of the cycles are as follows: Cycle 1 – sales from 12 December 1983 to 25 September 1986 and purchases from 26 September 1986 to 23 September 1991; Cycle 2 – sales from 24 September 1991 to 27 October 1993 and purchases from 28 October 1993 to 2 September 1997; Cycle 3 – sales from 3 September 1997 to 7 February 2002 and purchases from 8 February 2002 to 30 June 2004. [3]
Note from Table 1 that in the second part of the first cycle the appreciation in the exchange rate was temporarily disrupted by the October 1987 stock market crash, with an ensuing bout of intervention and a maximum daily sale of foreign exchange of A$1,025 million. [4]