RDP 2010-06: Asset Prices, Credit Growth, Monetary and Other Policies: An Australian Case Study 3. Asset Prices and Credit Cycles in Australia
September 2010
- Download the Paper 297KB
3.1 Key Features of Australia's Earlier Financial Cycles
Australia has a long history of cycles in both asset prices and credit. Four episodes stand out as having had some degree of financial system instability and an economic slowdown. At the core of these episodes was a boom and bust in the property market centred on the early 1890s, early 1930s, mid 1970s and late 1980s/early 1990s.[21] Despite their similarities, there were substantial differences across these episodes in terms of the extent of damage done to the financial system during the phase of declining asset prices. These differences can in the main be traced back to the strength of competitive pressures, the prudence of financial institutions and the decline in lending standards during the expansionary phases.
The most extreme cycle, and the most damaging, lay behind the 1890s depression. The expansionary phase was underpinned by a sharp rise in competitive pressures among financial institutions, which encouraged an easing in lending standards and rapid growth of credit, much of which was channelled into the booming property market. The eventual downturn in the property market led to a severe financial crisis and a depression unequalled in Australia's experience. In stark contrast, Australia's financial system was relatively stable during the 1930s depression, notwithstanding a pronounced cycle in property prices. The cycle in credit was substantial but somewhat muted compared with the 1890s, helped in part by less intensive competitive pressures and more prudent behaviour by the banks. In turn, this reflected the change in market structure since the 1890s crisis and the memory of that disastrous episode.
The credit and property price cycle of the mid 1970s was spurred on by rising competition from an emerging fringe of non-bank financial institutions, while banks remained tightly constrained by regulations. There was a pronounced cycle in commercial property, ultimately leading to the failure of almost half of the largest 20 finance companies. However, high levels of debt were less problematic because much of the correction in real property prices occurred via relatively rapid generalised inflation.
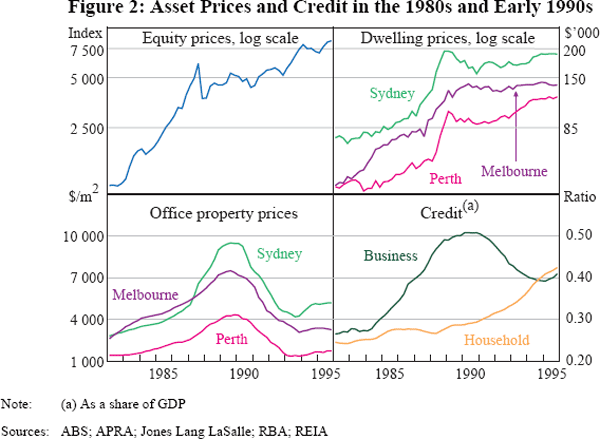
The cycle in credit and property prices of the late 1980s/early 1990s was driven by improving economic conditions and easier lending standards, which followed from financial deregulation in the 1980s. Businesses were the main recipients of the more readily available credit. A lot of reliance was placed on property as collateral. Not surprisingly then, the large rise in corporate gearing was associated with a boom in the commercial property market. Sydney office prices more than doubled between 1986 and 1989 but fell sharply thereafter to levels seen around seven years earlier (Figure 2). The October 1987 stock market crash had little impact on the commercial property market (or the economy more generally). It was not until interest rates were increased substantially that commercial property prices began to decline, with adverse effects on financial institutions and the economy more broadly. Eventually, two of Australia's largest banks experienced sizeable losses and had to issue more equity. The early 1990s recession was long lasting, in large part because of the substantial financial headwinds (Macfarlane 2006). Importantly, this event was in the living memory of bankers and policy-makers during the 2000s boom in housing prices and household credit.
3.2 Housing Market Developments in the Early 2000s
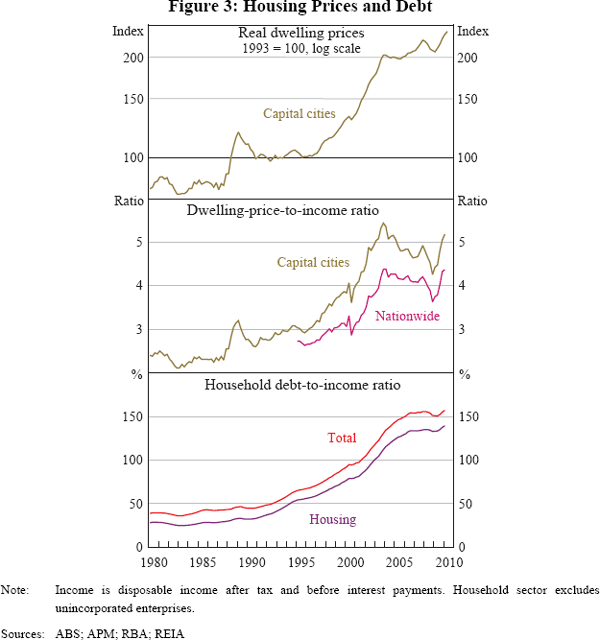
In contrast to these earlier episodes, the large run-up in housing prices and rapid growth of credit in the early 2000s was followed by a levelling out in housing prices for a few years, with little if any adverse impact on the financial system overall. Between 1997 and 2003, dwelling prices in Australia doubled (growing by an average of 13 per cent per annum). Growth was particularly rapid towards the end of this period, with median dwelling prices rising by an average of 18 per cent per annum in 2002 and 2003.[22] Dwelling price growth significantly outpaced growth in household disposable income, with the nationwide dwellingprice- to-income ratio rising from around 2½ in the mid 1990s to a little over 3 by 2001 and then to 4½ at its peak in early 2004 (Figure 3).[23] In late 2003, nationwide dwelling prices levelled out. Over the subsequent 18 months, capital city dwelling prices were broadly flat, though they fell in some key areas, particularly in western Sydney. Thereafter, nationwide dwelling prices grew at about the same pace as disposable income, with the price-to-income ratio trending down slightly before dipping during the financial crisis and rebounding more recently. The household debt-to-income ratio has also been broadly stable since 2006.
There were many factors which contributed to the prolonged housing price appreciation. Most were associated with structural changes that supported a rise in household indebtedness and greater demand for housing.[24] These included:
- The effects of the move to a low and stable inflation environment through the early 1990s. Lenders in Australia had frequently determined borrowing capacity according to a rule of thumb whereby initial repayments were no more than some fixed share of borrowers' income, typically around 30 per cent of gross income (Stevens 1997; RBA 2003a). By reducing nominal interest rates, lower inflation worked to ease this constraint by reducing initial repayments. Real interest rates also fell after lower inflation was secured, which helped to reduce the real costs of funds for institutions.
-
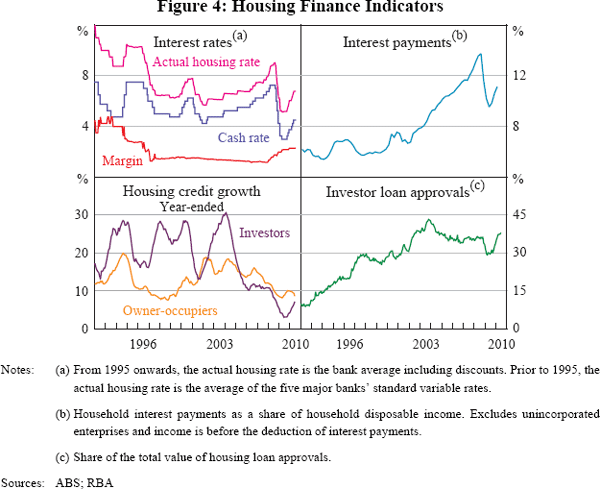
Rising competitive pressures (following financial market deregulation) and innovations which reduced the costs and increased the availability of credit. Mortgage interest rate margins were compressed significantly, by about 160 basis points over the second half of the 1990s (Figure 4). Innovations in securitisation enabled traditional banking institutions to broaden their funding base and provided low cost funding for unregulated lenders employing an ‘originate-to-distribute’ business model. These changes supported an easing in lending standards including via the introduction of new types of loans.
- A more favourable tax treatment for investors in housing. While Australia's tax arrangements have long been favourable to investors, in September 1999 the Federal Government significantly reduced the capital gains tax rate (RBA 2003b).[25] Although the rental yields were relatively low thereafter (Figure 5), the net cash flow position of households investing in rental properties was enhanced by the tax treatment of investment-related expenses.
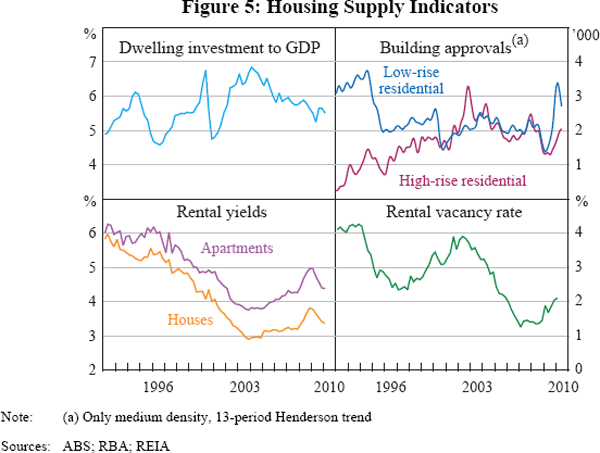
Assessing the extent to which the upswing in housing prices reflected fundamental factors is not easy. Most time-series modelling approaches seek to identify a stable long-run relationship, but this is notoriously difficult, particularly at times of significant structural change. However, given that housing prices had already increased substantially over a number of years, the pace of growth in 2002 and 2003 appeared to be unsustainable.[26] Indeed, much of the increased demand for housing and finance came from investors (as opposed to owner-occupiers). By 2003, nearly 45 per cent of all new housing loans were for investment purposes, compared to around 25 per cent over the four years prior to 2003, and an even lower share prior to this (Figure 4). This was despite very low rental yields, providing some evidence that investors were motivated by expectations of after-tax returns due to capital gains rather than the current investment income (Figure 5).
Financial innovations had encouraged investors into the housing market. Lending criteria on investor loans became easier from around 1996 as they moved into line with those that applied to owner-occupiers. Along with the removal of the interest rate penalty on investor loans (of about 1 percentage point in the mid 1990s), lowequity and interest-only loans became readily available. Also, new products – such as deposit bonds – allowed investors to purchase off-the-plan properties with no cash outlay upfront and with only small outlays to finance ongoing costs. At about the same time, a number of non-financial companies began to promote investment in residential property. It was ‘not uncommon … for promoters … to suggest that due to the operation of the tax system, investors [could] purchase an investment property worth $400,000 or $500,000 for as little as $50 per week’ (RBA 2003b, p 39).
Broader macroeconomic conditions were also conducive to rising household indebtedness as Australia's economy fared well through the global downturn of 2001, growing at an average rate of 4 per cent from 2001–2003. Initially this resilience reflected Australia's low production of information technology, and later was partly due to strength in the housing market and the effect of this on consumption. Australia's unemployment rate rose through 2001, though only back to levels of a year earlier, and by 2003 it was back down to around 6 per cent.
Against the background of a robust economy, housing credit growth picked up significantly. From an average of 14 per cent per annum from 1998–2001, it stepped up in 2002 and then again in 2003 to 21 per cent, significantly faster than the growth of household disposable income. Moreover, investor activity accounted for much of this growth. Household surveys (which became available only with some delay) suggest that the proportion of households owning investor or second homes rose from 16 per cent in 2002 to 20 per cent by 2006. The increase in household debt saw the household interest burden rise to new highs (although it has subsequently surpassed this level). It also increased the exposure of the financial system to the housing market, with housing credit rising from around 40 per cent of total credit in 1997 to 55 per cent in early 2005.
Over this period, there was little evidence that overall supply was running either substantially behind underlying demand (which would have supported dwelling prices) or ahead of underlying demand (which would have pushed down prices).[27] While there was a sharp pick-up in construction of apartment buildings, and a significant push by property developers to sell these apartments to investors, there were few signs of broader excess housing supply, with rental vacancy rates returning to around average levels after peaking in 2002 (Figure 5). Any overbuilding was fairly localised, with approvals for high-rise residential buildings rising sharply over 2002; by 2003 this had contributed to some fears of overbuilding in this segment of the market. Dwelling investment rose to above average in 2003, at 6½ per cent of GDP, though the introduction of a goods and services tax in 2000 – which added volatility into the housing construction measures – makes it difficult to assess how much of the run-up in dwelling investment in 2002–2003 was payback for earlier weakness.
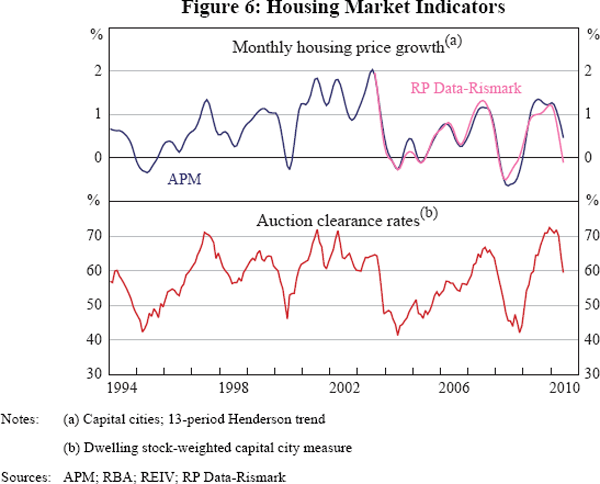
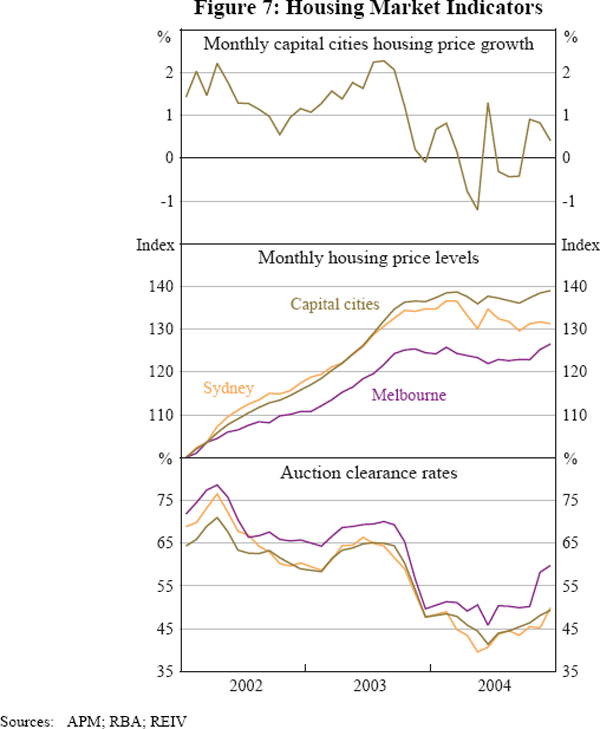
Housing market activity started to ease in October 2003 and growth of capital city dwelling prices overall stopped in the last two months of 2003 (Figures 6 and 7). They then remained broadly steady for about 18 months, though prices fell in Sydney and Melbourne. While reliable monthly housing price indicators were not available at the time, subsequent improvements allow us to confirm the timing of the easing in housing prices. Even so, timely data on auction markets were available (around 15 per cent of all residential sales occur at auction in Australia, though this varies substantially across cities), and auction clearance rates (the number of auctions resulting in a sale relative to auctions that take place) have a strong correlation with monthly housing price growth (of 0.9 on a nationwide basis). These rates declined in October 2003 and fell substantially to reach levels of previous troughs by June 2004.[28]
3.3 After 2003
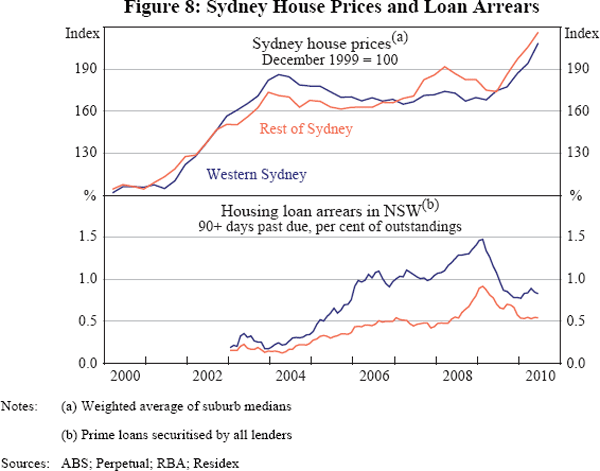
Housing prices fell for a period through 2004 in both Sydney and Melbourne. Large declines were apparent in the suburbs in western Sydney, where house prices fell by between 5 and 20 per cent (Figure 8). This part of Sydney accounts for about 6 per cent of the national housing stock and tends to have lower-priced housing than much of Sydney; prices also peaked later than in the rest of Sydney. A significant number of late entrants into the housing market in western Sydney had loans with high LVRs and low documentation. Also, mortgage originators (as opposed to banking institutions) comprised a greater share of new lending in this region than in others and, partly through looser lending standards, were able to increase their market share. Accordingly, western Sydney was the region of Australia that exhibited the most substantial rise in housing loan arrears and mortgage defaults, with an arrears rate considerably higher than the average arrears rate for loans in other parts of Sydney.
From 2004 until 2007, housing prices nationwide grew broadly in line with household disposable incomes and housing credit growth slowed considerably, especially for investors. Rents, which had previously not grown very strongly, picked up and there was an upward trend in the rental yield, consistent with low rental vacancy rates and a relative decline in home building. The shake-out of the housing market also had implications for financial institutions' balance sheets. On-balance sheet arrears for banks rose gradually and reached a local maximum of around 0.5 per cent of housing loans in early 2007, though they subsequently rose a little further largely due to increasing interest rates. Arrears rates on securitised housing loans rose earlier, by more and to a higher level, partly reflecting the larger share of low-documentation loans in the securitised pool.
The rise in housing loan arrears was eventually reflected in more widespread concerns about lending practices and some additional tightening in lending standards, although pinpointing the timing and extent of this is hindered by data limitations.[29] Periodic surveys of banks and data on the characteristics of securitised mortgages provide some information in this regard, though these provide only a partial view due to significant shifts in the market share of mortgage lenders. Available evidence suggests that lending standards tightened after housing prices declined, albeit with considerable delay. Eventually, a parliamentary inquiry was held on ‘Home Lending Practices and Processes’ in August 2007, with submissions from a range of institutions including the Reserve Bank, APRA and the lenders' mortgage insurance (LMI) providers. Australia's largest LMI provider, Genworth Financial, noted a number of areas in which insurance companies could help to ensure prudent lending practices, including detailed underwriting guidelines for high LVR loans, procedures to verify property valuations, and scoring techniques to identify high-risk loans (Genworth Financial 2007).
Footnotes
For a detailed comparison of these episodes see Kent and D'Arcy (2000) and Kent (forthcoming). Simon (2003) provides a broad discussion of booms and busts in Australian asset markets. [21]
The rise in dwelling prices between 1997 and 2003 was broadly based, albeit with different timing and intensity across regions – stronger earlier in the larger cities of Sydney and Melbourne (which together account for around 40 per cent of the national dwelling stock), and more rapid in the smaller capital cities in 2002 and 2003. [22]
The capital cities dwelling-price-to-income ratio presented here is biased upwards as the income measure includes regional areas, which typically have lower incomes than the capital cities. The nationwide measure is lower, though not available for the earlier history. In Australia, around 60 per cent of the value of the housing stock is located in the capital cities. [23]
Kent, Ossolinski and Willard (2007) discuss these trends across a range of economies. [24]
From September 1999, half of the capital gain from assets held for at least a year became exempt from tax; prior to this, taxes were assessed according to real capital gains (based on the CPI). The taxpayers' main residence is exempt from capital gains tax, although interest payments are not tax deductible. [25]
Analysis similar to that of Borio and Lowe (2002) (and updated by Borio and Drehmann 2009) using measures of the deviation of credit-to-GDP and house prices from real-time trends, suggests that such ‘gap’ indicators breached the threshold values (posited by Borio and Lowe) around 2002–2003. Hence, imbalances that have historically been associated with financial crises were present in the period of interest. However, the results of this approach are quite sensitive to the choice of smoothing parameters, which would likely limit its usefulness as a way of gauging imbalances for application in a rule-based approach to policy. [26]
Estimates of underlying demand can be calculated using data on population growth, average household size and the number of vacant dwellings (including holiday houses, etc). [27]
Measures of consumer sentiment regarding whether it is a ‘good time to buy a dwelling’ also fell sharply in December quarter 2003, after having taken a step down in 2002 from earlier very high levels, due to rising interest rates and falling affordability. [28]
APRA now collects data on types of loans by banking institutions and LVRs on new loans. [29]