RDP 2011-08: The Mining Industry: From Bust to Boom 4. The Effect of the Mining Boom on the Broader Economy
December 2011
- Download the Paper 1.02MB
Thus far the discussion has focused primarily on trends within the mining industry itself. The growth of the mining industry over the past decade also affected other parts of the Australian economy, as described below.
4.1 Theory and Overview of the Evidence
Traditional trade theories outline how an economy is likely to evolve following an increase in the price of its major export. Using a Heckscher-Ohlin-Samuelson framework extended to three sectors (commodities, other tradables and non-tradables), a rise in the global price of commodities has a factor transfer and an income effect.[13] Assuming the economy is at full employment, the factor transfer effect reflects the movement of labour and other factors towards the production of mining and its intermediate inputs (such as mining equipment and exploration services) as inputs are bid away from the production of other tradables (e.g. non-mining manufacturing, education, tourism) and non-tradables (services like health and child care, dwelling construction, etc) in response to the increase in commodity prices and mining industry profits. As a consequence of this effect, output of other tradables and of non-tradables falls.
The income effect reflects the changes in the output of different industries within the economy as the higher commodity export earnings are spent. In addition to payment for the inputs used, mining receipts are distributed as tax and royalty payments to federal and state governments and boost the income and wealth of resident shareholders via dividend payments and higher equity prices. To the extent these income gains are spent rather than saved, demand for other tradables and non-tradables increases. Assuming tradable prices are fixed at global prices, this increase in demand raises the relative price of non-tradables to tradables (i.e. the real exchange rate appreciates) as well as imports of other tradables. Hence, while domestic production of other tradables is lower (due to the factor transfer effect), the final effect on the level of non-tradable output depends on whether the income effect dominates the transfer effect.
While the direction of these various effects is well identified by theory, their magnitude depends on a range of factors. In general, the transfer effect following an increase in commodity prices will be smaller: the more excess capacity there is in labour and other input markets at the outset of the adjustment; the smaller the amount of inputs used in the production of mining output; and/or the easier the ability to import mining-related labour and capital rather than having to source them domestically. Further, the larger the share of the mining industry owned by foreigners, the smaller will be the income effect. In regard to price movements, the greater the degree of substitutability between non-tradables and tradables in consumption, the smaller will be the change in the real exchange rate. More broadly, the higher the degree of flexibility in the economy, the smaller will be the magnitude of the overall wage, price and exchange rate changes necessary to induce inputs and the pattern of spending to shift in response to the rise in mining production and domestic demand.
In practice, tracking the magnitude of the mining boom's effects on the structure of the overall economy is challenging, not least because the expansion of the mining industry in the 2000s occurred around the same time as other significant developments, such as the slowing pace of productivity growth and changes in household spending behaviour (discussed in Gerard and Kearns (2011)). Nonetheless, a general overview of the magnitude of the recent changes that have occurred throughout the economy can be provided by calculating structural change indices. Specifically, we examine here the changes in the share of different industries in total nominal output, real output, employment and nominal investment. We also use the same measures to evaluate structural change over time between the Australian states, in order to get a feel for the degree of change in the resource-rich and non-resource parts of the economy.
The structural change index (SCI) used takes the form:
where xi,t is the average share of industry (or state) i in the economy in the five years to year t; we use five-year averages to abstract from short-term variation within the economy.[14] The eight industry groups are: agriculture; mining; manufacturing; construction; distribution services and utilities; business services; social services; and personal services. For the state measures, the Northern Territory is included with South Australia and the Australian Capital Territory with New South Wales for data availability reasons. Under these measures, if there has been no change in the relative importance of different industries (or Australian states) over the period, the indices have a value of zero. If, however, the share of one industry (or state) has increased by say 2 percentage points over the five-year period (with a corresponding decrease in the shares of other industries or states), the index has a value of 2.
As is readily apparent from Figure 15, for several measures the rate of structural change has increased since the early 2000s, which corresponds with the onset of the mining boom. For the industry measures, this is particularly noticeable in the measure for nominal output – reflecting the sharp rise in commodity prices over recent years – and is also evident in the investment measure. In contrast, the degree of structural change in the share of the various industries in real output and employment has not been especially large over recent years. This reflects, in part, the inevitable lags between the start of the large investment projects and the increase in mining output, the fact that much of the change to date has occurred within industries rather than between them, and that the mining industry directly employs a relatively small share of the workforce (as discussed below).
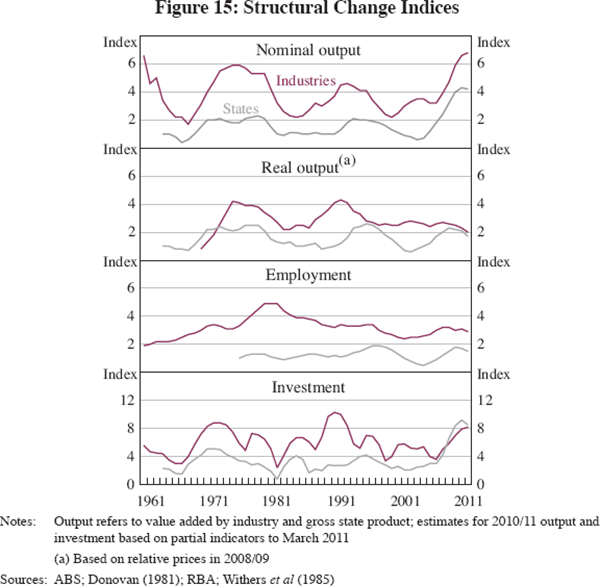
In the measures covering divergences among the various Australian states, the rate of structural change in their total nominal output and investment has been the highest over the past 50 years, reflaecting in part that the current mining boom is larger and more geographically concentrated than the booms between the late 1960s and the early 1980s. While the degrees of structural change in the state shares of real output and employment have increased, they have nonetheless been around levels seen during previous periods of high structural change. In fact, on both measures the degree of structural change within the Australian states has fallen back somewhat of late, as output and employment trends in the resource-rich states have more closely followed those of the other states. We now turn to a more detailed discussion of the various direct and indirect effects of the mining industry expansion on the rest of the economy that lie behind these developments, focusing first on the national and then the state economies.
4.2 Direct Effects of the Mining Industry on the National Economy
According to data from the Australian Bureau of Statistics (ABS), mining industry revenue increased from around 6 per cent of GDP in 2000 to 14 per cent of GDP by the end of the decade, an average annual growth rate of almost 15 per cent (Table 6). As noted earlier, much of this reflected the rise in global commodity prices, although increases in mining output also played a part. After paying for the labour and other intermediate inputs used in mining operations, the balance of the revenue (termed the gross operating surplus) is divided between royalty and tax payments, immediate dividend distributions and retained earnings (after deducting interest and depreciation). In the rest of this section, the links between each of these components with the rest of the economy are examined, as well as the large increase in mining investment that has also boosted activity in the national economy.
| 1999/2000 | 2003/04 | 2008/09 | 2010/11(a) | |
|---|---|---|---|---|
| Revenue – $b | 43 | 63 | 177 | 195 |
| Labour costs | 5 | 8 | 18 | 21 |
| Intermediate input costs | 18 | 28 | 70 | 82 |
| Goods and materials | 6 | 9 | 23 | na |
| Services | 13 | 20 | 47 | na |
| Gross operating surplus(b) | 19 | 27 | 89 | 92 |
| Royalties | 3 | 4 | 11 | 11 |
| Company income tax | 1 | 3 | 13 | na |
| Other(c) | 15 | 20 | 65 | na |
| Memo item: Investment | 10 | 15 | 52 | 58 |
| Revenue – per cent of GDP | 6.5 | 7.3 | 14.1 | 14.2 |
| Labour costs | 0.8 | 0.9 | 1.4 | 1.6 |
| Intermediate input costs | 2.8 | 3.3 | 5.6 | 5.9 |
| Goods and materials | 0.8 | 1.0 | 1.8 | na |
| Services | 1.9 | 2.3 | 3.8 | na |
| Gross operating surplus(b) | 2.9 | 3.1 | 7.1 | 6.7 |
| Royalties | 0.4 | 0.5 | 0.9 | 0.8 |
| Company income tax | 0.2 | 0.3 | 1.1 | na |
| Other(c) | 2.2 | 2.3 | 5. 2 | na |
| Memo item: Investment | 1.4 | 1.7 | 4.2 | 4.2 |
|
Notes: (a) Estimates based on partial indicators to March 2011 Sources: ABS; Australian Taxation Offce; RBA; Australian and state government budget papers |
||||
4.2.1 Direct labour usage
Direct labour costs in mining operations have been equivalent to around 10 per cent of total mining receipts.[15] After falling gradually during the 1990s, employment in the mining industry grew rapidly during the 2000s, rising by around 10 per cent a year, compared with growth of around 2 per cent a year in the national economy. Indeed, the pace of mining employment growth during the decade was significantly higher than for virtually all other industries.
However, mining is very capital intensive and hence the amount of labour used for mining operations has remained comparatively small. Despite its rapid growth over the decade, mining employment increased by only 110,000 over the decade (to around 200,000 or 1.7 per cent of total employment), representing a small share of the 2.2 million increase in employment nationally.[16] Hence, while annual employment growth rates were below that of the mining industry, most other industries – especially within the services sector – saw an increase in the number of employed persons that was much larger, with health and social services employment in particular rising by a multiple of almost four times that of mining during the decade. The main exception was a decline in employment in manufacturing, but this continued a trend that has been evident for several decades.
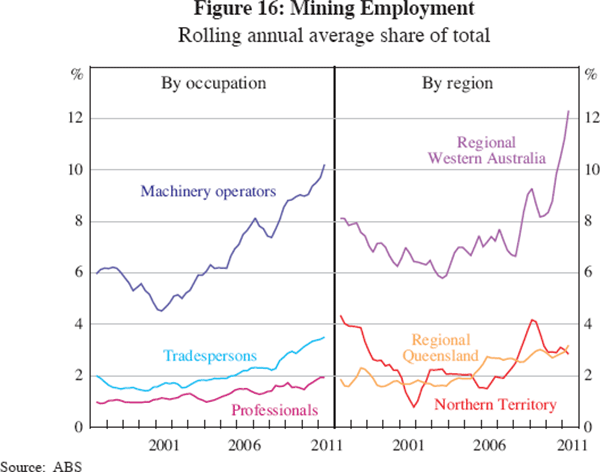
Mining employment is dominated by a few occupations, with one-third machinery operators, one-quarter tradespeople, and one-fifth professionals such as engineers. Even within these occupations the increases in the mining industry were small, with the share of machine operators working in mining rising from 6 per cent to 10 per cent of total national supply and tradespersons working in mining increasing from only 2 per cent to a little over 3 per cent (Figure 16). In addition, while mining provided a boost to employment in the regions of the country that have a comparatively high concentration of resources – the Northern Territory, Western Australia excluding Perth, and Queensland excluding Brisbane – the mining industry accounted for at most 12 per cent of these regions' total employment.
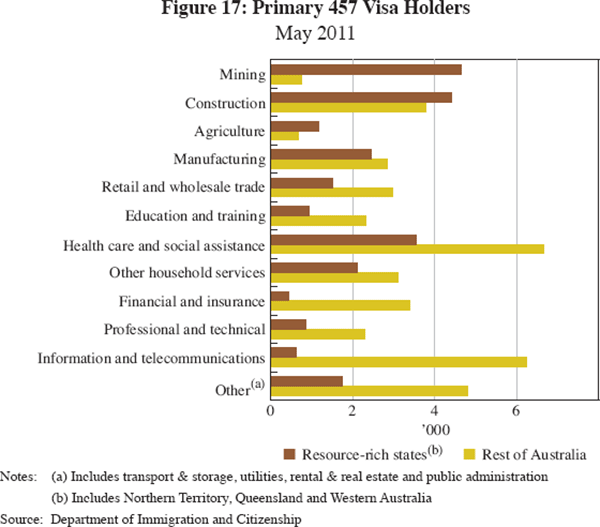
Some of this increase in mining employment during the decade was accommodated from outside the initial labour force. Coinciding with the onset of the mining boom, the participation rate rose by around 3 percentage points, initially jumping in the resource-rich states and later also rising in other states. The increase in the participation rate was accompanied by a strong rise in immigration to the resource-rich states. In part this reflected an increase in temporary migrants (the 457 business visa category), with the resource-rich states receiving the majority of those working in the mining and construction industries (around 4,500 in each industry; Figure 17). Nonetheless, the total number of 457 visa migrants in Australia has remained fairly low (72,300 as at mid 2011) although there are a range of other business visa categories.
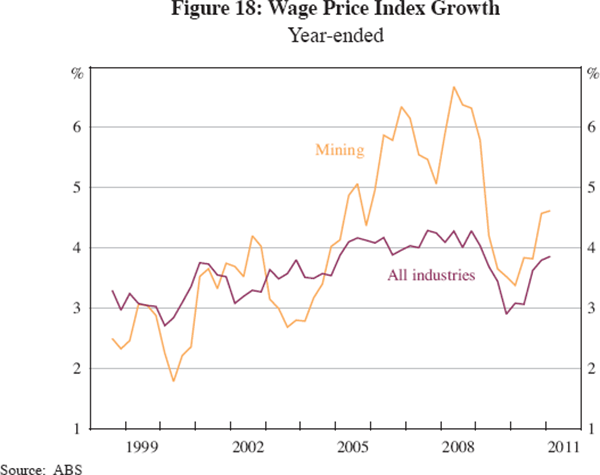
Given the remote areas in which many mines are located, mining wage levels are typically higher than in other sectors in order to attract labour towards the industry. Based on the ABS wage price index – which controls for changes in quality and the composition of the type of labour employed – annual mining wage growth was strong after the onset of the mining boom, peaking at 6½ per cent, and non-wage benefits growth was also reported to have been high (Figure 18). Furthermore, although mining wage growth slowed during the North Atlantic financial crisis, its pace has since picked back up. Nonetheless, there appears to have been only a limited degree of spillover to wages in the rest of the economy, which outside of the period of the financial crisis continued to grow at around 4 per cent. The Bank's recent business liaison also indicates that at least to date there has been fairly little impact of wage growth in the mining industry on wages in the broader economy, even in the occupations where there are early signs of emerging skill shortages.
4.2.2 Intermediate input usage for mining operations
Intermediate input costs have been much larger than direct labour costs, typically representing around 40 per cent of total mining revenue. Goods and materials used in mining operations constitute around one-third of intermediate input costs with the remainder being services, such as freight, contractors, rent and repairs. Intermediate input costs grew quickly after the onset of the mining boom, rising at an annual average rate of 15 per cent, or 3 per cent of GDP over the decade.
Input-output tables available from the ABS provide an indication of the types of industries in the economy that have been supported by the rise in intermediate input demand for mining operations, although the latest data are only available to 2006/07. The data suggest that of the goods used in mining operations, many were commodities provided by the industry itself (such as coal and ores). While purchases of petroleum and chemical products (such as fuel and explosives) were substantial, a high share of these purchases is imported by the companies providing these goods to the mining industry (Table 7). Metal products purchased from local companies are a smaller share of total mining intermediate inputs, and direct imports by mining companies constitute around 10 per cent of total mining intermediate inputs (which are primarily goods).[17]
| 1998/99 | 2006/07 | |
|---|---|---|
| Goods and materials | 35 | 34 |
| Mining products | 5 | 9 |
| Manufactured products | 18 | 15 |
| Petroleum, coal and chemicals | 6 | 8 |
| Metal products and machinery | 9 | 6 |
| Direct imports(a) | 12 | 10 |
| Services including contractors | 65 | 66 |
| Mining support services | 15 | 18 |
| Finance, insurance, property and business | 15 | 18 |
| Finance and insurance | 4 | 5 |
| Property and business | 11 | 13 |
| Construction(a) | 5 | 8 |
| Transport and storage | 12 | 6 |
| Wholesale and retail trade | 9 | 6 |
| Electricity, gas, water and waste services | 5 | 4 |
| Accommodation, cultural and personal | 2 | 4 |
|
Note: (a) May include a mix of goods and materials as well as services Source: ABS |
||
In contrast, purchases of services by mining companies for their operations – which constitute two-thirds of mining intermediate inputs – are more commonly provided locally, with, for instance, mining companies often contracting Australian businesses to undertake their ongoing service and maintenance due to their locational advantage. Around one-quarter of these purchases are support services provided by the mining industry itself, such as drilling, draining and plumbing. Another one-quarter are finance, insurance, property and business services, which includes a wide range of services such as engineering consulting, employment placement, legal, accounting, computer system design, marketing, rental and hiring of equipment, and mine support staff provided by service operators (e.g. cooks, cleaners and bus drivers). The rest of the intermediate service inputs covers activities such as transport and storage, distribution, accommodation and services provided by utilities companies.[18]
Not all of the increase in intermediate input costs over the past decade has reflected an increase in the quantity of goods and services supplied to the industry. Along with the increase in fuel prices, global competition for mining equipment has led to rapid growth in the prices of mining intermediate inputs. Reflecting this trend, the price index for materials and services used in coal mining for instance – such as prices for extraction, washing, preparation and transportation – grew at an average annual rate of 6 per cent from the mid 2000s, twice the pace of price growth in the broader domestic economy, after having grown in line with domestic prices over the preceding decade.
4.2.3 Tax and royalty payments
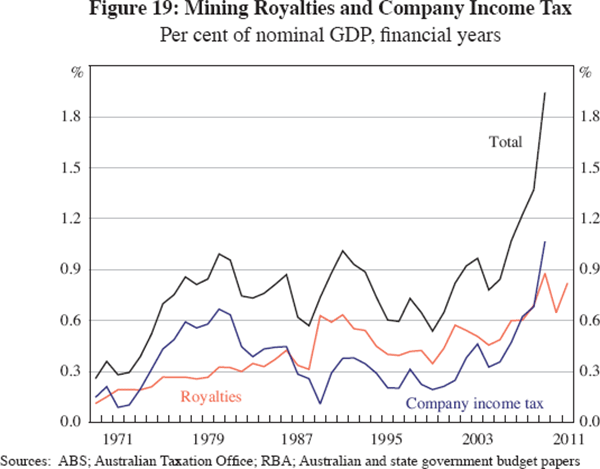
The mining companies pay royalties and taxes to various levels of government in Australia. Royalties and company income taxes paid by the mining industry increased from around ½ per cent of GDP at the start of the decade to around 2 per cent in 2008/09 (the latest available data) – their highest share of GDP since at least the late 1960s. As a share of annual mining receipts, these payments increased from around 10 per cent to almost 15 per cent over the decade. The rise in royalties and taxes was driven by the significant increases in global prices and to a lesser extent export volumes for bulk commodities, while the share of the oil and gas industry in payments to governments fell over the period, reflecting the gradual depletion of Australia's oil fields. Most of this increase was driven by mining income taxes; company income tax is levied on taxable profits, while mining royalties are generally levied on production and are less sensitive to movements in commodity prices (Figure 19).[19] The rise in tax and royalty payments to governments coincided with cuts in personal income taxes from the mid 2000s and a more recent rise in infrastructure investment (including under Western Australia's ‘Royalties for Regions’ program).
4.2.4 Dividends and retained earnings
The gross operating surplus of the mining industry, after deducting royalties and tax payments, rose from around $15 billion in 1999/2000 (2.2 per cent of GDP) to around $65 billion in 2008/09 (5.2 per cent). Earnings (after tax, interest and depreciation) are distributed to shareholders as dividends or retained within the company. Since the mining industry in Australia is majority foreign-owned, most dividends and retained earnings do not add to national income.
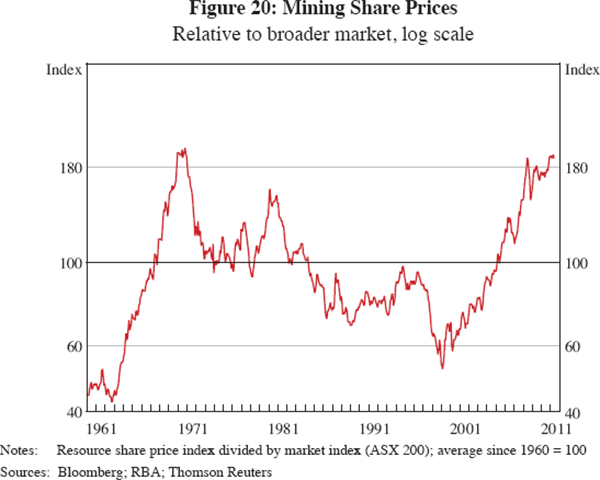
The foreign ownership share of the mining industry is difficult to determine for several reasons: many publicly listed equities are held in the name of nominee companies; holdings of companies listed on the ASX that are less than 5 per cent of total equity do not need to be disclosed; and the degree of foreign ownership varies by industry and even by specific mine. Overall, based on published data by the iron ore, coal and LNG producers, effective foreign ownership of the current mining operations in Australia could be around four-fifths, with the share for iron ore producers a little lower and coal and LNG producers a little higher. Part of the earnings to Australians is distributed by mining companies as dividends, with the balance retained by the companies and reflected in rising share valuations. Indeed, mining equity prices increased by 180 per cent relative to the broader market over the 2000s, providing a significant boost to the wealth of Australian residents over the decade (Figure 20).
4.2.5 Investment
Thus far this analysis has focused on the direct distribution of the mining sales receipts over the decade and its impact on activity and incomes within the broader economy. The mining industry also boosted spending in the Australian economy through its investment activity, which rose from $10 billion (1.4 per cent of GDP) at the start of the decade to around $58 billion (4.2 per cent) more recently.[20] This spending covers payments for construction workers and purchases of non-labour inputs for mining investment. It has been financed by a combination of foreign inflows from multinational energy companies – especially for many of the LNG project investments – and retained earnings from existing operators in Australia, such as those producing iron ore and coal.
In regard to the labour used during construction, large mining companies typically engage the services of engineering, procurement and construction management (EPCM) firms to oversee their investment projects. Part of the responsibilities of an EPCM firm is to procure the necessary labour, which can be supplied from its own staff or through subcontracting workers from more specialised construction firms. There is little information available on the total number of construction workers employed on mining projects at any one time, and the Bank's liaison indicates that contractors try where possible to shift labour from one project to the next as different stages of the projects advance. Modelling by the National Resources Sector Employment Taskforce (2010) suggested that the total number of mining-related construction workers employed is fairly small, at around 30,000 in 2010 (¼ per cent of national employment), although this is expected to rise in coming years.
A large part of the inputs used for mining investment is imported rather than sourced from the domestic economy. The share of total investment that is contracted domestically varies significantly depending on the technology used in the project, whether the equipment is assembled locally or imported wholly assembled, and the scale, specification and cost of the steel products used. In addition, the local content share varies from year to year depending on the stages the projects are in. For instance, while some of the labour employed in LNG investment occurs at the front-end when earth and civil works and port dredging is undertaken, more occurs at the back-end of the project after the large LNG modules arrive from offshore and need to be secured in place. Local spending also varies among the different iron ore and coals projects.[21]
Reports by the companies concerned and from official sources suggest in broad terms that over the life of a project the domestically contracted share of mining investment averages around 70–80 per cent for iron ore projects (which are comparatively labour intensive) and around 40–60 per cent for LNG projects (which are not as labour intensive). There is less information available in regard to the domestic spending share in the coal industry, but it may be broadly similar to that for iron ore.[22] However, all these estimates overstate to some extent the actual degree of local spending: the reported ‘domestic spend’ share is the amount contracted from locally based firms, part of which is subsequently sourced from abroad (e.g. for parts). Australian-based firms have indicated that much of the machinery and materials needed cannot be provided from local sources due to limited domestic capability to deliver the scale and specifications required. Adjusting for this effect, perhaps half of the total cost of mining investment in recent years has been domestically spent. This share may fall somewhat in coming years given the intensity of LNG investment and its lower domestic content compared with other mining activities.
Putting all this together, the increase in mining revenues in the 2000s made a significant direct contribution to economic activity and incomes of Australian residents. The main channels identified were through direct labour costs (around 10 per cent of total mining operational revenue), the mining industry's demand for domestically sourced intermediate inputs especially services (perhaps around 25 per cent of total revenue), tax and royalty payments (close to 15 per cent of total revenue in recent years), and the share of the after-tax profits owned by Australian residents (around 5–10 per cent of total revenue). While it is difficult to be exact, these estimates suggest that overall, Australian residents accrued a little over half of the total receipts earned from current mining operations. In addition, perhaps half of the total costs of mining investment was spent acquiring domestically supplied labour and other inputs, which generated further activity in the Australian economy.
4.3 Indirect Effects of the Mining Industry on the National Economy
As outlined in Kearns and Lowe (2011), the rise in global commodity prices and the associated rise in the terms of trade boosted the level of Australia's income during the decade.[23] Given the strong growth of income, demand growth outpaced that of output over the entire mining boom period, with the exception of a short period during the North Atlantic financial crisis. In line with the predictions of the theory outlined earlier, in response to this spending the pace of non-tradables inflation picked up after the onset of the mining boom, running at around 4 per cent a year compared with 3 per cent in the preceding years, while inflation in tradables (excluding fuel) averaged around 1 per cent a year. Consistent with this, measures of the real exchange rate appreciated, rising by around 35 per cent over the mining boom period.
There is also evidence that this large rise in the real exchange rate over the decade has been associated with a shift in spending from non-tradables to tradables. The pace of import volumes growth over the decade has picked up noticeably, especially for capital imports for businesses and foreign travel by residents. Similarly, the pace of growth of exports has slowed for a range of manufactured goods and tourism services.[24] Within the domestic economy, demand conditions varied considerably, even within the same industry or state. For instance, activity at hotels servicing capital cities and fly-in/fly-out air services has been strong, while hotel bookings and flight reservations to resort areas – even within the same states – have softened considerably. There has also been large variation in the pace of output growth within different parts of the manufacturing and construction industries, partly depending on whether their products and activities are used by the mining industry. This intra-industry variability could be one reason why the structural change index noted earlier suggested that to date the overall pace of change of the real output shares and employment between industries has not changed significantly from that prevailing since the mid 1990s. Nonetheless, to the extent the real exchange rate appreciation reflects a highly persistent change in fundamentals, the changes in the structure of domestic demand and industry output are likely to grow over time.
4.4 Effects of the Mining Boom on the States
Resources are spread unevenly across the country, with Western Australia, Queensland and the Northern Territory having the highest concentration of known reserves (Table 8). Almost all iron ore mining occurs in Western Australia, while two-thirds of black coal mining is in Queensland (the remaining one-third is in New South Wales). In the case of natural gas, the bulk of current production is from Western Australia, although Queensland is likely to also become a major supplier of CSG-LNG in coming years. The varying concentrations of resource deposits are reflected in the structure of the state economies, with Western Australia and Queensland accounting for about one-half and one-quarter, respectively, of the mining industry's revenue, employment and engineering investment (Figure 21).
| State/Territory | Share of mining in state output Per cent | Main resource deposits |
|---|---|---|
| Western Australia | 27 |
Iron ore, bauxite, nickel, gold, silver, copper, lead, zinc, diamonds, mineral sands, oil and natural gas |
| Northern Territory | 21 |
Bauxite, gold, silver, lead, uranium, zinc and natural gas |
| Queensland | 10 |
Black coal, bauxite, gold, silver, copper, nickel, lead, zinc and coal seam gas |
| South Australia | 4 | Uranium, gold, silver, copper and iron ore |
| New South Wales | 3 | Black coal, gold, silver, copper, lead, mineral sands and zinc |
| Victoria | 2 | Brown coal, gold, mineral sands, oil and natural gas |
| Tasmania | 2 | Gold, silver, lead, tin and zinc |
|
Sources: ABARES; ABS; Geoscience Australia |
||

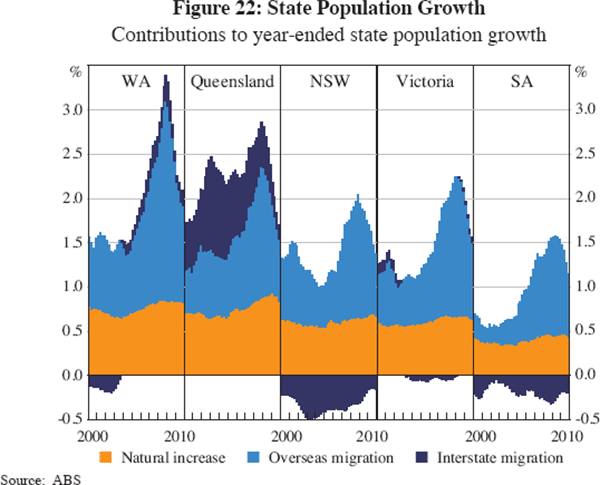
In addition to the rapid rise in investment in the resource-rich states, the structural change index noted earlier suggests there has been an increase in state variation in other economic indicators. As well as solid output growth, the resource-rich states have had the highest population growth. In part this reflected a high level of overseas migration to these states – especially in the case of Western Australia – and also interstate movements in Queensland, although in the case of Queensland this trend predates the mining boom (Figure 22). For both of these states, the population growth from these sources has slowed significantly in the past year or so.
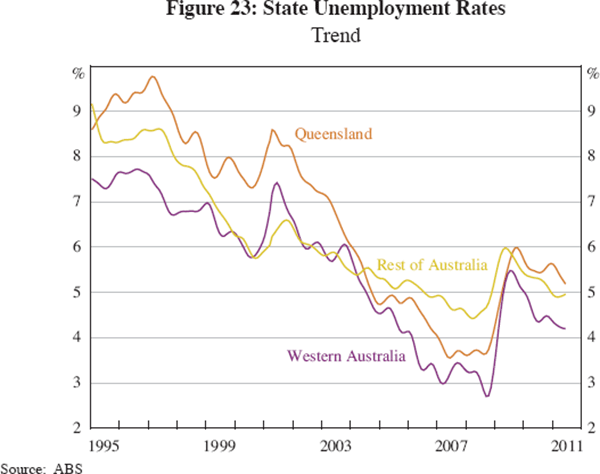
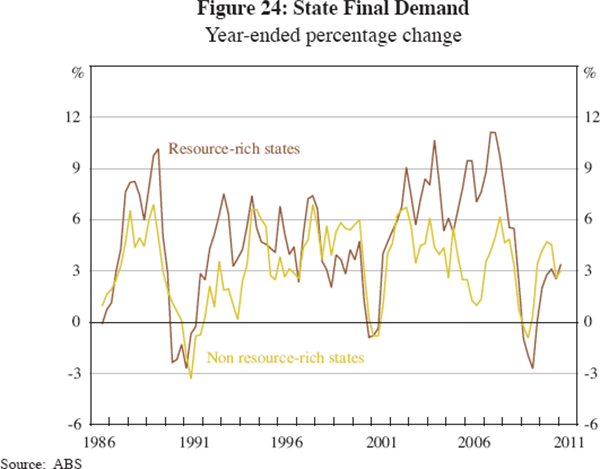
While the growth of mining industry output, population and investment varies between states, over recent years growth in overall demand and output across the states has become more similar. While the level of mining operations and investment is clearly concentrated in the resource-rich states, the distribution of the mining receipts is more dispersed across the country. The particular channels, as noted earlier, include the purchase of intermediate inputs from other parts of the country to service mining activities,[25] Australian equity holders are widely dispersed, and tax payments to the Australian Government are spent across the country.[26] This could be one reason why unemployment rates have been low in all states since the onset of the mining boom, although lowest in Western Australia and, until recently, in Queensland (Figure 23). Indeed, while final demand in the resource-rich states expanded rapidly between 2003 and 2007, rising at an average annual rate of around 8 per cent, since that time final demand in the resource-rich states has slowed significantly and broadly tracked the pace of growth seen in the rest of the economy, though this partly reflects state-specific reasons as well (Figure 24).
Footnotes
For details and model extensions that cover a variety of special cases, see Gregory (1976), Corden (1982, 1984), Corden and Neary (1982) and Cook and Sieper (1984). See also the discussion in Henry (2008), McKissack et al (2008) and Banks (2011). [13]
This description updates Connolly and Lewis (2010); for details on the structural change index, see also Productivity Commission (1998). [14]
This section covers only the direct labour used in mining operations. It excludes labour used in the production of intermediate products purchased by mining operations for their operations, and workers used by construction companies that are contracted to build mining projects; these components are discussed below. [15]
Nonetheless, mining employment growth was more significant on a state basis; of the 300,000 increase in employment in Western Australia over the decade, almost 50,000 were in the mining sector. [16]
More recent data suggest the import share for inputs used in mining operations in Western Australia was around 8 per cent in 2009 and 4 per cent in 2010; see Department of State Development and Department of Commerce (2011). [17]
Note that accommodation, cultural and personal services include some non-wage expenses provided to mining industry workers. Also, the input-output data show construction supplies only around 8 per cent of total mining inputs. However, this figure does not include the substantial amount of mining investment that takes place within the construction industry itself (see section below). [18]
The main exceptions are the Petroleum Resource Rent Tax (PRRT) and royalties collected in the Northern Territory, which are levied on measures of profits. The large increase in royalties in the late 1980s was associated with the introduction of the PRRT. In 2010 there was a national debate when the Government proposed replacing the existing system of mining royalties with a broad-based resource rent tax. The proposal was subsequently scaled back to only apply to iron ore and coal production, with the application of the PRRT broadened to include on-shore coal seam gas projects. [19]
This estimate reflects the costs of machinery and equipment, buildings and structures, exploration and software and R&D investment specifically related to mining on-site operations and support activities by contractors (including exploration). It does not include investment in infrastructure used to transport (e.g. rail, roads, pipes) and export (e.g. ports) mining products, or for the processing of minerals. These types of investments have also increased in recent years and are expected to continue to do so. [20]
For instance, magnetite iron ore projects require labour for on-site processing and assembly of processing and crushing modules as well as for the earth and civil works that are also used in the development of hematite mines. Machinery and equipment (car dumpers, stackers and reclaimers) are usually imported; rolling stock has traditionally been sourced domestically, but an increasing share is imported. As well as mine development, magnetite production requires a magnetite concentrator for processing the ore and key infrastructure to facilitate the production process, such as water and energy utilities. For coal investments, local content shares vary depending in part on whether new mines are underground or open-cut (with the latter having a larger local labour content). [21]
However, as noted, the variation around these industry-average spending estimates is considerable; for instance, Department of State Development and Department of Commerce (2011) estimates that around 85 per cent of the work undertaken in 2010 on the iron ore expansions of Rio Tinto and BHP Billiton in Western Australia was contracted locally compared with around 40 per cent for the Gorgon LNG project in 2010. The WA Government also estimates the share of locally contracted investment spending for companies operating under state agreements at 65 per cent in 2009 and 69 per cent in 2010. [22]
See also Stevens (2010a, 2011) for discussion of the macroeconomic effects of the current mining boom. [23]
Exports of education continued to grow, before slowing more recently, partly in response to changes in visa policies. [24]
Data for Western Australia suggest around 10 per cent of the value of the contracts awarded within Australia for mining operation and mining investment projects located in Western Australia were to companies based outside of that state; see Department of State Development and Department of Commerce (2011). [25]
For further discussion on state economic disparities and regional transfers, see Stevens (2010b). [26]
