RDP 2013-15: Trends in the Funding and Lending Behaviour of Australian Banks 3. Lending Behaviour
December 2013 – ISSN 1320-7229 (Print), ISSN 1448-5109 (Online)
- Download the Paper 1.07MB
The mortgage markets of most advanced economies can be characterised by the existence of a small number of key products. Lea (2010) finds that the use of long-term fixed-rate loans is most prevalent in the United States and Denmark, although the prepayment features offered on loans in each of these two countries differ substantially. Medium-term fixed-rate loans, often with rollover options and prepayment penalties, are more common in Canada, Germany and Switzerland.
Australia is one of a number of countries with a mortgage market dominated by variable rates. Variable-rate loans featuring an interest rate ‘cap’ are common in Canada, while ‘tracker’ loans – where the variable rate is set as a spread to an independent benchmark rate – have been popular with borrowers in Ireland, Spain and the United Kingdom. In contrast, Australian variable mortgage rates are set at the lender's discretion and repayment features are flexible compared with other variable-rate mortgage products.
The typical housing loan in Australia is a prime, full-documentation loan with a 25 to 30 year contractual maturity. Historically, fixed-rate loans have tended to account for less than one-fifth of new housing loans, and typically have a fixed-rate period of less than five years. For businesses, variable interest-rate loans – whether they reference the cash rate or some other benchmark such as the bank bill swap rate – also account for a majority (over 70 per cent) of business lending.
Between 1998 and the onset of the financial crisis, variable interest rates tended to move in line with changes in the cash rate. As Debelle (2004) points out, the Australian experience was not unusual; variable housing indicator rates often moved one-for-one with changes in policy rates in other countries where variable-rate mortgages were prevalent. Since the onset of the financial crisis, there has been a marked increase in the spread between lending and policy rates, in Australia and elsewhere, largely reflecting an increase in funding costs relative to the policy rate.
3.1 Historical Drivers
The popularity of variable-rate mortgages set at the lender's discretion in Australia reflects a number of historical developments. From a borrower's perspective, variable-rate mortgages are attractive because they offer greater flexibility in making prepayments than fixed-rate loans (Ellis 2006; Lea 2010). This is a particularly appealing feature for many owner-occupier borrowers because interest payments on owner-occupied mortgages are not tax deductible in Australia as they are in a number of other countries (Ellis 2006, 2010; Daniel 2008). Consequently, when interest rates decline, households may take the opportunity to make additional prepayments on their variable-rate loan (Debelle 2004).[16]
Lenders may view the prepayment flexibility of variable-rate loans favourably because the ability to prepay enables households to build up a repayment buffer for more difficult times, potentially reducing arrears rates. Australian lenders have often competed for new loans by expanding the prepayment options available to borrowers, such as offering offset accounts and redraw facilities. Furthermore, as most loans are funded from a variety of sources, the ability to adjust variable lending rates at their discretion can assist lenders in maintaining their profitability in the short term by passing on changes in funding costs to borrowers as they occur.
In the early to mid 1990s, a marked increase in competitive pressures, alongside a reduction in risk premia, drove the spread between household mortgage indicator rates and the cash rate down by around 250 basis points (Broadbent 2008). Similar forces also influenced business lending rates over this period. The strong correlation between the advertised indicator lending rates and the cash rate between the late 1990s and 2007 reflects the fact that the cash rate was the key driver of changes in domestic funding costs over this period, and debt funding costs largely tracked movements in the cash rate (Robertson and Rush 2013).
Despite the relative stability of the spread between indicator rates and the cash rate, the spread between actual variable rates paid and the cash rate slowly declined over the decade before the start of the global financial crisis. Small business borrowers experienced a marked decline in spreads as a result of a shift towards greater collateralisation of loans, predominantly secured against residential property, and an increase in competition (RBA 2011).
The spread between actual borrowing rates paid by households and the cash rate fell because mortgage discounts became more widespread. Initially, these discounts were offered to high-value customers – typically low-risk customers with high and stable incomes and large loans. The discount reflected their lower risk of default and greater long-term potential profitability to the bank. Over time, lenders have increasingly tried to differentiate between the relative riskiness and potential profitability of different borrowers. This has included, for example, competing for new borrowers with discounts based on both loan size and the loan-to-valuation ratio (LVR) (Table 2).[17] From the lender's perspective it is advantageous to compete for new borrowers with discounts because it allows the lender to offer attractive terms to potential new borrowers, without affecting the profitability of outstanding lending. As a result, the effective spread to the cash rate paid by borrowers has declined over the past twenty years.
|
LVR (%) |
Loan size | |||
|---|---|---|---|---|
| $250,000 | $500,000 | $750,000 | $1,000,000 | |
| 90–100 | 63 | 75 | 83 | 92 |
| 80–90 | 64 | 74 | 87 | 89 |
| 70–80 | 64 | 73 | 85 | 91 |
| 60–70 | 65 | 74 | 88 | 91 |
| 50–60 | 66 | 76 | 88 | 95 |
|
Note: Spread to the major banks' advertised standard variable indicator rate Sources: Perpetual; authors' calculations |
||||
3.2 Recent Influences and Implications
3.2.1 Role of the cash rate
Since the onset of the financial crisis, the spread between indicator lending rates and the cash rate has increased across all loan types (Figure 9; Robertson and Rush 2013). This has predominantly reflected an increase in funding costs – particularly the higher costs of deposits and long-term wholesale debt – although increases in risk premia for individual borrowers (see Section 3.2.2), and the increase in liquid assets as a share of banks' balance sheets, have also contributed.

Notes:
Spreads on outstanding loans
(a) Loans greater than $2 million; includes bill lending
Sources: ABS; APRA; Perpetual; RBA; UBS AG, Australia Branch
Despite this, indicator lending rates remain strongly anchored to changes in the cash rate (Figure 10). This has meant that changes in the cash rate are transmitted quickly, and broadly uniformly, to indebted households. The RBA Board has noted that it takes developments in funding costs into account when it determines the appropriate setting of the cash rate and can respond as needed over time (Lowe 2012). This ensures that the structure of interest rates faced by households and businesses is consistent with the desired stance of monetary policy.

Note: Size of dots represents the frequency with which a change occurred
Sources: RBA; authors' calculations
3.2.2 Pricing of risk
In setting lending rates, banks incorporate a risk premium designed to cover the credit risks associated with different types of loans. For example, Matić, Gorajek and Stewart (2012) attribute the pricing differential between small business loans secured with residential property and housing mortgages to the higher expected losses on small business loans and their higher capital requirements (Figure 11). Fabbro and Hack (2011) find that only a small portion of the increase in lending rates since the financial crisis can be attributed to a reassessment of risk, with most of the increase reflecting the increase in funding costs. However, there is evidence to suggest that banks are paying more attention to the pricing of risk.

Sources: ABS; APRA; Perpetual; RBA
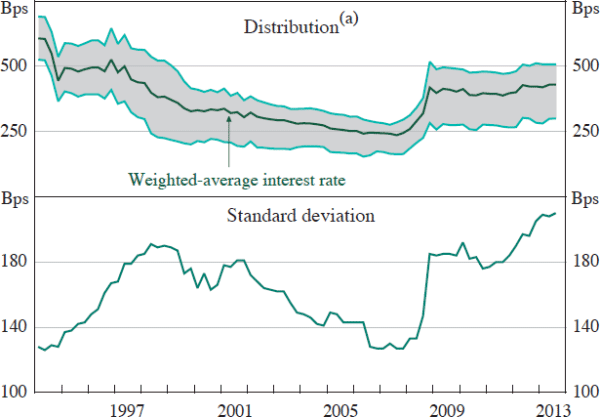
In particular, there has been a noticeable increase in the range of spreads charged for business loans. The standard deviation of spreads across lenders' business loan portfolios has increased to a level similar to that of the late 1990s (Figure 12). This trend is similar across both small and large business lending. The increase in the range of spreads is likely to reflect an increase in the sensitivity of banks to the perceived risks involved in different types of business lending. To a lesser extent, this increased range may also reflect cyclical factors, as banks tend to take a more conservative approach to lending when business conditions are less favourable. A number of banks have reduced their lending to the business sector since the onset of the financial crisis (RBA 2011). This has been associated with a reduction in competition for potentially higher-risk business loans over recent years.

Note: (a) The shaded range covers 50 per cent of the value of lending
Sources: APRA; Perpetual; RBA; authors' calculations
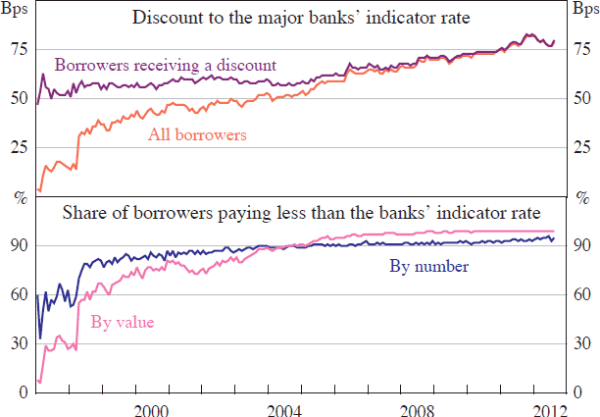
In line with the renewed focus on the pricing of risk, lenders appear to have begun to be more targeted with their offers of discounts on new loans. Consequently, while there has been little change to the size of the average discount offered to new household borrowers over recent years, the nature of discounts has continued to evolve (Figure 13). In particular, a number of lenders have started to place more emphasis in their advertising on products that offer larger discounts to borrowers with more equity (lower LVRs) in their property at origination. This is because these borrowers tend to have lower arrears rates and, if the arrears progress to default, smaller losses for the bank. In addition, there have been some attempts by lenders to link loan discounts to the age of the loan, usually through the use of loyalty discounts that become effective after a number of years. These discounts encourage price-sensitive borrowers to remain with their existing lender, and discourage mortgage churn, which can be costly for lenders.

Notes: Based on securitised prime full-doc loans; spread to advertised standard variable rate
Sources: Perpetual; authors' calculations
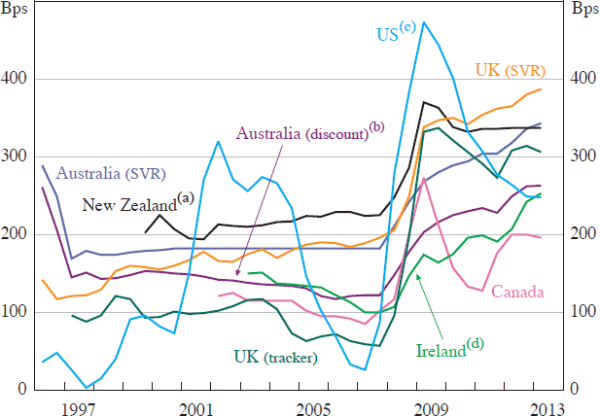
Despite these changes in the pricing of risk, the available evidence suggests that spreads to policy rates on Australian variable-rate mortgages remain consistent with those in many other advanced countries, notwithstanding the difficulties associated with international comparisons (Figure 14).[18] Lea (2010) reports similar results using benchmark rates as the reference rate.

Notes:
SVR denotes standard variable rate
(a) First mortgage interest rate on housing loans to first time customers
(b) Package loans only
(c) 1-year adjustable rate mortgages
(d) Floating rates and fixed rates of up to 1-year maturity
Sources: APRA; Bank of Canada; Bank of England; Board of Governors of the Federal Reserve System; Central Bank of Ireland; Federal Home Loan Mortgage Corporation; ING Canada; Perpetual; RBA; Reserve Bank of New Zealand
Changes in the pricing of risk can lead to a shift in preferences by both borrowers and lenders for different mortgage products over time. For example, Lea (2010) notes that the fall in short-term rates over recent years has led Danish borrowers to shift towards medium-term rollover fixed-rate mortgages. In contrast, Krainer (2010) observes that borrowers in the United States increased their preference for fixed-rate mortgages during 2009, largely in response to their more attractive pricing relative to variable-rate mortgages. Goggin et al (2012) note that there has been a marked shift away from banks offering tracker loans towards variable-rate loans set at the lender's discretion in Ireland since the financial crisis. This shift may have been a response by lenders to margins on these loans that appeared to be too narrow to accommodate the increase in funding costs, with a fall in demand from borrowers as a result.
For Australia, however, there has been little apparent change in borrower and lender preferences for mortgage products to date. Fixed-rate approvals have increased somewhat, but the rate of approvals is not unusually high by historical standards, and fixed-rate loans remain a relatively small share of outstanding lending. In addition, lenders do not appear to have adjusted their spreads on fixed-rate mortgages to make them more attractive to borrowers than variable-rate mortgages. Nevertheless, a number of lenders appear to have revised their minimum serviceability criteria, including interest rate buffers, for assessing new loan applications. The share of low-doc loans approved has also declined markedly, partly as a result of legislative changes, including the introduction of the National Consumer Credit Protection Act 2009.
3.2.3 Liquidity and maturity transformation
Lending rates also need to compensate the bank for the liquidity risk associated with assets that have longer maturities than the liabilities that fund them. An under-appreciation of the need to price for liquidity risk was identified as a serious problem following the global financial crisis (Grant 2011). Consequently, banks have begun to place more weight on liquidity considerations in their interest rate setting decisions. This is being encouraged by regulators globally given that few banks had sophisticated models or liquidity transfer pricing mechanisms to automatically undertake this exercise before the financial crisis.
The pricing for liquidity risk should depend on effective, rather than contractual, maturities. For example, a typical 30-year variable-rate housing loan generally has an effective maturity of around 5½ years as this is when, on average, a loan is repaid by borrowers.[19] In contrast, business loans typically have much shorter effective maturities of around 3½ years, depending on the type of borrower. Consequently, the provision of a business loan involves less liquidity risk for the bank than a housing loan, and therefore the premium above funding costs to compensate for this risk should also be lower.[20] Nevertheless, for both business and housing loans, the relatively short effective maturities suggest that the degree of maturity transformation provided, and therefore liquidity risk borne, by banks is not as large as their contractual maturities may suggest.
While a liquidity transfer pricing mechanism may result in different business units within a lending institution being charged different internal rates based on their provision or consumption of liquidity, this does not necessarily imply different lending rates for borrowers. In particular, how banks choose to respond to these pricing signals, the effectiveness of existing transfer pricing mechanisms and the potential reactions of their customers, will also influence the ultimate lending rates faced by borrowers.
Footnotes
This means that, while Australian households bear more interest rate risk on their mortgage debt compared to households in other countries where fixed-rate loans are more common, this risk is somewhat offset by the greater prepayment flexibility that exists in Australian housing loans. [16]
The use of discounts in Australia has been broadly similar to their use in the Canadian market, where borrowers with more equity have also tended to receive larger discounts (Allen, Clark and Houde 2011). [17]
Even comparisons of similar products are difficult due to the variation in the features on offer. The fact that many institutions offer customers discounts to their standard rates, and that these discounts are inherently difficult to track over time, further complicates any analysis. [18]
This often occurs as the result of refinancing by the borrower, or when a borrower sells their existing property, repays their current loan and takes out a new loan to finance the purchase of a new property. [19]
A simple liquidity transfer pricing mechanism attempts to match the effective maturity of assets with the effective maturity of funding liabilities. For example, the cost of liquidity risk on a 30-year (contractual maturity) variable-rate loan with an expected maturity of 5 years funded through at-call deposits can be achieved through a two-step process. First, the bank would assume that it funds the loan with a liability with the same effective maturity, such as a 5-year fixed-rate bond. Second, this hypothetical liability is transformed into an obligation with the same liquidity risk as the actual funding liability using interest rate swap transactions. The net cost of performing these two (hypothetical) steps is the liquidity cost that should be incorporated into the lending rate. [20]