RDP 2014-02: Fiscal Policy and the Inflation Target 5. The Effect of Fiscal Stimulus
March 2014 – ISSN 1320-7229 (Print), ISSN 1448-5109 (Online)
- Download the Paper 847KB
To consider the effect of fiscal stimulus, I run repeated stochastic simulations of FRB/US about its long-run steady state. I follow the approach discussed by Reifschneider and Williams (2000) with a few variations. Whereas Reifschneider and Williams use a linearised version of the model with model-based expectations, I use the nonlinear form with VAR expectations. Assuming VAR expectations will strike many readers as unusual for an analysis of policy rules. However, as I discuss in Section 7, the differences between VAR-based and model-based expectations do not seem to be large for this particular exercise. And there are both practical and conceptual reasons for preferring VAR expectations.
I use the 2010 vintage of the model, in which most equations, including VAR-based expectations, are estimated through 2009. I randomly draw residuals from 65 key model equations from the period 1968 through 2009, then simulate the model over 120 years, discard the first 20 years, store, and repeat 500 times.[8] I use a block bootstrap with block size of four quarters.[9] That means that serially correlated surprises, such as the financial crisis of 2008–2009, are represented in the simulations. To avoid double-counting the recent stimulus, the fiscal equations of the model are only estimated through 2007 and bootstrapped residuals for fiscal variables are set at zero after 2008:Q1. The aim of this approach is to generate 50,000 years of artificial data with the same conditional correlations (across variables and across time), covariances, skewness, and kurtosis as the last 40-odd years of US history. Unusual events, such as the financial crisis of 2008–2009 or the oil price increase of 1973, are effectively assumed to be once-in-40-year events. Alternatively, they can be considered to be representative of a larger class of less frequent events.
The simulations generate distributions of many key macroeconomic variables that are similar to those seen in recent US history. For example, the standard deviation of the unemployment rate is 1.3 percentage points in simulations with high inflation targets. This compares with an actual standard deviation of the gap between the unemployment rate and the model's effective NAIRU of 1.4 percentage points from 1968 through 2009. Because the simulations are conditional on inflation targets that differ from those implicitly used in the past, the volatility of nominal variables is harder to compare with the data. However, the frequency of zero bound episodes in my simulations (Table 2, row 1) is about the same as that of Coibion et al (2012, Figure 1), which, they argue, matches US experience. With respect to the distribution of variables conditional on a given starting point, Reifschneider and Tulip (2007, Table 9) show that FRB/US stochastic simulations are similar to real-time errors from major US macroeconomic forecasters.
| Inflation target | ||||
|---|---|---|---|---|
| 0 per cent | 1 per cent | 2 per cent | 4 per cent | |
| Panel A. Without stimulus | ||||
| 1. Proportion of time at zero bound | 0.25 | 0.14 | 0.08 | 0.03 |
| 2. Median length of zero bound episode (quarters) | 8 | 6 | 5 | 4 |
| 3. Standard deviation of unemployment rate (percentage points) | 1.71 | 1.51 | 1.38 | 1.28 |
| 4. Standard deviation of debt/GDP (percentage points) | 3.7 | 3.4 | 3.2 | 2.9 |
| Panel B. With recent stimulus | ||||
| 5. Proportion of time at zero bound | 0.20 | 0.11 | 0.06 | 0.02 |
| 6. Median length of zero bound episode (quarters) | 6 | 5 | 4 | 3 |
| 7. Standard deviation of unemployment rate (percentage points) | 1.39 | 1.29 | 1.26 | 1.23 |
| 8. Standard deviation of debt/GDP (percentage points) | 5.1 | 4.3 | 3.7 | 3.1 |
|
Source: author's calculations |
||||
Panel A of Table 2 shows key summary statistics for simulations with no unusual fiscal stimulus; that is, β in Equation (3) equals zero. As the inflation target approaches the lower bound, monetary policy is constrained more often. For example, as shown in row 1, interest rates are zero 8 per cent of the time with an inflation target of 2 per cent, rising to 14 per cent of the time if the target is 1 per cent. And, as shown in the second and third rows, the severity of these episodes, as measured by their duration or the standard deviation of unemployment, also increases at low inflation rates. As reported by Reifscheider and Williams (2000, Table 1), the volatility of other variables, such as the inflation rate or interest rates, is not greatly affected by the inflation target.
The simulations reported in Panel A of Table 2 are in line with previous research using FRB/US. The standard deviation of unemployment is higher than that reported by Reifschneider and Williams, but that is accounted for by the difference in sample period, which here includes the recent financial crisis. If this episode is excluded, the results are essentially the same, as discussed in Section 6.
Panel A assumes that fiscal policy behaves passively, in line with historical patterns and earlier research. In contrast, the lower panel shows the effect of countercyclical fiscal policy, that is with β = 0.7. I interpret this calibration as describing recent policy, and label it as such. As can be seen by comparing the upper and lower panels, countercyclical fiscal policy reduces the frequency and severity of zero bound episodes.
Figure 4 plots the standard deviation of the unemployment rate for different inflation targets. The lines labelled ‘no stimulus’ and ‘recent stimulus’ represent simulations with β equal to zero and 0.7 respectively. With active fiscal policy, the economy is more stable, especially at low inflation rates.
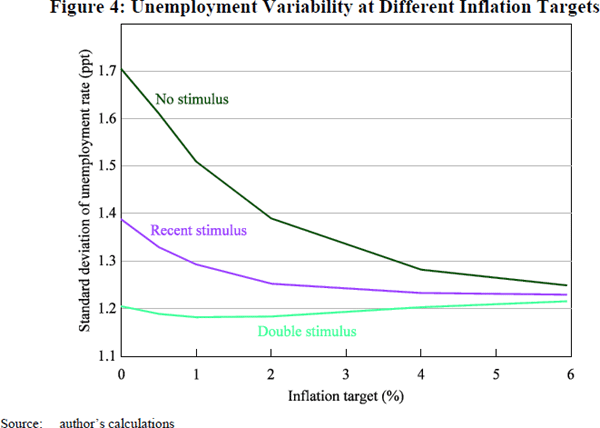
The difference between the lines labelled ‘no stimulus’ and ‘recent stimulus’ provides a measure of the benefits from countercyclical fiscal policy. If fiscal policy is passive, then an inflation target of 2 per cent is associated with a standard deviation of the unemployment rate of 1.39 percentage points. However, if fiscal policy behaves as it has recently, then the same variability of unemployment could be achieved with an inflation target of zero. Put another way, countercyclical fiscal policy is estimated to lower the standard deviation of the unemployment rate by 9 per cent at a 2 per cent inflation target or by 19 per cent at a zero inflation target.
As noted above, the personal tax rate equation in FRB/US adjusts taxes so as to stabilise the ratio of government debt to GDP around its assumed target, set at 55 per cent in the baseline. Active countercyclical fiscal policy does not change the average ratio of debt/GDP but it does increase its variability, as shown by comparing the last row in each panel of Table 2. It is not clear that a government that borrows in its own currency, such as the United States, should be especially concerned about these variations, and the model assumes they are costless. However, they may be a political constraint on active fiscal policy.
A third alternative, labelled ‘double stimulus’ in Figure 4, sets β = 1.4, twice the previous value. According to these estimates, this more aggressive fiscal policy almost eliminates economic variability arising from the zero bound. Such a policy may seem attractive; however, a discussion of optimal fiscal policy would also consider costs, and is beyond the scope of this paper. An interesting feature of the ‘double stimulus’ simulation is that unemployment is slightly more stable at low inflation (1 or 2 per cent) than at higher rates. Presumably this is because this particular fiscal rule – which only kicks in at low interest rates – is more stabilising than the baseline monetary policy rule.
From the perspective of monetary policy, it seems appropriate to take current fiscal policy as given. In that sense, a frontier such as the ‘recent stimulus’ line in Figure 4 can be considered as a possible menu from which central bankers might choose. This issue is explored in Section 6. From a broader perspective, society needs to choose between different combinations of fiscal policy and the associated inflation target. One option would be fiscal policy resembling that seen recently with a moderate inflation target; another option would be more aggressive fiscal policy with a lower inflation target.
The results in Figure 4 span a wide range of possible outcomes, which reduces the need for detailed sensitivity analysis. In qualitative terms, alternative modelling choices affect the results in fairly straightforward ways. For example, if fiscal policy multipliers were smaller than FRB/US estimates, or if the stimulus were smaller than my ‘recent stimulus’ simulations, those simulations would more closely resemble the ‘no stimulus’ experiment. Such an outcome would be likely if, for example, fiscal stimulus placed more weight on low-multiplier instruments, such as tax cuts, or if stimulus were expected to considerably outlast the zero bound, giving rise to offsetting increases in bond yields. Alternatively, if fiscal policy were more potent, timely, or aggressive than assumed in the ‘recent stimulus’ simulations, those results would move toward those depicted by the ‘double stimulus’ simulations. Such an outcome would be likely if the fiscal rule placed more weight on the 2001 and 2008 fiscal measures.
Perhaps a more important sensitivity is to the assumed volatility of economic shocks, addressed in the following section.
Footnotes
About 3 per cent of simulations of 120 years fail – that is, once every 4,000 years. Typically, this is because the model wanders off to an inadmissible region; for example, with a negative income or expenditure share. When this happens, I disregard the simulation. [8]
Whereas a basic bootstrap draws one quarter of observations at a time, the block bootstrap draws blocks of consecutive quarters, so as to capture unmodelled leads and lags. [9]