RDP 2015-15: Household Economic Inequality in Australia Appendix C: Income Inequality Estimates Using Tax Records
December 2015 – ISSN 1448-5109 (Online)
- Download the Paper 4.72MB
Income tax records provide an alternative way of measuring income inequality. These estimates are useful because tax records typically cover a broader population of individuals than household surveys (and hence better capture top income earners). There is also a long and consistent history of tax records, providing us with a sense of long-run trends. The main limitations of tax data relative to household surveys are that we generally cannot examine the underlying characteristics that are driving any changes over time and we can only measure inequality in individual incomes.
Estimates of individual income inequality based on tax records are very similar to those based on the SIH data (Figure C1). Since the early 1990s, relative to the tax records, the survey data has underestimated the share of income going to the top 10 per cent of earners by about 0.4 percentage points, on average. This suggests that the analysis based on the survey data is reasonably representative of the broader population of individuals covered by the tax data. Moreover, the consistency over time between the two series suggests that the survey data captures genuine trends in income inequality.[27]

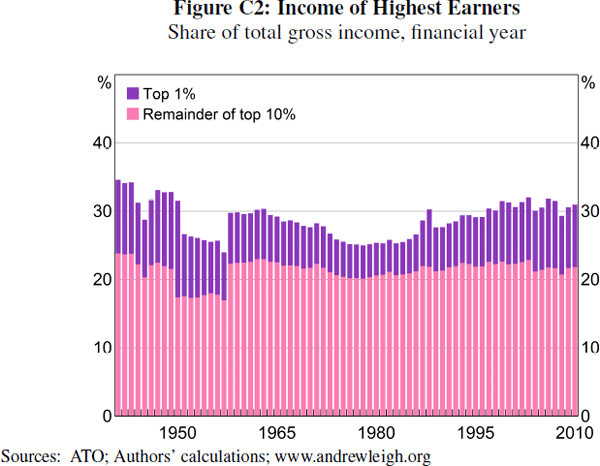
Using the Australian tax data, Leigh (2013) shows that the top shares in gross income follow a U-shape, decreasing from the early 1940s to the 1980s and then increasing after this period (Figure C2). To put this in an international context, cross-country comparisons can be made using the tax data collected by Atkinson and Morelli (2014). It is clear from Figure C3 that the U-shape pattern is common to several developed Anglo-Saxon countries, such as the United States, the United Kingdom, New Zealand and Canada (Atkinson and Morelli 2014). In contrast, the share of aggregate income accruing to the highest income earners has remained fairly steady since the 1950s in countries such as France, Germany and Japan (Piketty 2014).


Footnote
For a more complete discussion of the uses and limitations of tax and survey data, see Wilkins (2013). [27]