RDP 2016-12: The Household Cash Flow Channel of Monetary Policy 3. Data
December 2016
To identify the household cash flow channel, we need household-level information on consumption expenditure, cash flows, liquid assets and debt. We obtain this information from the Household, Income and Labour Dynamics in Australia (HILDA) Survey. This is a nationally representative household-based longitudinal study undertaken annually since 2001. The survey tracks individuals over time and provides detailed information on various household characteristics.
A relative advantage of the HILDA Survey compared to most other international household surveys is the availability of detailed longitudinal data on each of spending, income and wealth. Most household surveys require at least one of these items to be imputed or estimated. Saying that, the HILDA Survey data are only available at an annual frequency, which hinders our ability to identify the effect of monetary policy changes, which are likely to occur on a more regular (monthly) basis.
3.1 Household Consumption Expenditure
The HILDA Survey has been collecting detailed information on non-durable goods and services expenditure since at least 2006. For a shorter period of time (from 2006 to 2010), the survey also collected information on durable goods expenditure (e.g. cars, computers and audio visual equipment).[6] The classification of expenditures is shown in Table 1.
| Non-durables expenditure | Durables expenditure |
|---|---|
| Groceries | Motor vehicle purchases |
| Alcohol and tobacco | Computers and related services |
| Meals eaten out | Audio visual equipment |
| Public transport and taxis | Household appliances |
| Clothing and footwear | Furniture |
| Motor vehicle fuel and maintenance | Holiday travel |
| Home repairs, renovation and maintenance | |
| Healthcare fees and products | |
| Utilities | |
| Telecommunications | |
| Education fees | |
| Insurance | |
|
Source: HILDA Survey Release 14.0 |
|
The analysis in this paper focuses on durables expenditure. This is because the cash flow channel in Australia appears to mainly operate through expenditure on durable goods.[7] Expenditure on durables is typically more discretionary and sensitive to changes in interest rates than expenditure on non-durable goods and services. The period in which the durable spending data are available is relatively short in spanning five years. However, it covers the global financial crisis period and hence captures some important cyclical fluctuations in interest rates, income and spending.
In theory, the household cash flow channel links changes in real household spending to changes in nominal interest rates and cash flows. Ideally, we would have household-level information on real spending. However, this kind of information is very rare in household-level datasets. Like almost all micro data studies, we instead rely on nominal spending data to identify the cash flow channel.
This is unlikely to be a serious limitation for the analysis. The identification of the aggregate cash flow channel relies on differences in the MPC for borrowers and lenders. For the distinction between real and nominal spending to matter, the response of durable goods prices to interest rate changes needs to be very different for borrowers and lenders. Recent research has shown that there is significant heterogeneity in the inflation rates faced by different households (Kaplan and Schulhofer-Wohl 2016). However, these cross-sectional differences are largely constant over time and unresponsive to macroeconomic shocks, such as a change in monetary policy.[8]
3.2 Household Cash Flows
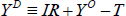
The HILDA Survey provides a measure of total disposable (or after-tax) income (YD). This is equal to: 1) interest receipts (i.e. the income flows from holdings of interest-earning assets, such as deposits, (IR)) plus 2) other types of income, such as wages, business income, pensions (YO) less 3) taxes (T):
To construct the preferred estimate of household ‘cash flows’ (YCF), required mortgage repayments (M) are deducted from after-tax income:

This measure of household cash flows is a measure of income after taxes and required mortgage repayments.[9] In the econometric analysis it will be helpful to separately identify the components of cash flows that are directly sensitive to interest rates. This will be referred to as ‘interest-sensitive cash flows’ (YICF). For borrowers, this relates to required mortgage repayments (M). For lenders, it relates to interest receipts (IR). The remainder of household cash flows will be referred to as ‘other cash flows’.
The preferred measure of household cash flows subtracts required mortgage repayments from after-tax income. This requires estimates of the mortgage repayments of each household in the HILDA Survey. Each year, the HILDA Survey collects data on the stock of mortgage debt and ‘usual’ mortgage repayments for each owner-occupier household. However, prior to 2014, there was no information on how much each household is required to pay each year. And it is the required repayments that presumably matter in measuring a household's sensitivity to interest rate changes via the cash flow channel.
We construct estimates of the required repayments separately for variable-rate and fixed-rate owner-occupier mortgage debt. The 2010 and 2014 HILDA Surveys provide information on whether the mortgage is fixed rate, variable rate or a combination of both types of loan product. We assume that the ‘combination’ loans are fixed-rate mortgages, as most fixed-rate mortgages in Australia have an initial ‘teaser’ period where the interest rate is fixed (usually for about one to three years) and then become variable rate after that (we obtain similar results if we instead assume the combination mortgages are all variable-rate loans).
In the absence of similar household-level information for earlier surveys, we assume that the loan type in 2010 applies to all the years prior to 2010 for which the household reportedly still had the same mortgage loan. This might be considered a strong assumption. However, there are monetary costs and, perhaps more importantly, time costs involved in switching mortgage products, particularly if switching between lending institutions. Moreover, the econometric analysis will control for household characteristics that might be expected to be correlated with the decision to switch loan products (e.g. age, income and level of housing wealth).
The required mortgage repayments are estimated annually using a credit-foncier model. A credit-foncier loan requires a constant annual repayment (M) over the life of the loan which is calculated as:
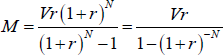
where V is the loan balance at origination, r is the (annual) nominal interest rate and N is the number of years remaining in the term of the loan. Every four years, indebted households provide estimates of both the loan size at origination and the year in which the loan was originated. For survey respondents that report having refinanced, the loan size and the year in which they last refinanced are also reported. Based on this information, we construct annual estimates of the loan balance at origination after adjusting for any refinancing. We assume a standard 30-year term for each mortgage.
The credit-foncier model also requires estimates of the interest rate faced by borrowers. This information is not collected in the HILDA Survey so, instead, the interest rate is assumed to be equal to the average advertised interest rate on mortgage loans. The variable-rate mortgage borrower is assumed to face the average advertised interest rate on new mortgages in the year of origination (or the year of refinancing). For other years, the borrower is assumed to face the average rate on outstanding loans. The fixed-rate mortgage borrower is assumed to face the average advertised interest rate on new fixed-rate debt in the year of origination. This interest rate continues to apply for the remainder of the loan unless the borrower reports that they have refinanced (in which case, the interest rate in the year of refinancing is applied).
Under the credit-foncier model, required repayments are a positive function of the nominal interest rate. For variable-rate mortgages, the estimated required nominal repayments should change as interest rates change. For fixed-rate mortgages, the estimated nominal repayments will instead remain fixed at the level at origination (or refinancing). As interest rates fall, this should lead to lower required repayments and higher cash flow for households with variable-rate debt relative to those with fixed-rate debt.
Consistent with this, there are differences in the interest rate and repayment cycles faced by variable-rate and fixed-rate mortgage borrowers. For instance, in 2009, the average lending rate on outstanding debt declined by nearly 3 percentage points for variable-rate mortgages but was basically unchanged for fixed-rate mortgages (top panel of Figure 2). Similarly, in 2009, the required repayments for the median variable-rate borrower are estimated to have declined by about 5.5 per cent of household disposable income, while the median fixed-rate borrower experienced a much smaller decrease of about 1 per cent of income (bottom panel of Figure 2).
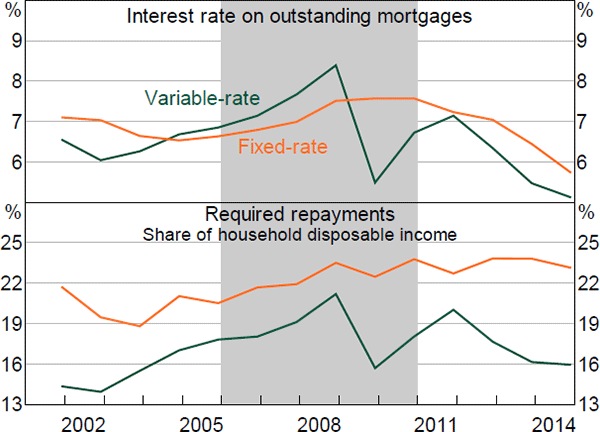
Notes: Required repayment estimates based on the credit-foncier model for the median indebted household using information on mortgage interest rates, current loan balance, loan balance at origination and age of the mortgage (adjusted for refinancing); household disposable income is equal to household gross income less taxes, estimates from the HILDA Survey; shaded areas show the estimation sample period from 2006 to 2010
Sources: Authors' calculations; HILDA Survey Release 14.0
However, there are institutional features of the Australian mortgage market which imply that the relationship between interest rates and borrower cash flows is not as straightforward as suggested by the theory. For instance, households with variable-rate mortgages have the opportunity to make larger repayments than required, allowing them to repay their loan ahead of schedule. This is known as ‘mortgage prepayment’. A partial mortgage prepayment occurs when a borrower repays some, but not all, of the mortgage ahead of schedule. Such prepayments can be made on a regular basis, or as a one-off excess repayment.[10] We will examine how mortgage prepayments can affect the sensitivity of the economy to the cash flow channel in an extension to the main econometric analysis.[11]
3.3 Household Net Interest-earning Liquid Assets
To identify the cash flow channel we also need household-level estimates of liquid assets and debt. The HILDA Survey provides detailed information on the wealth holdings of Australian households at four-year intervals (in 2002, 2006, 2010 and 2014).[12]
The decomposition of the average household balance sheet into interest-earning liquid assets and variable-rate debt is shown in Table 2. Estimates are shown for both the ‘mean’ and ‘median’ Australian household.
| Assets | |||
|---|---|---|---|
| Mean $'000 |
Median(a) $'000 |
Share of mean assets |
|
| Bank deposits | 51.0 | 11.0 | 5.6 |
| Cash investments (e.g. bonds) | 2.1 | 0.0 | 0.2 |
| Total interest-earning liquid assets | 53.1 | 12.0 | 5.8 |
| Housing assets | 530.0 | 393.8 | 58.0 |
| Superannuation | 185.7 | 65.0 | 20.3 |
| Other assets (e.g. equities, vehicles) | 145.6 | 25.5 | 15.9 |
| Total assets | 914.3 | 579.0 | 100.0 |
| Debt | |||
| Mean $'000 |
Median(a) $'000 |
Share of mean debt |
|
| Variable-rate housing debt | 114.1 | 0.0 | 65.8 |
| Variable-rate personal debt | 8.4 | 0.0 | 4.9 |
| Variable-rate business debt | 6.0 | 0.0 | 3.5 |
| Total variable-rate debt | 128.6 | 5.0 | 74.1 |
| Fixed-rate housing debt | 28.5 | 0.0 | 16.4 |
| Fixed-rate personal debt | 6.9 | 0.0 | 4.0 |
| Fixed-rate business debt | 3.2 | 0.0 | 1.9 |
| Credit cards | 1.7 | 0.0 | 1.0 |
| Other debt (e.g. student debt) | 4.6 | 0.0 | 2.7 |
| Total debt | 173.5 | 22.0 | 100.0 |
|
Notes: The HILDA Survey provides direct estimates of the share of housing debt at fixed and variable interest rates but the shares for personal debt and business debt are approximated using banking data, which indicate that around 55 per cent of personal lending and 65 per cent of small business lending is at variable interest rates (a) Median estimates do not sum to totals Sources: Authors' calculations; HILDA Survey Release 14.0; RBA |
|||
In this framework, the mean household holds $53,100 in interest-earning liquid assets (7.2 per cent of total net wealth). The mean household also has $128,600 in interest-sensitive debt (17.4 per cent of total net wealth), with most of this consisting of variable-rate home mortgage debt. In net terms, the mean household has a negative net interest-earning liquid asset position. However, Table 2 also makes clear that the distribution of net interest-earning liquid assets is skewed and a different picture emerges if focusing on the median household; they hold more interest-earning liquid assets than debt. In other words, the median household has a positive net interest-earning liquid asset position. The differences in the balance sheet positions of the median and mean households highlights the importance of looking at the full distribution of assets and debt in the economy.
3.4 Borrowing and Lending Households
To disentangle the separate cash flow channels, the estimated level of net interest-earning liquid assets is used to split households into borrowers and lenders. Borrowers are defined as households with negative net interest-earning liquid assets (i.e. households for which variable-rate debt exceeds interest-earning liquid assets). Conversely, lenders are households with more interest-earning liquid assets than variable-rate debt). These labels are a convenient way to distinguish the two cash flow effects that depend on the net interest-earning liquid asset positions of households. In doing so we recognise that, technically speaking, households should be defined as lenders (borrowers) if their incomes are greater (less) than their spending in a given period.[13]
The HILDA Survey indicates that the population is split fairly evenly between borrowers and lenders. More than two-thirds of households hold some form of debt, but many hold only small amounts of debt (usually in the form of credit cards) and hence are still defined as ‘lenders’. The HILDA Survey indicates that the share of borrowers in the economy was quite stable between 2002 and 2014, although there was a rise in the share of net borrowers between 2002 and 2006 (Figure 3). The increase in the share of net borrowers over this period was driven by an increase in the share of the population taking on (net) home mortgage debt.
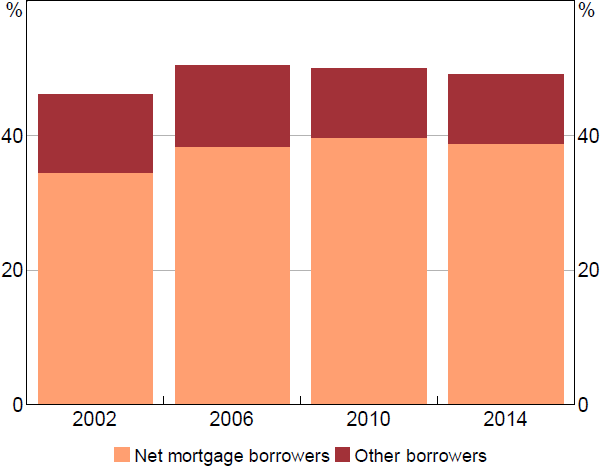
Notes: Net borrowers are households with negative net interest-earning liquid assets; net mortgage borrowers are households for which total home mortgage debt exceeds interest-earning liquid assets
Sources: Authors' calculations; HILDA Survey Release 14.0
While there are roughly the same number of borrowers and lenders in the economy, borrowers hold more net debt than lenders hold in net liquid assets, on average. In fact, the HILDA Survey suggests that, between 2002 and 2014, the average borrower held nearly three times as much net variable-rate debt as the average lender held in net interest-earning liquid assets (Figure 4). In real terms, the average borrower held about $230,000 in net variable-rate debt while the average lender held roughly $80,000 in net interest-earning liquid assets. This suggests that lower interest rates will boost interest-sensitive cash flows, on average.
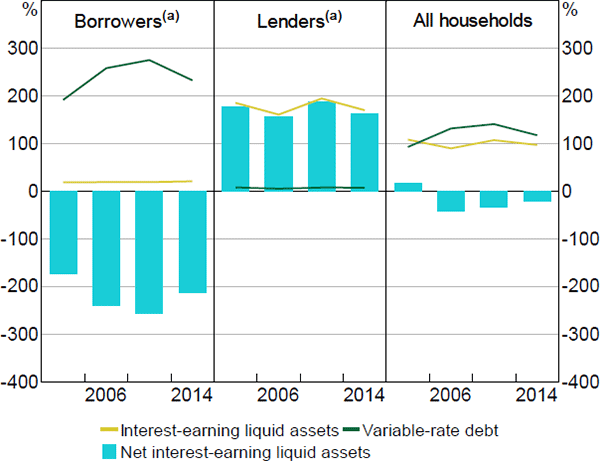
Notes:
Household disposable income is equal to household gross income less taxes, estimates
from the HILDA Survey
(a) Borrowers (lenders) are households with negative
(positive) net interest-earning liquid assets
Sources: Authors' calculations; HILDA Survey Release 14.0
A notable feature of the net liquid wealth distribution is its bi-model nature – borrowers hold high levels of debt and low levels of liquid assets, while lenders hold high levels of liquid assets and low levels of debt. This suggests that we can focus on gross asset and debt positions in quantifying the relative importance of the two channels.
Table 3 compares the average characteristics of net borrowers and lenders. Borrowers and lenders mainly differ because of their positions in the life cycle. The average borrower is younger, earns more income and is almost twice as likely to be in the workforce as the average lender. The average borrowing household is also typically larger, less wealthy and more educated than the average lending household, on average.
| Borrowers | Lenders | ||||||
|---|---|---|---|---|---|---|---|
| Mean | Median | Std dev | Mean | Median | Std dev | ||
| Durables consumption ($'000) | 11.2 | 5.2 | 25.8 | 7.4 | 2.5 | 14.8 | |
| Total consumption ($'000) | 45.6 | 39.1 | 34.5 | 33.5 | 26.9 | 26.6 | |
| Cash flows ($'000) | 89.0 | 77.0 | 67.1 | 68.5 | 49.8 | 94.4 | |
| Interest-earning liquid assets ($'000) | 17.6 | 5.5 | 37.9 | 68.7 | 17.3 | 192.8 | |
| Variable-rate debt ($'000) | 214.7 | 140.8 | 324.4 | 4.7 | 0.0 | 31.5 | |
| Net interest-earning liquid assets ($'000) | −197.1 | −123.8 | 314.6 | 64.1 | 15.0 | 185.6 | |
| Net total wealth ($'000) | 673.9 | 382.5 | 1,534.6 | 721.6 | 382.6 | 1,270.4 | |
| Age of household head (years) | 43.0 | 42.0 | 12.0 | 55.7 | 58.0 | 18.6 | |
| Household size (persons) | 3.0 | 3.0 | 1.4 | 2.2 | 2.0 | 1.2 | |
| Share that are home owners (%) | 75.9 | 57.8 | |||||
| Share that are mortgagors (%) | 66.3 | 4.5 | |||||
| Share that are employed | 81.3 | 45.2 | |||||
| Share that are tertiary educated (%) | 27.4 | 19.2 | |||||
| Observations | 15,066 | 15,806 | |||||
|
Notes: All variables in dollar amounts are deflated by the consumer price index and in 2014 dollars; all estimates are based on HILDA Survey wealth module years (i.e. 2002, 2006, 2010, 2014) Sources: ABS; Authors' calculations; HILDA Survey Release 14.0 |
|||||||
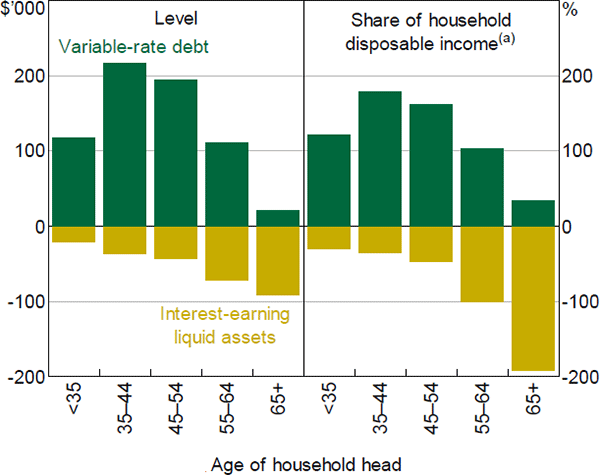
The influence of the life cycle for borrowers and lenders is also shown by the way in which the composition of wealth varies with the age of the household head (or ‘reference person’) (Figure 5).[14] Interest-earning liquid assets make up a greater share of net wealth for older households (aged 55 years and above), while middle-aged households hold higher levels of variable-rate debt.
In summary, the household-level evidence suggests that lower interest rates are likely to have a net positive effect on household cash flows (i.e. the borrower channel will be stronger than the lender channel). While there are roughly similar shares of lenders and borrowers in the population, average debt holdings exceed average liquid asset holdings. At least on the surface, this suggests that changes in interest rates will have a larger dollar effect on the cash flows of the average borrower than on the cash flows of the average lender. On top of this, we might expect that changes in cash flows will have a greater impact on spending of borrowers than lenders to the extent they are more likely to be liquidity constrained.
Note: (a) Household disposable income is equal to household gross income less taxes, estimates from the HILDA Survey
Sources: Authors' calculations; HILDA Survey Release 14.0
3.5 Hand-to-mouth Households
The strength of the aggregate cash flow channel relies on some households being liquidity constrained and hence very sensitive to changes in cash flows. We follow Kaplan et al (2014) in identifying liquidity-constrained or ‘hand-to-mouth’ households. They draw a distinction between liquid assets (such as cash and shares) and illiquid assets (such as housing and superannuation). They postulate that only liquid assets are used by households to smooth through small, transient changes in income.
Underlying Kaplan et al's (2014) empirical work is a two-period intertemporal consumption model in which households can choose to save in the form of liquid or illiquid assets. The latter provides a higher return but is only available at a transaction cost. Under certain parameters, some households will choose to save entirely through illiquid assets and optimally choose to consume at the kink in their budget constraint. These households have an MPC out of income that is equal to unity.
In practice, identifying these constrained households is challenging using annual (point-in-time) survey data. Like most household surveys, the HILDA Survey measures income as an annual flow but only measures the balance of liquid assets at the time of the interview. Even constrained households who spend all of their income each pay period are likely to spend it only gradually. Therefore, unless the interview date perfectly coincides with the end of the pay period, the balance of liquid wealth is likely to exceed zero and liquidity constraints will be measured with error. We follow Kaplan et al (2014) in assuming that households consume their liquid assets at a constant rate, and identify households as hand-to-mouth (HtM) if:
- their liquid wealth balance is positive, but less than half their income each pay period; or
- their liquid wealth balance is negative, and is less than the difference between half their income each pay period and a credit limit.
In effect, we identify HtM households as those households whose liquid wealth is low relative to their income (rather than the stricter requirement that liquid wealth is zero).
The allocation of households into HtM or non-HtM categories relies on detailed information on household wealth. We estimate that around 18 per cent of Australian households are HtM, with this share declining slightly between 2002 and 2014 (Figure 6). Notably, most of these households would be considered wealthy in that they own substantial (though illiquid) wealth, such as housing and superannuation.
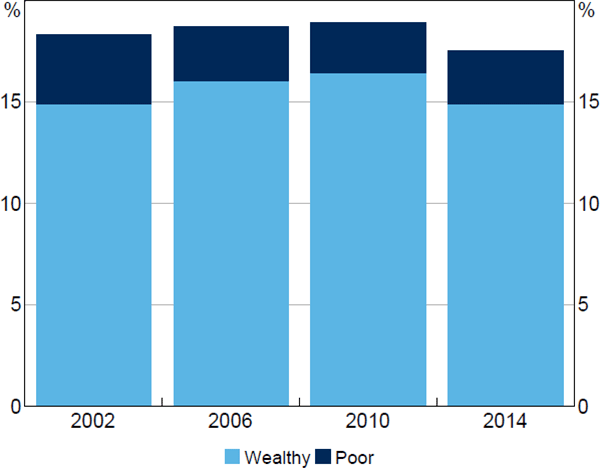
Note: Wealthy hand-to-mouth households are those that have positive illiquid wealth; poor hand-to-mouth households are those with negative illiquid wealth
Sources: Authors' calculations; HILDA Survey Release 14.0
Who are the HtM households? By our estimates, HtM households are typically younger and have lower incomes than other households, on average. Notably, our estimates are highly correlated with other potential measures of financial constraints in the HILDA Survey: HtM households are more likely than non-HtM households to report that they have experienced financial stress, that they do not save money and that they are more likely to have difficulty raising emergency funds.
Footnotes
These items could be described as ‘discretionary’ rather than durable, as some services, such as holiday expenditures, are included. However, these items make up a small share of overall expenditure in the HILDA Survey. [6]
Unreported estimates indicate that there is basically no correlation between interest-sensitive cash flows and expenditure on non-durable goods and services. [7]
Also, the available durables expenditure data in the HILDA Survey indicate that the consumption baskets of borrowers and lenders are very similar (the only notable differences are that borrowers spend slightly more of their budget on cars while lenders spend more on holiday travel). The inflation outcomes for borrowers and lenders are likely to be very similar given they purchase similar durable items on average. [8]
Ideally, the estimate of household cash flows would subtract all required debt repayments. The HILDA Survey only provides enough information to construct annual estimates of required payments for owner-occupier mortgage debt. This is unlikely to be a major issue though. Estimates from the Australian Bureau of Statistics' Household Expenditure Survey (HES) indicate that mortgage payments made up a very large fraction of total debt payments at around 86 per cent in 2009/10. [9]
Most prepayments of loan principal are paid by borrowers with variable-rate loans. There is generally a limit to how much Australian borrowers are able to prepay on fixed-rate mortgages before they incur some penalty. However, most fixed-rate loans are for one to three years, after which these loans are usually rolled over into variable-rate loans. [10]
For more information on household mortgage prepayment behaviour and other institutional features which may affect the cash flow channel of monetary policy, see Ellis (2005, 2006) and Thurner and Dwyer (2013). [11]
We can also look at the wealth distribution in Australia using the Survey of Income and Housing (SIH) produced by the Australian Bureau of Statistics. The SIH has provided information about the wealth distribution at roughly two-year intervals since 2003/04. We focus on the HILDA Survey estimates due to the longitudinal nature of the household-level data. [12]
Our measure of net interest-earning liquid assets is similar to the concept of ‘unhedged interest rate exposure’ (URE) used by Auclert (2016). The URE measures the net difference between all maturing assets and liabilities each period, including the difference between income and consumption (or current saving), whereas our measure excludes current saving. [13]
The head of each surveyed household is determined by applying certain criteria, in order, until a unique person is selected. These criteria are: in a registered marriage or defacto relationship (and still living together); a lone parent; the person with the highest income; the eldest person. [14]