RDP 2018-11: Consumer Credit Card Choice: Costs, Benefits and Behavioural Biases Appendix B: Estimation and Sensitivity Testing of Net Monetary Benefit
October 2018
- Download the Paper 1.7MB
B.1 Value of Rewards Points
Just over half of credit card holders accrue rewards points on their main card. For these consumers, I estimate the value of rewards points earned over the past year using the card's rewards points earn rate per dollar spent, multiplied by an estimate of the respondent's total annual spend on their main card, and scaled by a seasonal factor.[49] This yields the estimated value of any applicable rewards program over one year, and is equal to zero for respondents who do not have a rewards program on their main card.
I calculate the earn rate based on the two most common ways that respondents redeem their rewards points: gift cards and flights. According to the survey, gift cards are the most common way that consumers redeem their points, used by just over one-third of rewards card holders (Figure B1). A further one-fifth of rewards card holders redeem their points for flights. For other respondents, who report redeeming their rewards points for cash back or shopping or who had not redeemed their rewards points before, the value of their rewards points is estimated based on the earn rate for a gift card. The value of rewards points redeemed for flights varies with the market price of the flight; my estimate is based on advertised prices around the end of 2016.[50] To test whether this variation affects the overall distribution of monetary benefits, I recalculate my estimates based on all respondents redeeming their rewards points for a gift card; the results do not vary much, especially at the lower end of the distribution (Figure B2).
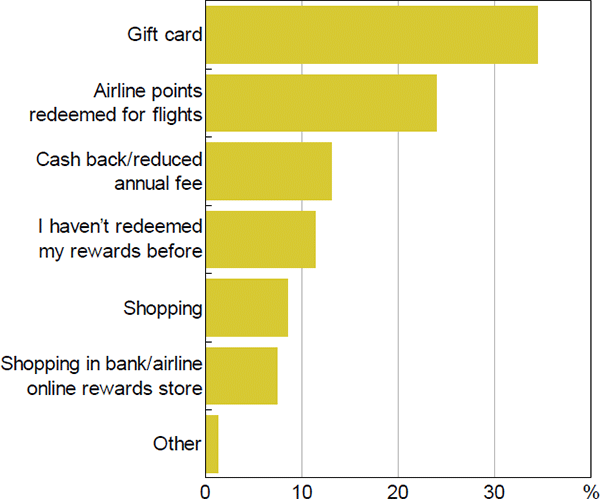
Source: Author's calculations, based on data from Ipsos and RBA
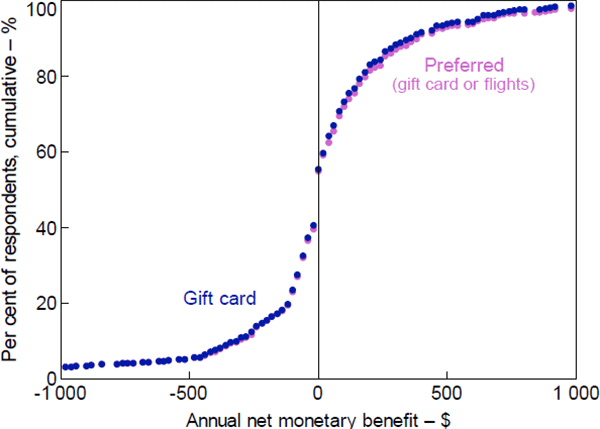
Source: Author's calculations, based on data from Ipsos and RBA
Two measures of annual credit card spending are available. One option is to use the transaction data from the 7-day diary component of the Consumer Payments Survey, by calculating the total value of transactions that respondents make on their main credit card, and scaling this weekly total up for an annual estimate. A second option is to use respondents' self-reported value of spending on their main credit card based on their latest monthly credit card statement.[51] The monthly spend figure yields an estimate with lower variance, but is missing data for 10 per cent of cardholders who selected ‘prefer not to answer’ to this question.[52] In my preferred measure, I use the monthly figure, but results do not vary meaningfully – especially for the group who make a loss from their card – when using the weekly estimate (Figure B3).
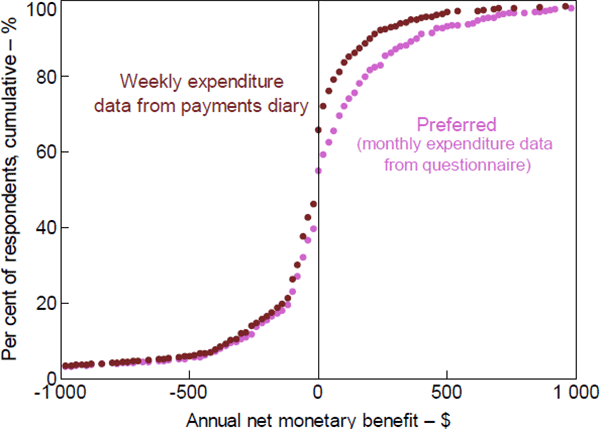
Source: Author's calculations, based on data from Ipsos and RBA
B.2 Annual Fee
The annual fee for each respondent's card is taken from a database of card features. This is combined with information from the Consumer Payments Survey on whether respondents had their most recent annual fee waived or discounted. If the respondent reported paying a discounted fee, I assume a discount of 50 per cent – this is based on the average advertised sign-up discount across a broad range of cards. If the respondent reported that their card does not have a fee, when the card features database suggests that it does, I assume the fee had been waived.
B.3 Value of Interest-free Period
The value of the interest free period is estimated as:
where the alternative interest rate is based on the respondent's answers to a question about whether and how they would borrow money if they did not own a credit card. I use the average mortgage and average personal loan interest rates in November 2016 (from the RBA's statistical table F5 Indicator Lending Rates) for respondents who say they would use their mortgage offset account or take out a personal loan, respectively. For the majority of respondents, who say they would not want to borrow money without a credit card, I use the average savings account interest rate (from RBA statistical table F4 Retail Deposit and Investment Rates). The results do not change substantially when I vary this assumption (Figure B4).
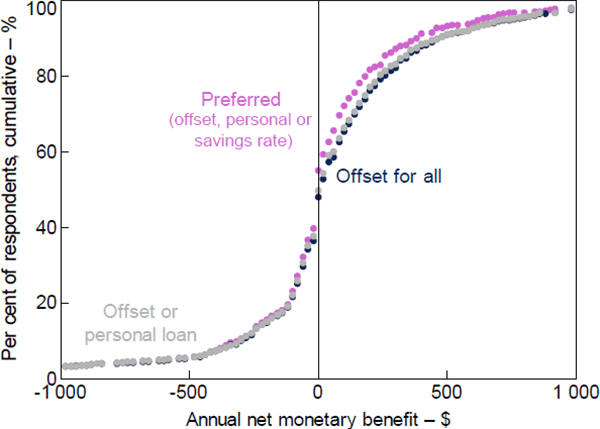
Source: Author's calculations, based on data from Ipsos and RBA
B.4 Interest Charges
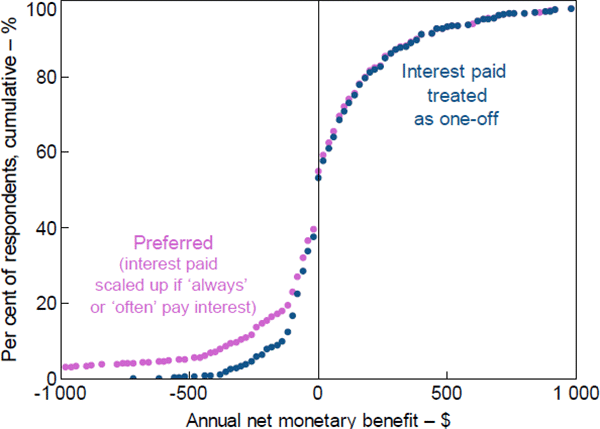
For respondents who had paid interest in the past year, I include an estimate of the annual value of those payments. I use information they provided on the amount of interest charges in their most recent monthly statement, scaled by their self-reported frequency of paying interest.[53] For consumers who say that they sometimes or always pay interest, I multiply their interest payments by 3 or 12 months, respectively. For those who say that they do not usually pay interest but did pay interest in their most recent monthly statement, I treat this as a one-off.
For those consumers who do regularly pay interest, this is generally the most important component of their total estimated net monetary benefit. To allow for the possibility of misreporting (for instance, some respondents may have reported their total balance outstanding rather than just the interest charges in the most recent month), I also estimate the net monetary benefit assuming that the most recent interest payments were a one-off for all respondents (Figure B5). This leads to a substantial decrease in the share of respondents making very large losses, but does not affect the share of respondents making a loss at all, which is the main metric presented in this paper.
Source: Author's calculations, based on data from Ipsos and RBA
Footnotes
I use the October 2016 seasonal factor from the aggregate consumer credit card payment series in the RBA's monthly retail payment statistics, generated using X-12 seasonal adjustment. [49]
The value of rewards points redeemed for flights is naturally variable, but I estimate it based on the sale fare value of rewards points redeemed on 13 common domestic and international routes. [50]
Respondents were asked ‘What is the total amount you spent on your main credit card in your most recent monthly statement?’. [51]
Note that it is the difference in estimated spending for respondents for whom both weekly and monthly expenditure measures are available that drives the differences shown in Figure B3 – not the addition of the approximately 80 respondents for whom monthly spending data was not provided. [52]
Respondents were asked ‘How much were you charged in credit card interest in your most recent monthly statement?’ to capture new interest charges, rather than existing interest balances. [53]
