RDP 2020-05: How Risky is Australian Household Debt? Appendix A: Regression Data
August 2020
- Download the Paper 1,881KB
| Variable | Source | Unit | Measurement |
|---|---|---|---|
| Household debt-to-income | ABS; Jordà et al (2013); Thomson Reuters; authors' calculations | ratio | Disposable income is measured after tax but before deduction of interest payments for most countries, includes non-profit sector; Australian DTI ratio extrapolated three years earlier than ABS data using the Jordà et al (2013) database |
| Time-varying | |||
| Real income per capita | OECD; World Bank; authors' calculations | US$ | Real disposable income per capita; in 2017 dollars, converted to US$ using year-average exchange rate |
| Real interest rate | Bloomberg; IMF; RBA; central banks | % | Calculated as 10-year nominal sovereign bond yield minus past year's CPI inflation |
| Inflation | IMF | % | CPI inflation over the prior year |
| Housing pricing growth | BIS; IMF; authors' calculations | % pa | Growth in BIS long-run housing price series, minus CPI inflation over a three-year period |
| Max price fall | BIS; authors' calculations | % | Absolute peak-to-trough fall in the BIS long-run housing price series over the prior period; weight on price outcomes is given full weight for the most recent five years, and then gradually declines according to the following formula: , if prices have not fallen during that time, the value is set to 0 |
| Urban population growth | United Nations | % pa | Two-year annualised rate of change in population for cities with at least 300,000 people in 2018 |
| Urbanisation | United Nations authors' calculations | % | Share of national population living in cities that had at least 300,000 people in 2018 |
| Housing stock per person | United Nations; authors' calculations; national agencies | ratio | Total dwellings divided by population |
| Younger population | United Nations; authors' calculations | % | Share of total population aged 25 years or less |
| Older population | United Nations; authors' calculations | % | Share of total population aged 65 years or older |
| Financial liberalisation | Abiad, Detragiache and Tressel (2008); authors' calculations | index | Based on seven metrics of deregulation (credit controls, interest rate controls, entry barriers, state ownership, capital account restrictions, prudential regulation and securities market policy); we update this to 2018 using various sources of information on these metrics |
| Income growth expectations | Consensus Economics | % | Forecasts for GDP growth in the year t + 1, made in March of year t |
| Unemployment rate | IMF | % | Unemployed persons as a per cent of the labour force |
| Baa-Aaa spread | Federal Reserve Bank of St. Louis | ppt | Difference between yield on Baa-rated bonds and equivalent tenor Aaa-rated bond |
| ‘Time-variant’ | |||
| Ownership of housing | authors' calculations; national agencies | % | Share of all housing owned by households; generally collected from financial accounts data, where that is unavailable then census data are used |
| Strength of legal rights | World Bank | index | Ranges from 0 to 12, with 12 being the strongest creditor rights |
| Urban density | Charting Transport | person/ha | Population-weighted density of main cities in each country, calculated using square km grids |
| Inequality | OECD | ratio | Gini coefficient |
| Interest tax deductible | Ellis (2005); authors' calculations | dummy | 1 = interest payments are tax deductible |
| Capital gains taxation | Ellis (2005); authors' calculations | dummy | 1 = capital gains on housing are taxed at full rate |
| Country | Sample starts | Country | Sample starts |
|---|---|---|---|
| Australia | 1985(c) | Japan(b) | 1980 |
| Austria(a) | 1999 | Netherlands | 1980 |
| Belgium(a) | 1999 | New Zealand | 1980 |
| Canada | 1980 | Norway(a) | 1987 |
| Chile(b) | 2003 | Portugal(a) | 1999 |
| Denmark | 1999 | South Korea(b) | 2008 |
| Finland(a) | 1999 | Spain(a) | 1980 |
| France(a) | 1980 | Sweden | 1980 |
| Germany | 1991 | Switzerland | 1999 |
| Ireland(a) | 2001 | United Kingdom | 1980 |
| Italy(a) | 1999 | United States | 1980 |
|
Notes: (a) Not included in narrow regression |
|||
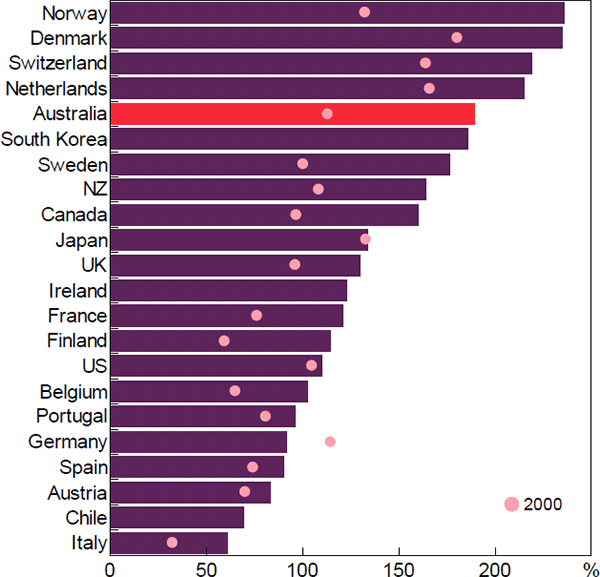
Figure A1: Household Debt-to-income Ratios
End 2018 or latest observation

Sources: European Central Bank; National agencies; OECD; RBA; Thomson Reuters