RDP 2023-09: Does Monetary Policy Affect Non-mining Business Investment in Australia? Evidence from BLADE Appendix B: Aggregate Data Results
December 2023
- Download the Paper 1.74MB

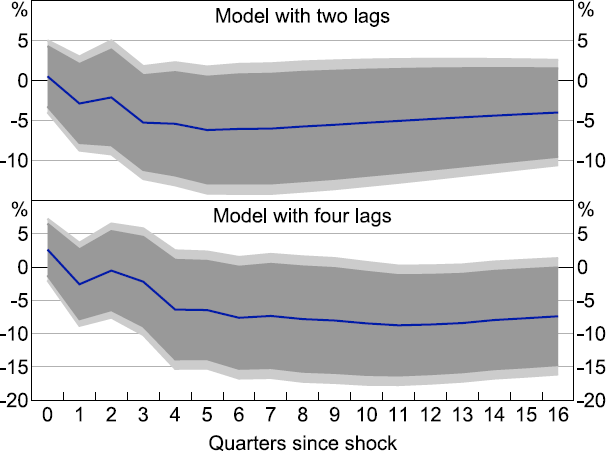
Notes: Small VAR with (log) real trade-weighted index, (log) consumption, (log) non-mining business investment, (log) dwelling investment and cash rate. Lighter shaded areas show 95 per cent confidence interval; darker show 90 per cent confidence interval.

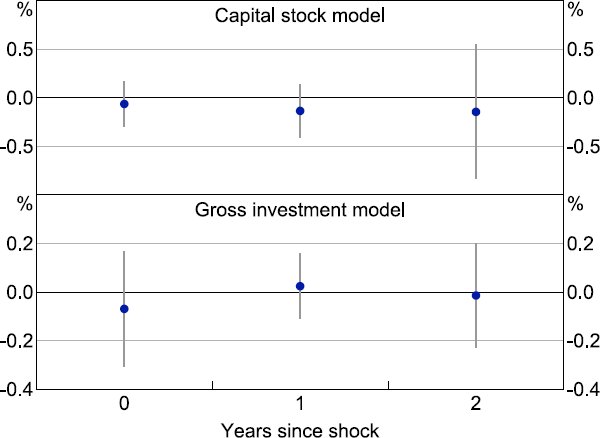
Notes: Model with no growth controls, but with industry*year fixed effects. Dots represent the point estimates of the differences in impulse responses. Bars represent 90 per cent confidence intervals calculated based on a t-distribution with t – n degrees of freedom, where t is number of years and n is the number of coefficients that do not vary across firms.
Sources: Authors' calculations; Morningstar.

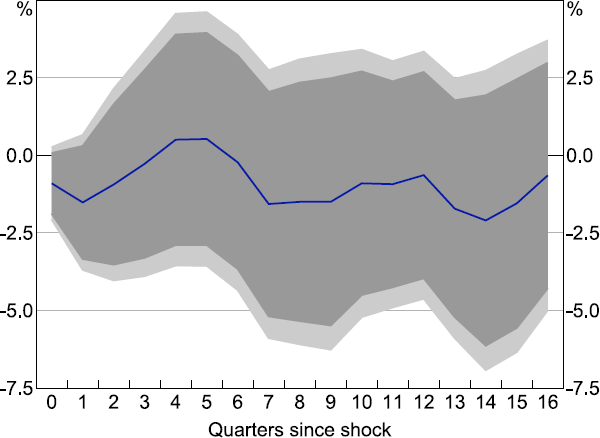
Note: Lighter shaded areas show 95 per cent confidence interval; darker show 90 per cent confidence interval.
Sources: ABS; Authors' calculations.