RDP 2024-04: Nowcasting Quarterly GDP Growth during the COVID-19 Crisis Using a Monthly Activity Indicator Appendix A: Additional Monthly Activity Indicator Details
July 2024
- Download the Paper 1.8MB
A.1 Additional MAI dataset details
| No | Series | Source | Category | Start date | End date | Transformation code |
|---|---|---|---|---|---|---|
| 1 | Total employment | ABS | Hard | 1978:M2 | 2022:M9 | LD |
| 2 | Full-time employment | ABS | Hard | 1978:M2 | 2022:M9 | LD |
| 3 | Part-time employment | ABS | Hard | 1978:M2 | 2022:M9 | LD |
| 4 | Unemployment rate | ABS | Hard | 1978:M2 | 2022:M9 | FD |
| 5 | Underemployment rate | ABS | Hard | 1978:M2 | 2022:M9 | FD |
| 6 | Hours worked | ABS | Hard | 1978:M2 | 2022:M9 | LD |
| 7 | Job advertisements | DoE | Soft | 2006: M1 | 2022:M9 | LD |
| 8 | ANZ Job vacancies | ANZ | Soft | 1999:M7 | 2022:M9 | LD |
| 9 | NAB Business conditions | NAB | Soft | 1997:M3 | 2022:M9 | LV |
| 10 | NAB Profitability | NAB | Soft | 1997:M3 | 2022:M9 | LV |
| 11 | NAB Trading conditions | NAB | Soft | 1997:M3 | 2022:M9 | LV |
| 12 | NAB Employment | NAB | Soft | 1997:M3 | 2022:M9 | LV |
| 13 | NAB Forward orders | NAB | Soft | 1997:M3 | 2022:M9 | LV |
| 14 | NAB Stocks | NAB | Soft | 1997:M3 | 2022:M9 | LV |
| 15 | NAB Business confidence | NAB | Soft | 1997:M3 | 2022:M9 | LV |
| 16 | NAB Capacity utilisation | NAB | Soft | 1997:M3 | 2022:M9 | LV |
| 17 | AiG Performance of manufacturing index | Ai Group | Soft | 2001:M5 | 2022:M9 | LV |
| 18 | AiG Performance of services index | Ai Group | Soft | 2005:M9 | 2022:M9 | LV |
| 19 | AiG Performance of construction index | Ai Group | Soft | 2003:M2 | 2022:M9 | LV |
| 20 | New company registration rate | ASIC | Soft | 1978:M2 | 2022:M9 | LV |
| 21 | ANZ-Roy Morgan Consumer financial situation next year | ANZ-Roy Morgan | Soft | 2008:M10 | 2022:M9 | LV |
| 22 | ANZ-Roy Morgan Consumer confidence index | ANZ-Roy Morgan | Soft | 2008:M10 | 2022:M9 | LV |
| 23 | WMI Consumer family finances next 12 months | WBC-MI | Soft | 1978:M2 | 2022:M9 | LV |
| 24 | WMI Consumer sentiment index | WBC-MI | Soft | 1978:M2 | 2022:M9 | LV |
| 25 | Retail trade | ABS | Hard | 1982:M4 | 2022:M8 | LD |
| 26 | Sales of new motor vehicles | VFACTS | Hard | 1978:M2 | 2022:M7 | LD |
| 27 | Revenue passengers, international, inbound | DoT | Hard | 1985:M1 | 2022:M7 | LD |
| 28 | Goods and services credits | ABS | Hard | 1978:M2 | 2022:M8 | LD |
| 29 | Goods and services debits | ABS | Hard | 1978:M2 | 2022:M8 | LD |
| 30 | Building approvals – residential, private | ABS | Hard | 1978:M2 | 2022:M8 | LD |
| 31 | Building approvals – housing, total | ABS | Hard | 1978:M2 | 2022:M8 | LD |
| 32 | Building approvals – other dwellings, total | ABS | Hard | 1978:M2 | 2022:M8 | LD |
| 33 | Building approvals – alterations and additions, total | ABS | Hard | 1978:M2 | 2022:M8 | LD |
| 34 | Building approvals – non-residential, total | ABS | Hard | 1978:M2 | 2022:M8 | LD |
| 35 | Auction clearance rate | CoreLogic | Soft | 2008:M5 | 2022:M9 | LV |
| 36 | Credit – total | RBA | Financial | 1978:M2 | 2022:M8 | LD |
| 37 | Credit – housing | RBA | Financial | 1978:M2 | 2022:M8 | LD |
| 38 | Credit – other personal | RBA | Financial | 1978:M2 | 2022:M8 | LD |
| 39 | Credit – business | RBA | Financial | 1978:M2 | 2022:M8 | LD |
| 40 | 3-month bank accepted bills/negotiable certificates of deposit | RBA | Financial | 1978:M2 | 2022:M9 | FD |
| 41 | Yields on Australian government bonds – 3-years maturity | RBA | Financial | 1992:M6 | 2022:M9 | FD |
| 42 | Yields on Australian government bonds – 5-years maturity | RBA | Financial | 1978:M2 | 2022:M9 | FD |
| 43 | Yields on Australian government bonds – 10-years maturity | RBA | Financial | 1978:M2 | 2022:M9 | FD |
| 44 | Yield spread, AGS 3-years less 3-month bank bill | RBA | Financial | 1992:M6 | 2022:M9 | LV |
| 45 | Yield spread, AGS 5-years less 3-month bank bill | RBA | Financial | 1978:M2 | 2022:M9 | LV |
| 46 | Yield spread, AGS 10-years less 3-month bank bill | RBA | Financial | 1978:M2 | 2022:M9 | LV |
| 47 | AUD trade-weighted index | RBA | Financial | 1978:M2 | 2022:M9 | LD |
| 48 | S&P/ASX 200 | Bloomberg | Financial | 1978:M2 | 2022:M9 | LD |
| 49 | Index of commodity prices | RBA | Financial | 1978:M2 | 2022:M9 | LD |
| 50 | Home value index | CoreLogic | Financial | 1980:M1 | 2022:M9 | LD |
| 51 | SWIFT customer-to-customer RTGS | RBA | Financial | 1998:M10 | 2022:M9 | LD |
| 52 | Credit card payments | RBA | Financial | 1985:M1 | 2022:M8 | LD |
| 53 | Debit card payments | RBA | Financial | 1994:M5 | 2022:M8 | LD |
| Notes: ‘ABS’ is Australian Bureau of Statistics, ‘DoE’ is the Department of Employment, ‘DoT’ is the Department of Transport, ‘WBC-MI’ is Westpac and Melbourne Institute. ‘Transformation code’ indicates the method used to transform the data to be stationary if necessary, ‘FD’ indicates first difference, ‘LD’ indicates log difference and ‘LV’ indicates level. | ||||||
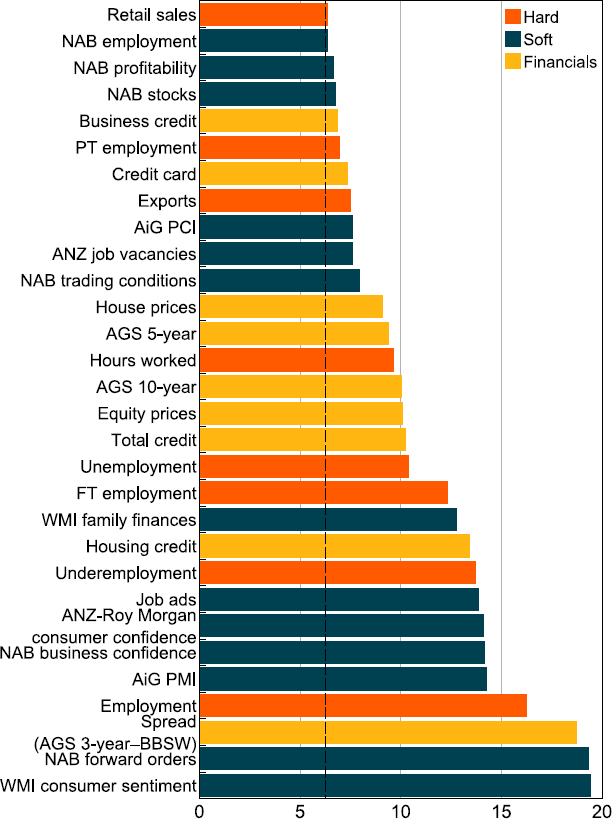
Note: Dashed line represents the critical value = 6.25.
Sources: ABS; Ai Group; ANZ; Authors' calculations; Bloomberg; CoreLogic; NAB; RBA; Westpac and Melbourne Institute.
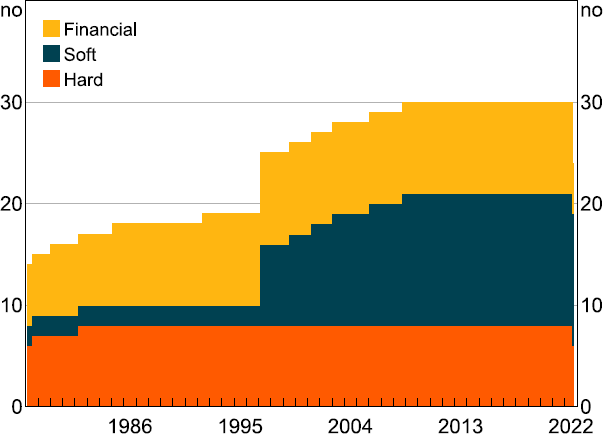
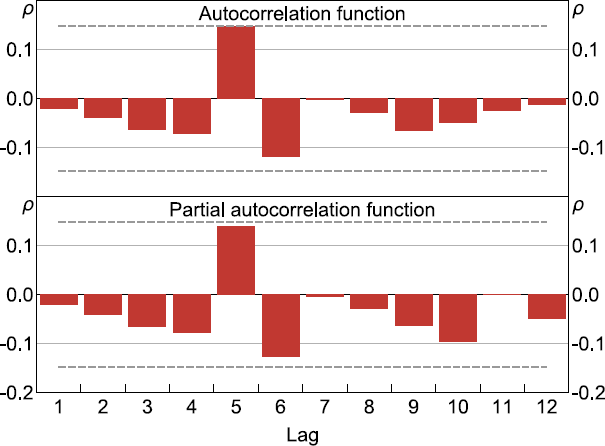
Notes: GDP is first release. Dashed lines represent 95 per cent confidence intervals.
A.2 Additional MAI estimation details
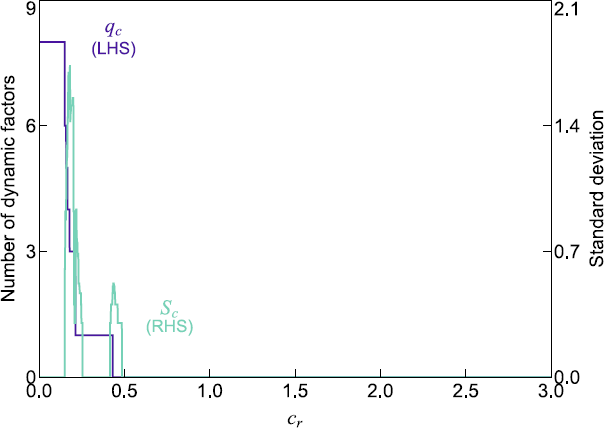
The number of dynamic factors is determined by looking for the second ‘region of stability’ in relation to Sc (i.e. a value of 0) and checking which value of qc this corresponds to. See Hallin and Liška (2007) for more details.
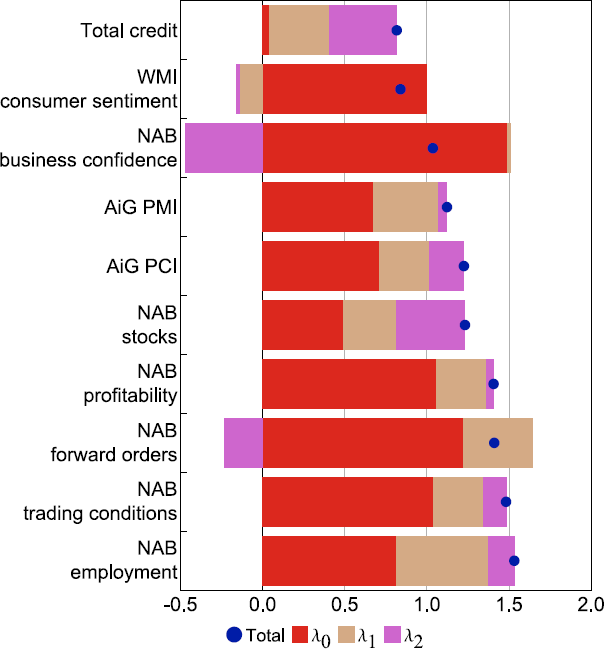
Sources: Ai Group; Authors' calculations; NAB; RBA; Westpac and Melbourne Institute.
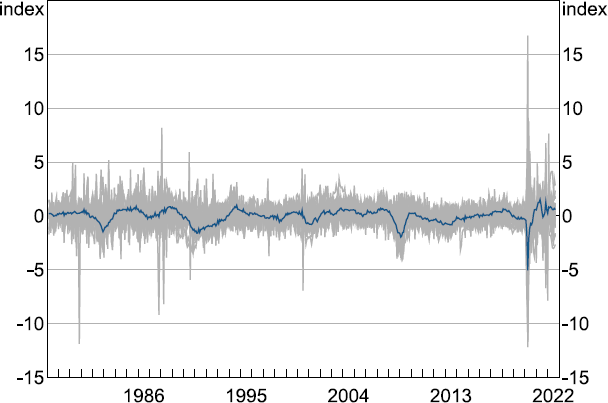
Note: Grey lines represent the underlying ‘targeted predictor’ dataset; blue line represents the MAI.