RDP 2024-08: Modelling Reserve Demand with Deposits and the Cost of Collateral 8. Discussion
November 2024
- Download the Paper 1.32MB
Holding deposits and the opportunity cost of collateral constant at their August 2024 level, I can plot the August 2024 reserve demand curve using Equation (10).
By Equation (10), banks' estimated demand is between $100 billion and $200 billion of excess reserves if private repo trades in line with the RBA's current OMO repo price (Figure 14). These estimates suggest banks should begin demanding additional funding from OMO repo when the level of reserves reaches between $100 billion and $200 billion in reserves. These estimates of reserve demand are significantly higher than the $3 billion in excess reserves required to implement monetary policy prior to the COVID-19 pandemic. Partly, what appears likely to be an increase in Australian banks' reserve demand reflects a decrease in the cost of borrowing under OMO repo – a run along banks' reserve demand curve. Though, a large part of the increase in reserve demand is the result of a shift in banks' demand curve explained by additional deposits.
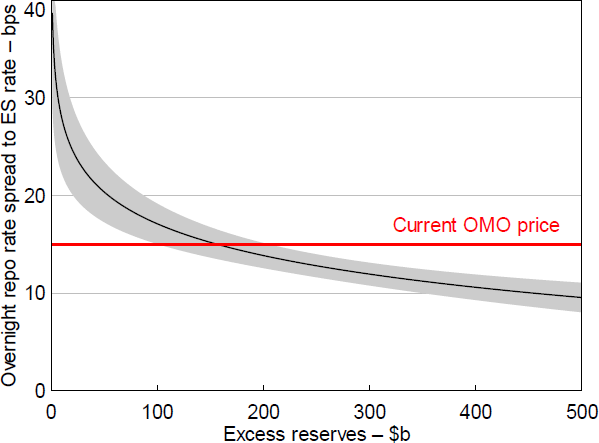
Note: Shaded area denotes 90 per cent confidence interval.
To demonstrate the shift in banks' reserve demand curve, I plot the August 2024 demand curve against the curve estimated using deposits and the cost of collateral as at November 2020. Figure 15 shows the shift in banks' demand up and to the right alongside more deposits.
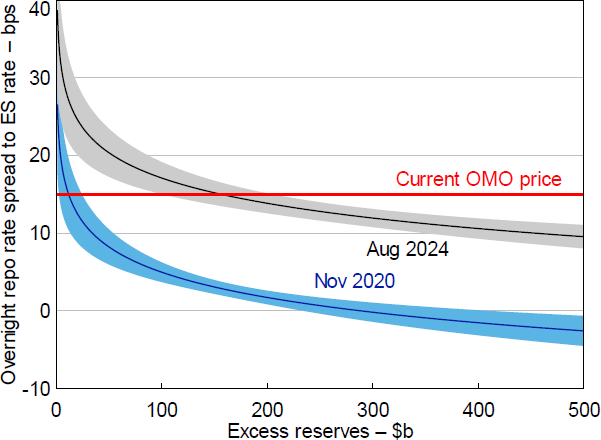
Note: Shaded areas denote 90 per cent confidence intervals.
Reserve demand estimates help inform when the RBA may transition from an excess reserves environment to its chosen system of ample reserves. To project the supply of reserves, one must consider the maturity profile of RBA bond holdings and other factors that influence reserves, such as changes in government and foreign deposits as well as growth in banknotes on issue. Using a projection of reserve supply, August 2024 reserve demand estimates suggest the RBA might be close to transitioning to its new ample reserves system – with the supply of reserves having dipped slightly below the upper 90 per cent confidence interval in the recent past (Figure 16). Taking the lower bound of the 90 per cent confidence interval, the RBA might transition to its new system as late as 2027.
The timing of this transition is subject to uncertainty associated with the future supply of and demand for reserves. For example, projecting supply requires assumptions around the level of government (and other) deposits and the growth in banknotes on issue, which are uncertain. On the demand side, the timing of the transition to ample reserves assumes no change in banking system deposits in the future and no change in banks' preference for how many precautionary reserves to hold per dollar of deposits. While RBA bond maturities will reduce the stock of deposits, there are other factors such as credit growth and banks purchasing additional HQLA securities to replace reserves lost when RBA bond holdings roll off which will likely mean deposits increase from their August 2024 level. An additional source of uncertainty relates to where overnight repo rates will trade relative to the RBA's OMO repo rate (ES rate + 15 basis points) in the ample reserves system. For simplicity, I have assumed repo rates trade at the same rate as the RBA's OMO repo. This might not be true as OMO repo is not a perfect substitute for overnight repo borrowing. It currently provides counterparties with 28-day repo funding, once a week, against a wide range of eligible collateral – including bank bonds, asset-backed securities and corporate bonds. How these design features affect where the reserve demand curve crosses the OMO price is not contemplated in my analysis.
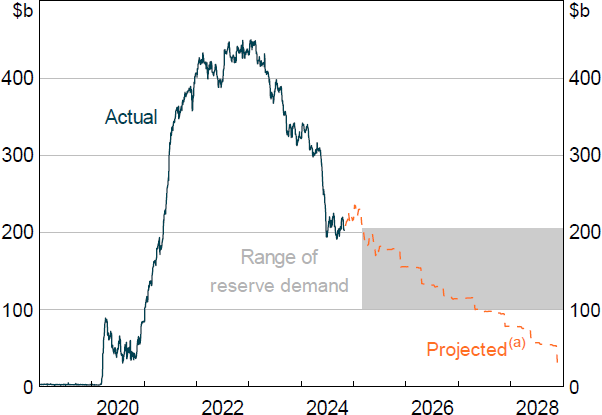
Note: (a) Assumes RBA bond holdings are held to maturity and no net change in RBA liquidity operations.
Sources: Author's calculations; RBA.
Despite these sources of uncertainty, the recent increase in bids at the RBA's OMO repo might suggest the reserve demand estimates presented in this paper are reasonable. In August 2024, the value of OMO repo outstanding grew to $32 billion – well above its $11 billion average since November 2020 despite excess reserves above $200 billion (Figure 17). Alternatively, liaison contacts noted the increase in OMO demand could have been driven by an increase in the cost of borrowing Australian dollars in the FX swap market. The increases in OMO volumes were also exacerbated by collateral and balance sheet limits binding on some repo market participants (RBA 2024a).
Reserve demand estimates presented in this paper are corroborated by those collated by staff in a survey following the RBA's future monetary policy implementation system consultation. Staff asked the following question to several large bank Treasury desks: ‘Please provide an estimate of the quantity of reserves your institution … expect[s] to hold in total based on current access to liquidity from the market and RBA’. Not all banks with active Exchange Settlement Accounts at the RBA were surveyed so the respondents' estimates were scaled up based on their share of system reserves as of June 2024. In this simple survey, banks indicated they intend to hold between $90 and $185 billion in reserves.
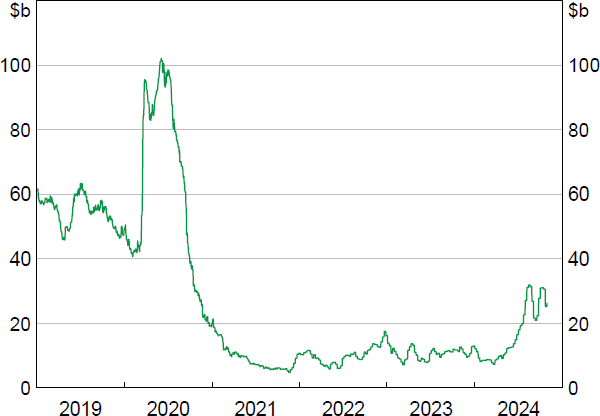
Source: RBA.
While estimates of reserve demand are inherently uncertain, the hypothesis that reserve demand has increased due to more deposits is relatively robust. This result holds across a variety of measures for short-term liabilities, including: total deposits, at-call deposits, uninsured deposits and total overnight/at-call funding. I opt to exclude credit lines and other off-balance sheet claims on banks' liquidity which could contribute to reserve demand as they are reported quarterly in Australia – reducing the number of observations in the sample to 15. When these claims are added to the regression framework, their coefficient sign (but not their statistical significance) supports the hypothesis that they contribute to reserve demand. Further work could be done to understand the link between these claims and banks' reserve demand. My results are robust to different measures of the cost of collateral (specials, bond–OIS spreads) and different sources for repo rates (APRA, ASX SOFIA) – see Appendices B.2 and B.3 for details.
Despite the exact form of nonlinearity in the demand curve being unknown, deposits affect banks' reserve demand across a number of specifications, including: reserves entering in logs, an inverse relationship and arctangent functional forms (see Appendix B.4 for details). While my results are robust to functional form assumptions, different functional forms can lead to materially different outcomes for what level of reserves constitutes ample. For example, assuming an arctangent relationship between repo rates and the level of reserves results in a lower level of ample reserves but reserve demand becoming inelastic at much higher levels of excess reserves (Figure 18).
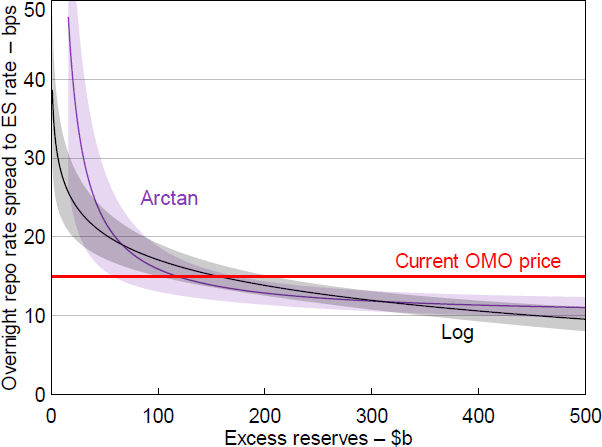
Note: Shaded areas denote 90 per cent confidence intervals.
Another limitation of this paper is that I do not account for the uneven distribution of reserves among banks. An uneven distribution of reserves amplifies the risk of spikes in money market rates if the banks holding most reserves are unwilling to lend them in the market. Copeland, Duffie and Yang (2021) outline that the September 2019 repo crunch in the United States was partly explained by reserve hoarding at large bank holding companies, who quoted high repo prices to counterparties seeking to borrow. This arguably caused a temporary loss of monetary control until the Federal Reserve stepped in to lend reserves via their OMO. Afonso et al (2020) argue that frictions in the interbank market may have prevented the efficient reallocation of reserves from institutions with sufficient balances to those who had balances below desired levels. They also find that some large dealers likely experienced an increase in intermediation costs which led them to charge higher spreads to cash borrowers in repo.
While this paper argues that deposits matter for reserve demand, it remains unclear whether higher deposits are the result of supply or demand factors. Have banks become more willing to supply short-term liabilities since the pandemic in response to a greater supply of reserves or has there been an increase in demand from households and businesses for liquid assets provided by banks? An emerging literature suggests banks may desire a shorter-dated funding mix permanently after a period of excess reserves supplied through unconventional monetary policy (Acharya and Rajan 2022; Acharya et al 2023). Future work could be done to investigate whether this finding applies in the Australian context.