Speech Bank Funding and Capital Flows
The financial crisis has led to a significant re-assessment of risk. Having been underpriced for a number of years prior to 2007, risk was rapidly and substantially re-priced as the financial crisis unfolded. Counterparty risk came to the fore and there has also been a more fundamental re-assessment of the importance of liquidity risk. There is a new-found, or re-found, appreciation for the complex ways in which risk can affect the broader financial system.
Given the pivotal role of banks in the financial system, the evolution of the financial crisis has placed particular focus on them and the way they fund themselves. Because one of the main features of banking business is maturity transformation, banks were exposed to the realisation of a liquidity shock. Problems associated with liquidity (or more precisely the lack of it) proved to be an important channel for shocks in one part of the financial system to be propagated to others.
The re-assessment and the re-pricing of these risks have caused changes in the structure of funding of Australian banks. Today, I will discuss these developments on the liability side of banks' balance sheets. But at the same time, there have also been changes on the asset side of their balance sheets, with credit growth slowing significantly, particularly lending to large businesses. The combination of these changes, together with the investment-focused growth of the Australian economy, has had a marked effect on the composition of capital flows to Australia which I will discuss later in my talk. These developments may well persist for quite some time to come.
Bank Funding[2]
The re-pricing of risk significantly increased the cost of wholesale funding for the global banking system. At the shorter end of the yield curve, the rise in costs primarily reflected counterparty concerns. This is best exemplified by the spread between a short-term rate in the interbank market and the expected policy rate (Graph 1). As has been noted in the past, this spread serves as one of the better summary illustrations of the evolution of the financial crisis.
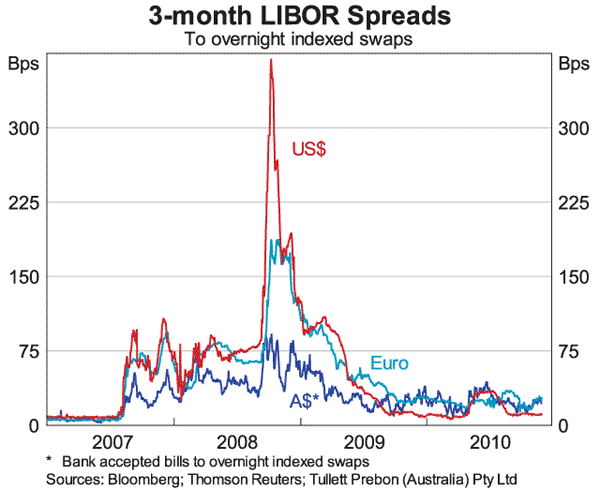
In Australia, this spread never rose as much as it did in other countries, reflecting the general absence of counterparty concerns and the associated smoother functioning of the interbank market throughout most of the crisis. As Graph 1 shows, this spread has fallen back in Australia to be not far above its pre-crisis levels: pre-crisis the 90-day spread averaged around 10 basis points, now it is around 20 basis points. It is not surprising this spread has narrowed so far. By and large, one would expect that in more stable times, counterparty concerns would be reasonably absent over shorter horizons and so not much of a risk premium should be present in the pricing. But when counterparty concerns are rising, they tend to be rapidly incorporated into this spread.
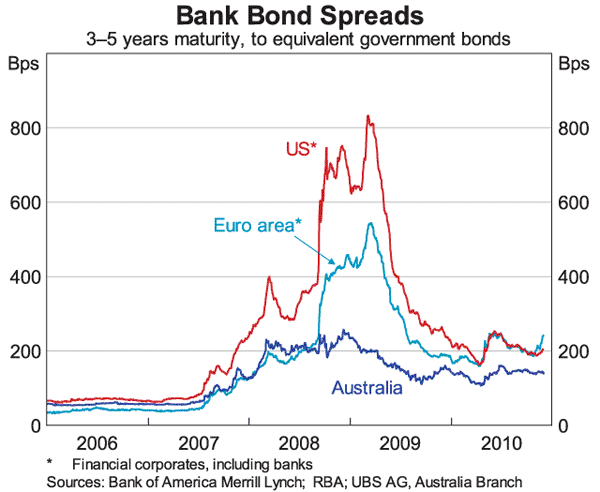
At longer terms, the effect of this repricing of risk is much more stark and, while pricing has eased back from its peaks, it still remains well above its pre-crisis levels (Graph 2). The overall cost to a major Australian bank of issuing a three-year bond has risen to around 120 basis points over the government bond yield compared with around 50 basis points pre-crisis. Graph 2 shows that similar, but larger, developments have occurred in other banking sectors.
In addition to this effect on the pricing of wholesale funding, the re-assessment of risk has had a marked impact on the structure of banks' funding (Graph 3). Banks, their regulators and markets have re-assessed the riskiness of different sources of funding, particularly liquidity risk and the related concept of rollover risk. This change in perspective is embodied in the new Basel standards for the banking system.
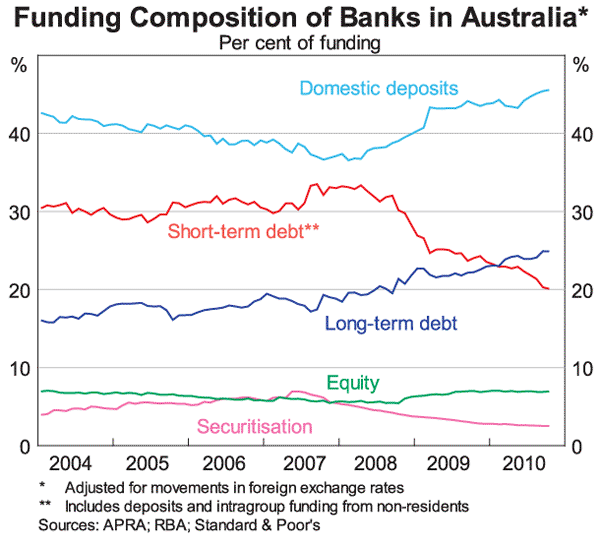
One notable change is the rise in the share of deposits from less than 40 per cent in 2007 to over 45 per cent currently. The Deputy Governor Ric Battellino talked about this at this conference last year.[3] The desire to increase the share of deposits reflects the assumption that deposits represent a more stable source of funding.
In order to boost their share of deposit funding, banks in Australia have competed aggressively in terms of price. An indication of the degree of competition for deposits is the extent to which there has been an increase in the cost of deposit funding relative to the cash rate since mid 2008: the average cost of the major banks' new deposits is now only slightly below the cash rate, whereas prior to the onset of the financial crisis, deposit rates were about 150 basis points below the cash rate (Graph 4).
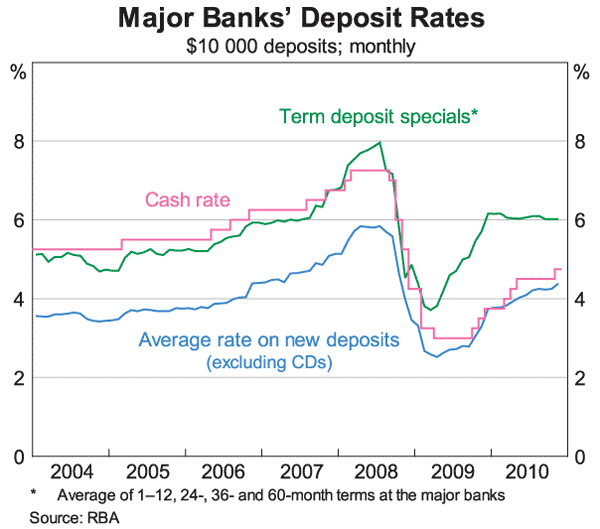
Competition has been strongest for term deposits. The average rate on banks' term deposit specials is currently more than 70 basis points above market rates for debt of equivalent terms (Graph 5). In the few years prior to the global financial crisis the average rate was generally about 60 basis points below. This is notwithstanding the fact that wholesale debt is a liquid tradable instrument whereas a deposit is not; one might expect that this liquidity of wholesale debt would result in it being cheaper.
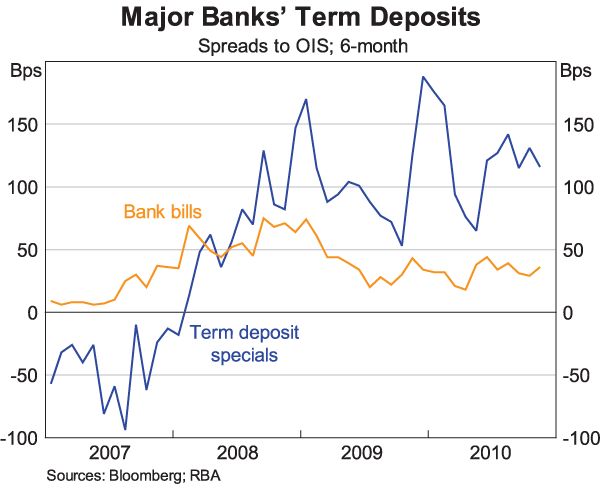
Rates on at-call savings deposits – including bonus saver, cash management and online savings accounts – have also risen relative to the cash rate. The average rate on the major banks' at-call deposits, which account for a little under half of their total deposits, is currently estimated to be around 40 basis points below the cash rate compared to around 100 basis points below in mid 2007.
So the bottom line of all of this is that the deposit market has been extremely competitive. The most marked increase in competition occurred late last year and the early part of this year. Since then, our liaison suggests that competitive pressures have not intensified further but nevertheless they remain at a high level. As Ric Battellino noted last year, at some point, it is likely that the elasticity of deposits to price declines. This means further increases in prices result in the banks mostly shuffling the deposits between themselves, rather than generating further increases in the share of funds investors allocate to deposits.
At the same time as banks have increased the share of deposit funding by around 7 percentage points, the share of longer-term wholesale funding has also increased by a similar amount. This increase in the share of funding sourced from deposits and long-term debt has mirrored a decline in the share of funding sourced from short-term wholesale debt, both from domestic and foreign markets. The share of short-term funding has fallen by 10 percentage points over the past three years, a very large change indeed.
As a result of these changes, the vulnerability of the Australian banking system to any further seizures in global financial markets has decreased. But these changes have increased the cost of funding for the banking system as a whole. The costs of all forms of funding have risen, and, at the same time, banks have shifted to more expensive sources of funding. As I said earlier, this shift has reflected market and regulatory pressures following a re-assessment of risk.
The re-pricing of risk has increased the cost of intermediation from its pre-crisis level, when it was arguably underpriced. This rise in the cost of intermediation is reflected in the increase in lending rates relative to the cash rate.[4]
The financial crisis also raised awareness of the other sources of risk for the global banking sector. For a number of European banks, the currency and maturity mismatch between their assets and liabilities raised significant issues throughout the crisis and continues to be a vulnerability. The fact that this issue is ongoing has been reflected in the recent rise in the EUR/USD cross currency basis swap. In contrast, the Australian banks hedged the currency risk of their offshore borrowing using instruments that were maturity matched. As a result they did not face the issues that some European banks faced of funding US dollar assets from a euro funding base.
The US dollar swap lines that a number of central banks, including the RBA, established with the Federal Reserve were established in large part to alleviate these stresses stemming from the European banking system. As their funding was being severely curtailed from other sources, the European banks turned to the swap market to fund their long-dated and illiquid US dollar asset positions. This demand from European banks for US dollars each day, at the same time as supply was being reduced, caused the price of US dollars to rise dramatically in all markets and time zones.[5]
The RBA participated in the swap line to help distribute US dollars into this time zone (the Bank of Japan's participation served a similar purpose).[6] It did not reflect any issue with the Australian banking system's own need for US dollars. The funds provided under the swap line were cheaper than the extremely wide market price at the time. As a result, Australian based banks availed themselves of this and in a number of cases on-lent the funds to banks in other jurisdictions. The provision of these funds globally alleviated the strains in the swap market and the spread declined. Once it declined below the price of the swap line, demand in Australia dried up and the facility was no longer offered here, although it continued to attract demand for a longer period of time in other markets.
Bank's Assets
While these developments have been taking place on the liability (funding) side of banks' balance sheets, there have been some interesting developments on the asset side too.
Since mid 2008, there has been a significant easing in the pace of credit growth, particularly for the business sector (Graph 6). Further disaggregation indicates that the easing in credit growth has been most striking for large businesses (Graph 7).
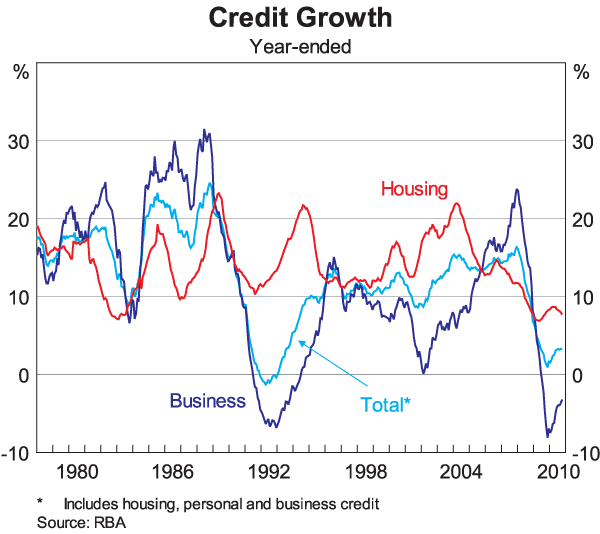
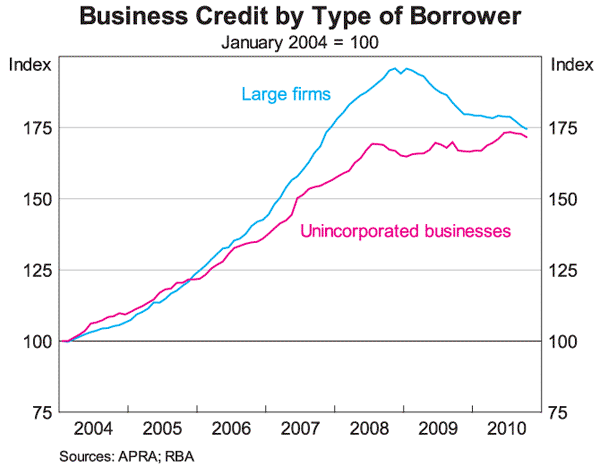
The decline in credit outstanding to large businesses reflects a number of factors:
- Some businesses have found it more cost effective to access funds directly from the market rather than through the banking system.
- In 2009, there was a record level of equity raisings by large businesses that enabled them to repay debt (Graph 8).
- There has been a tightening in lending standards for some sectors, most notably commercial property.
- A number of large businesses, particularly in the mining sector, have been able to fund their activities and repay debt from their retained earnings resulting from their strong cash flow (Graph 9).
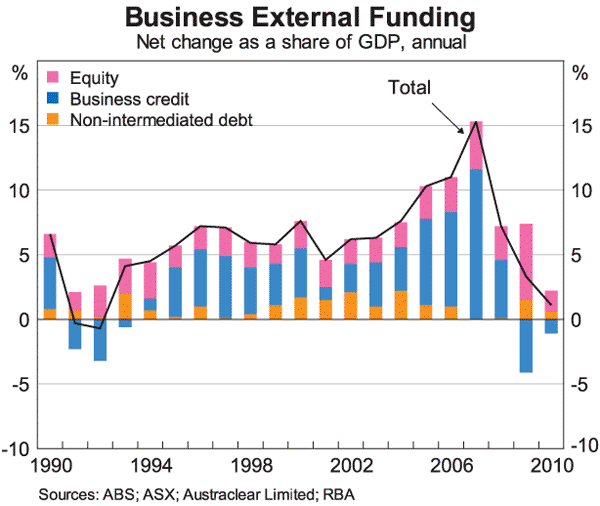
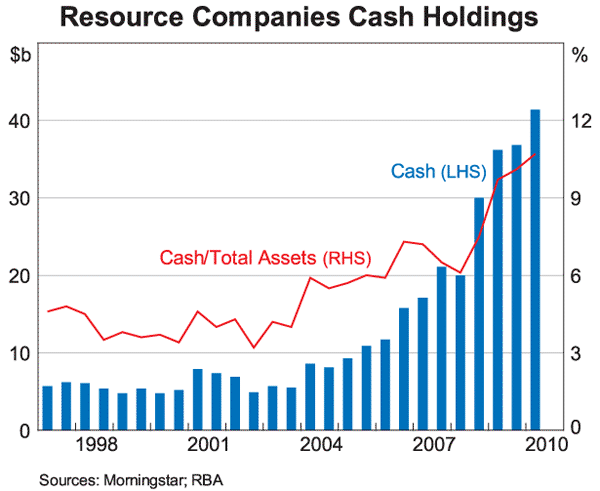
Looking forward, given the expected prominence of resource investment for GDP growth, it is quite possible this pattern of subdued business credit growth relative to robust growth in the economy might persist. The RBA's forecasts have investment increasing as a share of the economy in the period ahead to historic highs. Much (although not all) of this pick-up in investment is in the resources sector. The companies undertaking this investment tend to be much less reliant on credit intermediated through the domestic banking system. Instead they are likely to fund a sizeable share of this investment from global capital markets either through direct raisings or syndicated loans.
This slowdown in growth on the asset side of the balance sheet has alleviated pressures on banks to increase their funding. Over the past couple of years, credit growth has been slower than the growth in deposits for the first time the early 1990s (Graph 10).
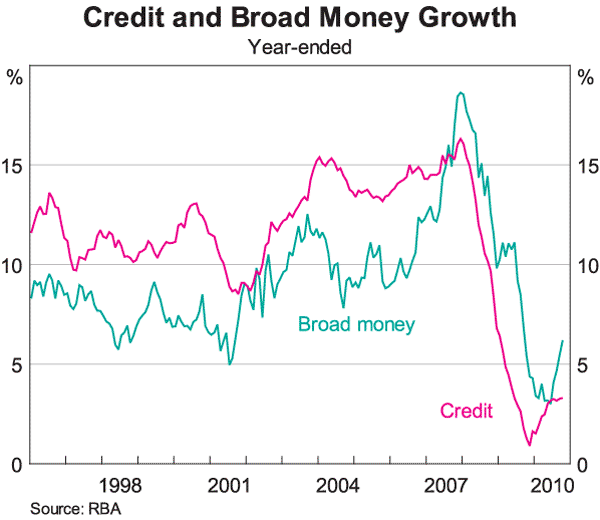
As mentioned earlier, part of the explanation for the strong growth in deposits is the increased competition for deposits in the banking system. But another part of the explanation reflects the changed nature of the financial flows in the economy. While parts of the corporate sector may be less reliant on the domestic banking system for their funding, ultimately a large part of the funding they raise from other sources still finds its way into the domestic banking system in the form of corporate deposits. Hence, if the economy evolves as forecast, it's quite possible this pattern of deposit growth outstripping credit growth continues and deposits may continue to rise as a share of bank funding.
Bank Funding and Capital Flows
These changes in bank funding, as well as in the funding of the increase in capital expenditure, are apparent in the financial accounts side of the balance of payments. These are the capital inflows that are the counterpart of the current account deficit.
The net capital inflow into Australia masks very large gross capital flows both into and out of the country. For example, over the past five years, the average annual net capital inflow amounted to $55 billion. This net capital inflow comprised:
- foreign investment in Australian equity of $54 billion;
- Australian investment in foreign equity of $51 billion;
- foreign investment in Australian debt of $95 billion; and
- Australian investment in foreign debt instruments of $43 billion.
Given the size of these gross flows, it can be somewhat misleading to analyse shifts in capital flows or how the current account deficit is funded by focusing on net flows only.
For a number of years prior to 2007, Australian banks were a steady source of capital inflow, representing around 4 per cent of GDP, or around 80 per cent of net private sector inflow (Graph 11). These capital inflows reflected the fact that Australian banks found it cost effective to raise wholesale funds offshore to fund domestic asset growth. That these net flows into the banking sector were similar in size to the current account was as much coincidence as causation in my opinion.
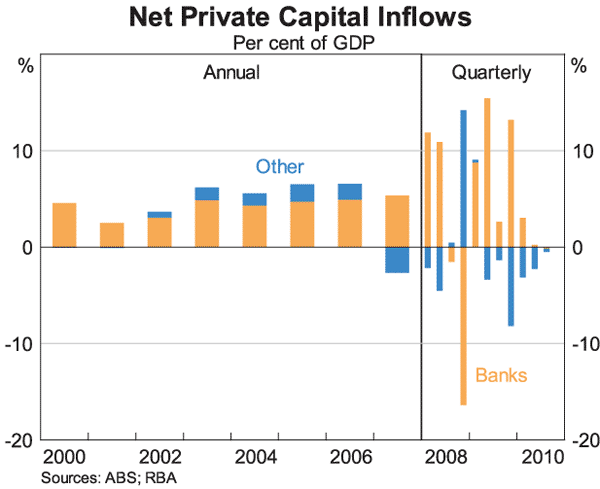
Given the changes to bank funding and the slowdown in the credit growth discussed above, financial inflows in the form of offshore debt raisings by Australian financial institutions have declined. In the first three quarters of 2010, the net inflow of foreign funding to banks was only 1 per cent of GDP. All of this occurred in the first quarter of the year, with the net amount of offshore funding by the banking sector amounting to zero in the two most recent quarters. At the same time, the current account deficit has fallen to around 2½ per cent of GDP.
Going forward, the forecast rise in the investment share of the economy is likely to see an increase in capital inflows. As discussed above, given that mining companies are likely to rely less on locally intermediated debt to fund their activities, there are likely to be further changes in the composition of net private capital inflows away from banks towards non-financial corporates. Some of this might be in the form of increased direct debt raisings, some might be in the form of an increase in retained earnings. So the current account deficit may increase from its current level, but on the capital account side, there may not be a concomitant increase in banks' net offshore raisings.
Conclusion
The financial crisis has had a marked impact on financial flows globally. In this speech I have described some of the effects it has had on financial flows in the Australian economy. The funding of the Australian banking system has changed quite markedly as has the cost of that funding. In addition, the forecast composition of growth in the Australian economy and the funding of that growth may have implications for the asset side of the banking system's balance sheet. It is quite possible that intermediated credit growth will be slower, and deposit growth relatively higher, than has been the case in recent years. These changes have been, and may continue to be, reflected in the changed composition of capital flows to the Australian economy.
Endnotes
Thanks to Alex Heath, Chris Stewart and Crystal Ossolinski for their help in preparing this speech. [1]
For more detail on bank funding, see the Reserve Bank of Australia submission to the Senate Economics References Committee Inquiry into Competition within the Australian Banking Sector, 30 November 2010. [2]
See Battellino R (2009), ‘Some Comments on Bank Funding’, Remarks to the 22nd Australasian Finance and Banking Conference, Sydney, 16 December 2009. [3]
Again, more details on this are in the Reserve Bank of Australia submission to the Senate Economics References Committee Inquiry into Competition within the Australian Banking Sector, 30 November 2010. [4]
For more information, see ‘The Functioning and Resilience of Cross-border Funding Markets’, CGFS Papers No 37, March 2010. [5]
The Fed has recently published details of these transactions, along with that of all its other programs. See <http://www.federalreserve.gov/newsevents/reform_swaplines.htm>. The RBA's participation in this program was made available to the market in real time. For more details see the Operations in Financial Markets section of the RBA 2009 Annual Report. [6]
