Speech Bonds and Benchmarks
Introduction
It's wonderful to be back at the Debt Capital Markets Summit.
The past year in Australia was a bit of a mixed bag in terms of issuance of fixed income securities. Banks' issuance of bonds was high in net terms. Issuance of Residential Mortgage Backed Securities (RMBS) by the non-banks was also high.[1] However, in the second half of 2018 issuance by Australian corporations outside of the financial sector was low. Today I'm going to discuss some of these trends.
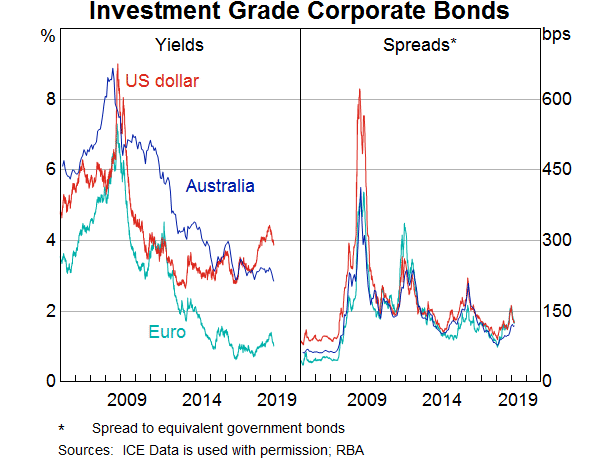
I'll also discuss trends in yields. When I was at this event last year, I noted that spreads between corporate and government bonds had declined to be around their lowest levels since the global financial crisis (Graph 1). Over 2018, spreads on Australian bonds widened in line with global developments. The sharp rise in spreads around the end of 2018 reflected a greater concern regarding downside risks.[2] While spreads have narrowed a little in early 2019, they remain wider than when I spoke here a year ago.
In the second half of my presentation I want to address the risks relating to interest rate benchmarks. These are directly relevant to many of you here and it's good to see that they will be discussed later today. These benchmarks are right at the heart of the plumbing of the financial system and, if they were to stop suddenly, this could generate significant financial instability. The clock is ticking for institutions with exposures to the London Inter-Bank Offered Rate (LIBOR) benchmarks. However, a path for transition away from LIBOR has been cleared, and we encourage all users to be taking the necessary steps to prepare for this change. And while bank bill swap (BBSW) rate benchmarks remain robust, there are still some issues that users should be addressing, which I will discuss today. If we work collectively, we can significantly reduce these risks.
Bonds
Let's start though by considering developments in some key Australian bond markets.
Bank Bonds
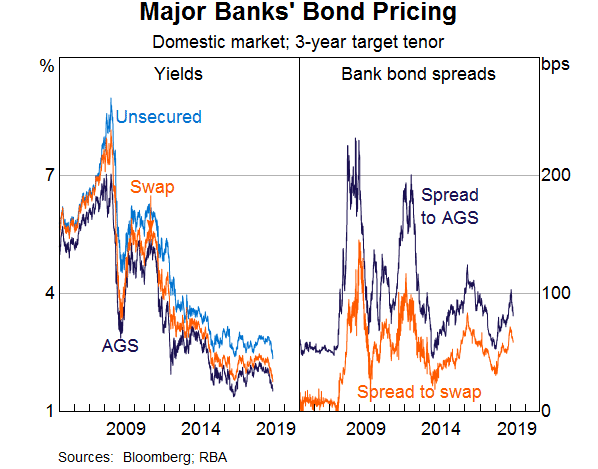
Australia's largest corporate fixed income market is that for financial corporation debt, of which bank bonds form a large part. Bank bond spreads widened in line with global developments over the past year or so. Nonetheless, yields remained relatively stable at a low level as benchmark rates edged down (Graph 2). Over 2019, thus far, both spreads and benchmark rates have fallen. So there has been an appreciable decline in the cost of issuing unsecured debt in this form to very low levels by historical standards.
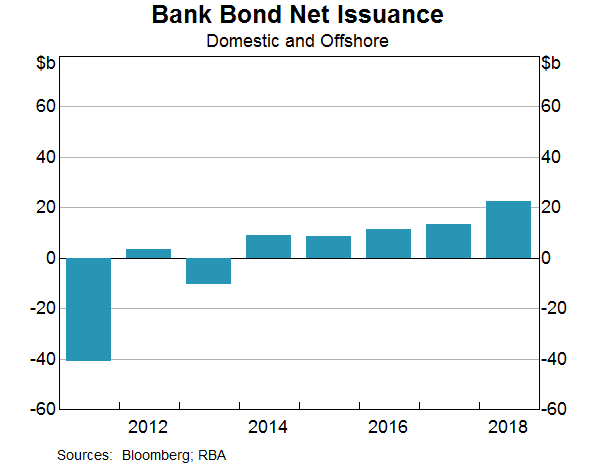
Issuance of bank bonds was quite high in 2018 in net terms. In fact, net issuance was the highest for almost 10 years (Graph 3). That high level of net issuance reflected gross issuance around the average we have seen over the past few years at the same time that maturities in 2018 were at a low level.
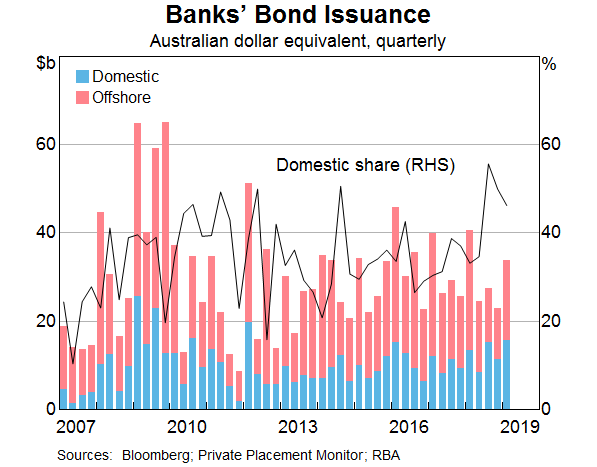
In addition to strong net issuance, over the past year the banks have been issuing a larger share of their bonds domestically (Graph 4). The banks have not just issued less paper overseas. They have also issued a higher value of bonds in the domestic market.
Often the perception of the domestic market is that it has limited capacity to absorb sizeable increases in issuance. However, it appears that the banks were able to issue the extra bonds domestically at a price that was at least as, if not a little more, favourable for the banks than the price of bonds issued offshore (after accounting for hedging costs; Graph 5).[3]
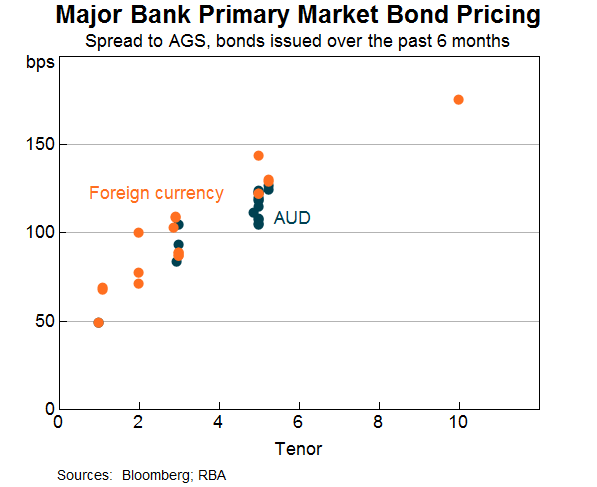
This raises the question of who was buying this domestically issued paper? Comprehensive data (from the Financial Accounts) show that the domestic issuance over the year to September 2018 was widely held across different sectors. But pension funds bought a disproportionate share of the issuance over that period – almost 25 per cent compared with the 5 per cent share that they had typically held.
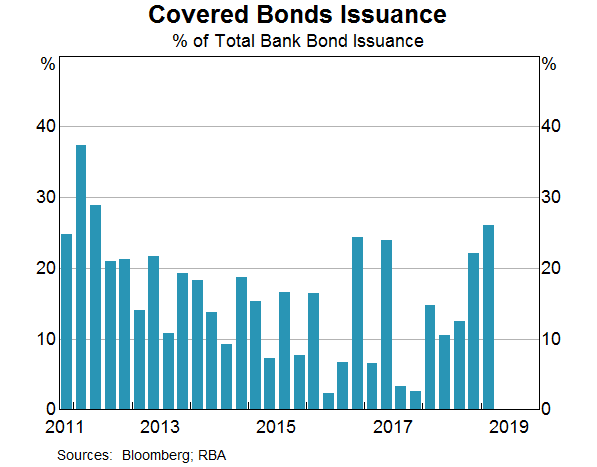
In recent months, another notable feature has been the relatively high value of issuance of covered bonds (Graph 6). This may have been related to the rise in volatility around the turn of the year in domestic and global financial markets. Liaison with banks suggested that the tighter conditions in funding markets at the time did push banks to issue more covered bonds, since these are viewed as a good option for funding at such times. Having said that, there is still plenty of capacity for the banks to tap their covered bond lines if they have the need.
Non-Financial Corporations
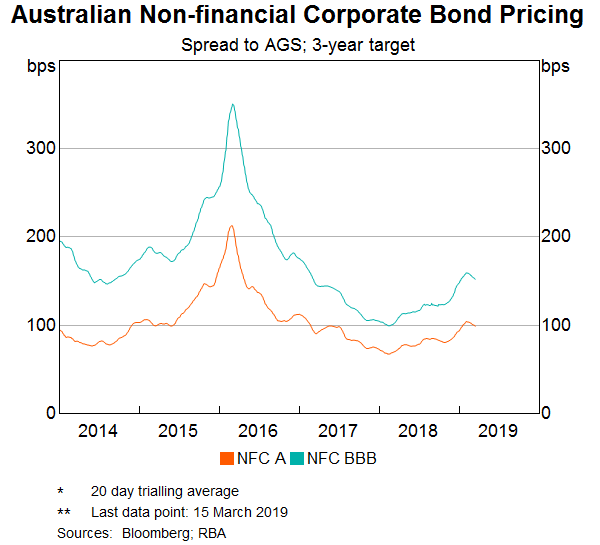
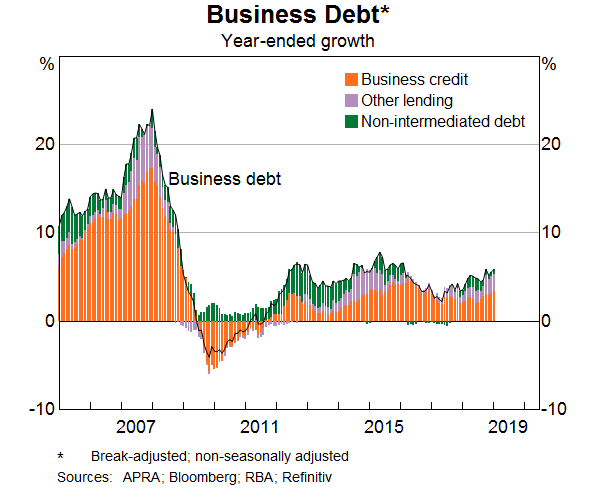
Over 2018, non-financial corporation spreads followed those of financial corporations, and by extension, spreads in global markets (Graph 7). Issuance in the second half of 2018 was quite low, and the market is off to a slow start in 2019. However, with yields still low, this doesn't appear to be a story about companies finding it difficult to obtain funding in bond markets. Moreover, the growth of business debt more generally – which includes bonds and credit issued by banks – has picked up over the past year or more (Graph 8). This quarter has seen some issuance among resource related corporations. Notwithstanding that, this is likely to remain a relatively quiet corner of the market for some time given that the resources sector in general has been deleveraging following the end of the mining investment boom.
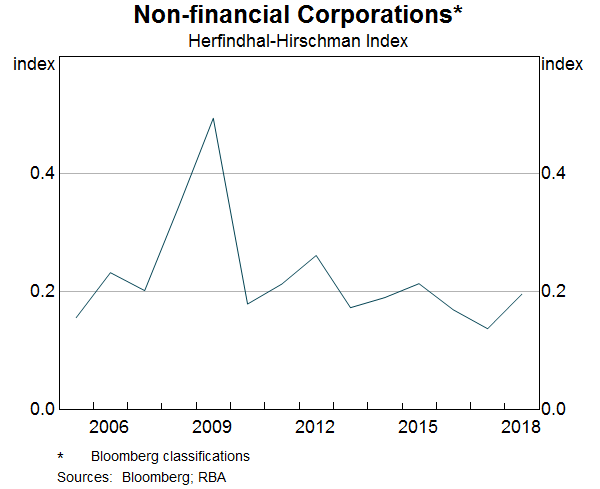
Despite 2018 being somewhat quiet, a diverse range of corporations have issued bonds. Last year, I showed some graphs of Herfindahl-Hirschman indices, which is a standard way of measuring concentration. The lower the index, the lower the level of concentration and the more diverse is the set of issuers.[4] In 2017, the index for non-financial corporations hit its lowest – most diverse – levels for some time (Graph 9). There was an uptick in concentration in 2018, but it is still at relatively low levels.
RMBS
In 2018, non-banks issued the second largest amount of RMBS since the GFC, only narrowly eclipsed by 2017 issuance (Graph 10). This was associated with strong growth of non-bank housing loans, as they gained some market share from banks. Spreads widened in line with other markets, although spreads for non-conforming deals appear to have widened a little more than for other deals.
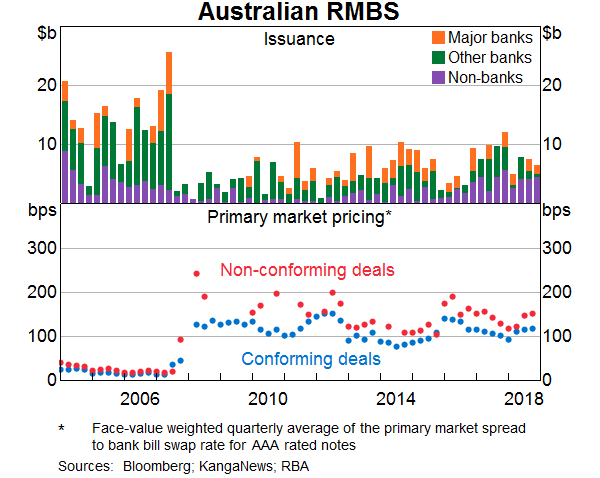
The noticeable rise in the share of new mortgages extended by non-banks over recent years reflects, in part, earlier regulatory actions limiting the growth of banks' investor and interest-only mortgages. Banks' tighter lending standards in light of the Royal Commission have also had an effect on their lending activity over the past year.
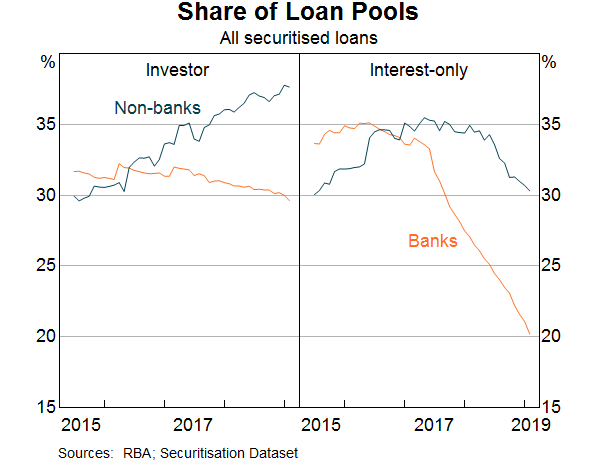
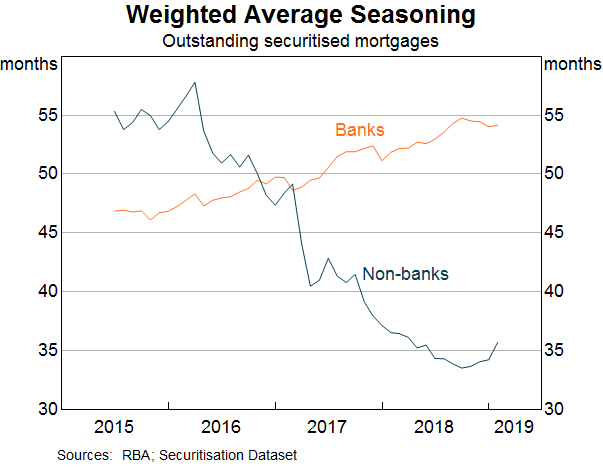
Not only did this change in the banks' behaviour contribute to the strong growth of non-bank lending, it may also have contributed to the shift in the nature of the collateral underlying the non-bank securitisation deals. We can use the Reserve Bank's Securitisation Dataset to see three key changes.[5] First, the share of investor loans in non-bank securitisations has increased over the past few years (Graph 11). Second, their share of interest-only loans has remained relatively high, in contrast to the share of interest-only loans in banks' securitisations. Third, the level of seasoning in non-bank deals has also fallen (Graph 12). In other words, their loans are newer than in the past and newer than for the bank securitisations. The fact that non-banks are bundling up mortgages more quickly into securities suggests that they are writing loans more quickly and, therefore, reaching the limits of their warehouse facilities.
In summary, over the past year or so, well-rated corporations – both in and outside of the financial sector – have been able to source funding in bond markets. While spreads on corporate bonds are higher than a year ago, yields remain low. That is a reflection of the effect of the expansionary setting of monetary policy, which is providing support to the economy more generally.
Interest Rate Benchmarks
I'll change tack now by discussing the reform of interest rate benchmarks. Because these are intertwined with much of the financial system's ‘plumbing’, the issue has been a longstanding focus for the global regulatory community.[6] Increasingly, it needs to also become a key focus of financial market participants, including many of you here today. With that in mind, I'd like to provide a brief update on the work underway to strengthen interest rate benchmarks, both internationally and in Australia.
The end of LIBOR
The various LIBORs have long been the key interest rate benchmarks for the major currencies. However, given that they are not supported by a sufficient volume of transactions in wholesale short-term funding markets, it is now widely recognised that these will come to an end. The UK Financial Conduct Authority (FCA), which regulates the LIBOR benchmarks, has made it clear that it will not support LIBOR beyond the end of 2021.[7] This is an important issue for Australian financial institutions, which have substantial exposures to LIBOR through derivatives, bonds and syndicated lending.
To replace LIBOR, regulators have worked closely with industry participants to develop alternative risk-free rates, such as the Secured Overnight Financing Rate (SOFR) for the US dollar and the Sterling Overnight Interbank Average Rate (SONIA) for the British pound.[8] The transition to risk-free rates is accelerating internationally across derivatives and bond markets. It is encouraging to see that Australian banks have recently issued sterling floating-rate notes (FRNs) referencing SONIA rather than LIBOR.[9]
New products can reference these new benchmarks. But when LIBOR comes to an end, there could be disruptions for many existing products referencing LIBOR unless their contracts contain robust ‘fall-back’ provisions. ISDA (International Swaps and Derivatives Association) has been taking the lead on this work at the request of the Financial Stability Board (FSB). This will involve using the risk-free rates as fall-backs for LIBOR, but with an appropriate adjustment for the historical spread between them. ISDA is expected to finalise these fall-back provisions by the end of the year. We strongly encourage all users of LIBOR in the Australian market to be ready to adopt these new fall-back provisions in their contracts.
BBSW remains robust
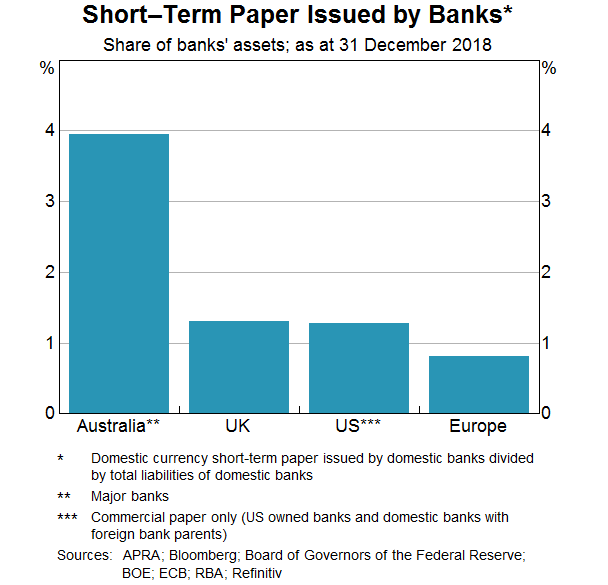
The BBSW rates are important interest rate benchmarks for the Australian dollar. A lot of work has already been done to ensure that these remain robust. This market – where banks raise short-term funding by issuing bills to wholesale investors as a liquid asset – is a longstanding one.[10] The bank bill market is considerably larger as a share of the Australian major banks' balance sheets than equivalent markets in the US and Europe (Graph 13). As a result, unlike for LIBOR, there are enough transactions in the Australian bank bill market to support a benchmark.
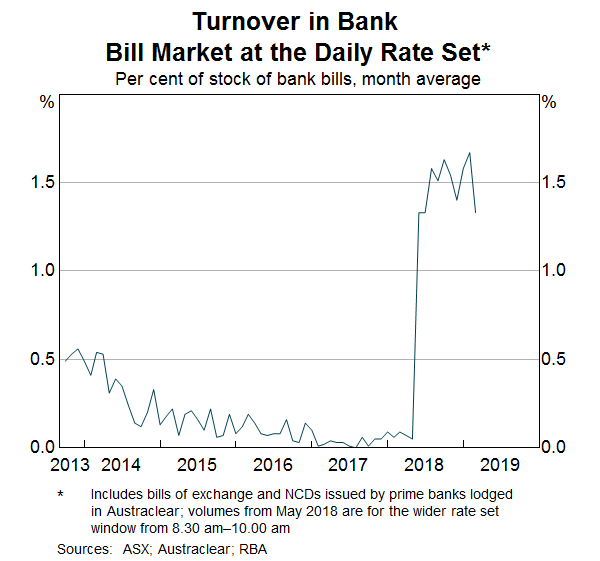
Around a year ago, a new methodology was put in place for BBSW. This has made it possible to calculate BBSW rates directly from transactions in the bank bill market between banks and wholesale investors. This required the ASX, market participants and regulators to work together to develop new infrastructure and market practices. The new methodology has performed very well, with much more trading activity now underpinning BBSW during the ‘rate set window’, which is from 8.30am – 10am (Graph 14).[11]
Strengthening contractual fall-backs for BBSW
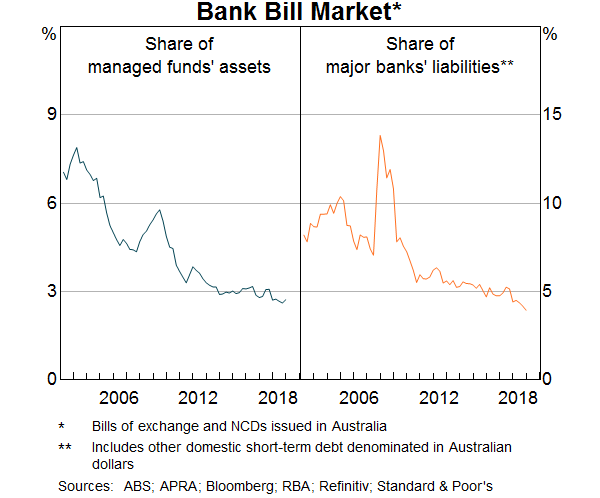
While BBSW is a robust benchmark, we shouldn't take this for granted. The bank bill market is expected to have a secure future, since the assets of managed funds continue to grow, supported by superannuation contributions. These managed funds need to hold some liquid assets such as bank bills to be able to meet unexpected redemptions. Despite this, bank bills have been slowly declining both as a share of managed funds' assets and the major banks' liabilities (Graph 15). This is partly due to the liquidity standards introduced over recent years, which reduced the value that banks place on short-term wholesale funding. Given these trends, we cannot be certain that the bank bill market will always be large enough to sustain the BBSW rates as viable benchmarks.
If BBSW were ever to cease, the existing fall-back provisions in many contracts would be cumbersome to apply and could generate significant market disruption. The Australian Securities and Investments Commission (ASIC) is the regulator of licensed benchmark administrators. To protect financial stability, ASIC also has the power under the new benchmarks legislation to compel the banks to make submissions so that BBSW can still be calculated. However, if the bank bill market no longer existed, this would clearly not be a long term solution.
This is why we have been working with ISDA to strengthen the contractual fall-backs for BBSW at the same time as LIBOR. This will involve using the cash rate – which is the risk-free rate for the Australian dollar – as the fall-back, with an adjustment for the historical spread between BBSW and the cash rate. Once ISDA has finalised the fall-back provisions, we expect all users of BBSW to adopt them where possible. For new securities referencing BBSW, the RBA will make it a requirement that these fall-back provisions be adopted before the securities can be eligible in the RBA's market operations. Currently, this would affect FRNs issued by banks, securitisation trusts and the state governments.
Users of 1-month BBSW should consider alternative benchmarks
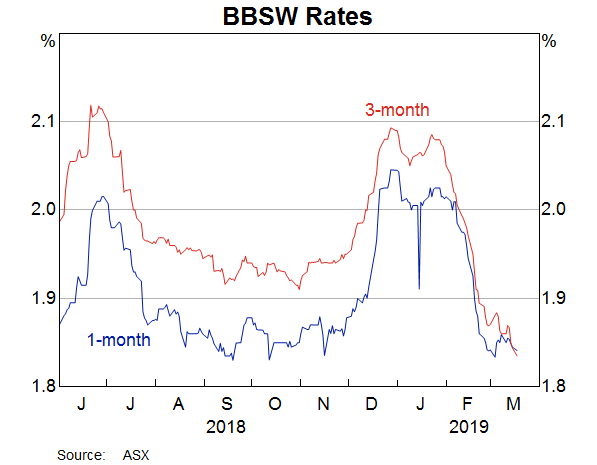
Meanwhile, users of BBSW should also be aware that the market underpinning the 1-month tenor is not as liquid as for the 3-month and 6-month tenors. Unlike for these longer tenors, banks have no incentive to issue 1-month bills. This is because under the liquidity standards, they would be required to hold an equivalent amount of high-quality liquid assets.[12] The few transactions that do occur are mainly ones where investors are selling their bills back to the banks. While there are enough transactions to directly measure 3-month and 6-month BBSW on most days, this has only happened about half the time for 1-month BBSW.[13] Since the new calculation methodology was introduced, 1-month BBSW has also been more volatile than 3-month BBSW. This was particularly evident in mid January (Graph 16). So the lack of liquidity in the underlying market for 1-month bills appears to be affecting the benchmark.
Given these issues, users of 1-month BBSW should be preparing to use alternative benchmarks.[14] This is particularly relevant to the securitisation and derivatives markets, which frequently reference the 1-month rate. Consistent with this, the Reserve Bank is thinking about this issue given that it is relevant to a number of securities that we hold via our market operations.
One option would be for issuers to instead reference 3-month BBSW; another option is to reference the cash rate. It will be important for market participants to evaluate the best options and make progress towards these in a timely manner.
The cash rate is the alternative risk-free rate for the Australian dollar
The cash rate is best known as the Reserve Bank Board's operational target for monetary policy. But it is also a significant benchmark in Australian financial markets. The cash rate is administered by the RBA and calculated directly from transactions in the interbank overnight cash market.
With the transition from LIBOR to risk-free rates internationally, we would expect there to be some corresponding migration away from BBSW towards the cash rate. This is particularly the case for financial products where it makes sense to reference a risk-free rate instead of a credit-based benchmark. For instance, FRNs issued by governments and securitisation trusts could instead tie their coupon payments to the cash rate instead of BBSW. The South Australian Financing Authority recently announced its interest in issuing a FRN linked to the cash rate. This would be a first for Australia.
We know that there is also demand from investors for term risk-free rates with similar tenors to LIBOR and BBSW. Some benchmark users value having more certainty about their cash flows, since a term rate would be known at the start of the relevant interest period, rather than being calculated at the end of the period by compounding the cash rate. It could be possible to generate a term rate using the overnight indexed swap market or the repo market. We are supportive of efforts by the private sector to develop such term rates. However, there would need to be significant effort to develop the appropriate market infrastructure and practices before these could be considered robust benchmarks. Given this, we encourage market participants to consider using the cash rate rather than waiting for the development of a term rate.
In conclusion, there are three main points I would like to leave you with concerning interest rate benchmarks:
- It is widely recognised that LIBOR will come to an end. Market participants in Australia should continue preparing for this by moving to alternative risk-free rates and adopting more robust fall-back provisions in their contracts.
- While BBSW remains robust, it would be prudent for all users to also adopt more robust fall-back provisions for BBSW in their contracts.
- Users of 1-month BBSW should be considering alternative benchmarks given the illiquidity in the underlying market. We would suggest that participants consider using other robust benchmarks that are already available rather than waiting for the development of a term risk-free rate.
Endnotes
I thank Leon Berkelmans, Ellis Connolly and other staff in the Domestic Markets Department for excellent assistance in preparing these remarks. [*]
Non-banks refers to financial institutions that are not authorised deposit taking institutions, or non-ADIs. [1]
See Kent (2019) ‘Financial Conditions and the Australian Dollar – Recent Developments’, Address to XE Breakfast Briefing, Melbourne 15 February. [2]
Graph 4 accounts for hedging costs using cross currency basis swaps and interest rates swaps. The calculations assume that banks swap their issuance into fixed rate Australian debt at the time of issuance, however in reality they can execute the swap at a later date depending on the pricing. [3]
If the market is accounted for by only one industry, this index is 1. If, on the other hand, n industries each have an equal share of the market, the index is 1/n. [4]
For more information on the Dataset, see Fernandes K and Jones D (2018), ‘The Reserve Bank's Securitisation Dataset’, RBA Bulletin, December. [5]
See: Debelle G (2018), ‘Interest Rate Benchmark Reform’, Keynote at ISDA Forum, Hong Kong, 15 May; Debelle G (2017), ‘Interest Rate Benchmarks’, Speech at FINSIA Signature Event: The Regulators, Sydney, 8 September; Debelle G (2016), ‘Interest Rate Benchmarks’, Speech at KangaNews Debt Capital Markets Summit 2016, Sydney 22 February; Debelle G (2015). ‘Benchmarks’, Speech at Bloomberg Summit, Sydney, 18 November. [6]
Schooling Latter, Edwin (2019), ‘LIBOR transition and contractual fallbacks’, speech delivered at the International Swaps and Derivatives Association (ISDA) Annual Legal Forum, 28 January 2019. Available at: <https://www.fca.org.uk/news/speeches/libor-transition-and-contractual-fallbacks>. [7]
SOFR is a broad measure of the cost of borrowing US dollars under repurchase agreements collateralised by US Treasury securities; SOFR is administered by the New York Fed. SONIA is a measure of the cost of borrowing British pounds in the wholesale unsecured overnight market; SONIA is administered by the Bank of England. [8]
The Commonwealth Bank issued a FRN referencing SONIA on 3 December 2018 and ANZ issued a covered bond referencing SONIA on 11 January 2019. [9]
The instruments traded in the Australian bank bill market are bills of exchange and negotiable certificates of deposit (NCDs). Historically, bills of exchange were the main instrument, although in recent years issuance of NCDs has dominated the market. [10]
For more details, see Connolly E and S Alim (2018), ‘Interest Rate Benchmarks for the Australian Dollar’, RBA Bulletin, September. [11]
Under the liquidity coverage ratio (LCR), banks are required to hold sufficient high-quality liquid assets (HQLA) to be able to cover their net cash outflows in a 30-day stress scenario. In this scenario, bank bills maturing within the next 30 days are treated as a cash outflow, so the bank issuing them would be required to hold an equivalent amount in HQLA. [12]
To improve the stability of 1-month BBSW, the ASX has announced a change to the methodology that is expected to result in a significant reduction in the proportion of days when 1-month BBSW can be directly calculated using transactions. See ASX (2019), “Consultation on changes to 1 month BBSW VWAP Methodology”, Available at: <https://www.asxonline.com/content/asxonline/public/notices/2019/mar/0160.19.03.html>. [13]
The RBA has highlighted this issue in previous speeches: Kent C (2018), ‘Securitisation and the Housing Market’, Address to the Australian Securitisation Forum Conference, 26 November; Debelle G (2018), ‘Interest Rate Benchmark Reform’, Keynote at ISDA Forum, Hong Kong, 15 May [14]
