Speech The State of the Economy

Guy Debelle[*]
Deputy Governor
The American Chamber of Commerce in Australia (AmCham) Business Luncheon
Adelaide –
Thank you very much to AmCham for giving me the opportunity to speak in my home town of Adelaide.
Today I am going to discuss the Bank's assessment of the current economic situation both in the world and in the Australian economy. I will also talk about some of the key uncertainties about the future economic path. In particular I will highlight the tension between labour market data and output data not only here in Australia but also in a number of economies around the world. How that tension resolves in the period ahead will be an important determinant of the future path of monetary policy.
The Global Economy
I will start with the global economy. It is important to remember that the Australian economy and financial conditions are significantly influenced by global developments.
The global economy recorded a strong pace of growth through 2017 and the first half of 2018. But the global economy lost momentum in the second half of 2018 and that loss of momentum has continued into 2019. GDP growth slowed in China and the euro area in the second half of 2018, though it continued at a more than respectable pace in the United States.
While we don't yet have GDP readings for 2019, the loss of momentum is evident in business surveys of manufacturing conditions in many economies. The slowdown is not as marked in surveys of business conditions in the services sectors. This potentially indicates that the drivers of the slowdown are more external rather than internal. Services say more about domestic demand, which has been more resilient.[1] It is worth remembering that we have both more and more frequent economic indicators of manufacturing than we do of the services sector. The higher frequency data on the manufacturing sector often drives the news cycle. Yet in many economies, including Australia, the services sector accounts for well over half of the economy.
At the same time as GDP growth has slowed, the labour market in a number of economies has remained strong (Graph 1). This is particularly true in Germany, Canada and the United Kingdom. In each of these economies, GDP barely grew in the fourth quarter of 2018, but all recorded solid employment growth, above average in some cases. In the United States, GDP growth was around 2 per cent (annualised) in the final quarter, employment growth was almost as strong.
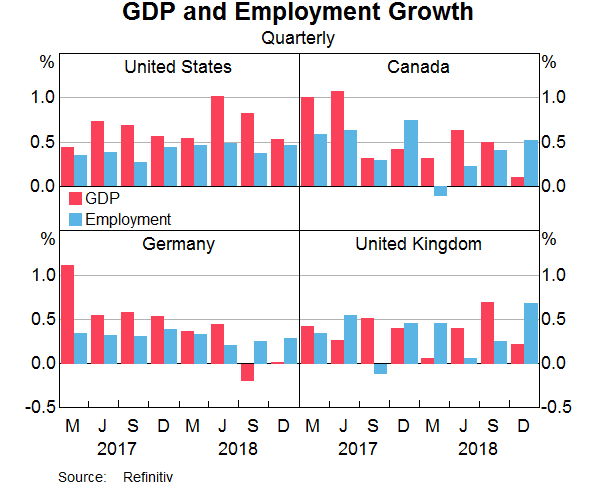
A critical question is which of these is providing the best signal of the global growth impulse? Is it GDP or the labour market? How can we reconcile the difference? One explanation is that productivity growth is weak. But by and large that is just a tautology. Productivity growth is the rate of growth in output less the rate of growth in employment. So saying that it is low is just an accounting outcome of strong employment and weak output growth.
Another explanation is that the labour market is a lagging indicator. That is, the strength of the labour market is simply a reflection of the strength in output in the first half of 2018. That may be the case, but the strength in the labour market has continued in these economies into the first few months of 2019. This begs the question of why are businesses still continuing to hire people in the face of a slowdown in growth that started over six months ago. I will come back to this issue in the Australian context later.
The continued strong growth in employment has seen unemployment rates in the United States, Germany, the United Kingdom and Japan decline to multi-decade lows. As a result, wages growth is picking up in all of these economies. The pick-up in wages has taken longer and been more gradual than expected, but it is happening now. Wages growth is currently running above 3 per cent in the United States, the United Kingdom and Germany. In each case, this is the highest pace of wages growth in around a decade. In Japan, wages growth is in positive territory.
But this pick-up in wages growth has yet to translate into any noticeable rise in inflation. The sharp fall in oil prices towards the end of 2018 has dampened inflation, though oil prices have rebounded in recent months, so this disinflationary impulse has run its course for the time being.
China
Coming back to the key question: what has caused the global economy to slow?
One explanation is China. The Chinese economy has slowed. Some of the slowing was expected as labour force growth in China slows with the population dynamics. Furthermore, the high rate of productivity growth could not be sustained given the transformation of the economy that has already occurred. This slowing has been reflected in forecasts of Chinese growth for some time. But the recent slowdown has been more than expected and, in particular, more than the Chinese policymakers appear to have expected.
A significant contributor to the slowdown has been the clampdown on shadow or non-bank finance. This was done deliberately to address the financial stability concerns arising from the high and rapidly growing stock of debt. The clampdown on non-bank finance particularly affected the private sector in China, which has been an important engine of growth.
Chinese policymakers have responded to the slowdown by providing some stimulus. This has been done in a measured way. There has been increased fiscal stimulus including through increased infrastructure spending. The authorities are trying to balance the objective of restraining debt growth against the need to support activity and employment. Hence the stimulus is not of the scale that was implemented at various times over the past decade. They have also aimed to alleviate the monetary restraint. But there is a question of how effective or timely this stimulus might be given that credit is being provided primarily through the core state-owned banking system, rather than the non-bank financial sector. The state-owned banks have not traditionally been that focused on lending to the private sector. As they begin to do so, they are needing to enhance their credit assessment skills. Hence the effect of this stimulus may take a little while to become apparent.
The effect of the various elements of policy stimulus in China will have different effects on different parts of the global economy. A crude characterisation is that the Australian economy will benefit from the infrastructure spending, Germany from investment spending/industrial production and Italy (and Germany too) from consumer discretionary spending. The various indicators in Graph 2 provide one lens through which to view the impact of the policy stimulus across these different sectors of the Chinese economy.
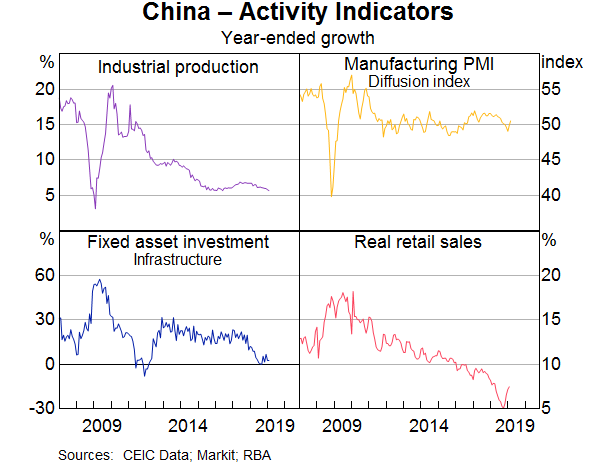
A final point on the Chinese economy: even more than in other countries, it is very hard to get a read on household spending on services in China. Yet that is accounting for an increasingly large share of the Chinese economy.
Global Trade
Another factor that has contributed to the decline in global growth is the escalation in trade tensions. The effect has been more from the uncertainty about where the trade disputes might land, rather than the tariffs that have been implemented to date. My sense is that while businesses would prefer not to have the tariffs in place at all, if they knew what they were and that they were unlikely to change, then they could plan around them.
But the ongoing uncertainty about when China and the United States are likely to reach a deal, what form that deal might take and how durable that deal might be, makes it difficult to make investment decisions on new productive capacity. This is particularly the case for investment decisions for businesses in the global supply chain. Do various parts of the global supply chain need to relocate? If so, to where?
That investment uncertainty has played out in many economies, particularly in the manufacturing sector. The slowdown in investment spending has affected economies along the supply chain, including Germany.
Financial Markets
Turning briefly to global financial developments. There was a marked decline in many asset prices at the end of 2018. Part of the decline reflected a welcome correction from stretched asset valuations, but the speed of the decline overlaid with growing unease about the slowdown in the global economy heightened concerns.
Subsequently, many of these asset price movements have been reversed. Global equity prices had one of their best quarters in the first quarter of this year. Credit spreads which had widened have tightened back to their previous low levels. As a result, global financial conditions are very accommodative.
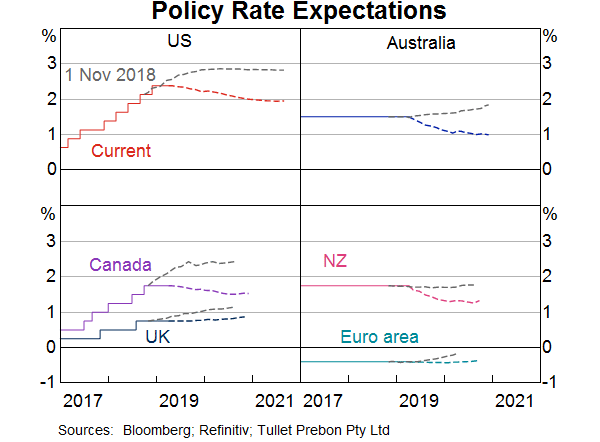
There has also been a marked reassessment of the expected future path of monetary policies (Graph 3). Where the market had been expecting further interest rate rises in the United States and other countries in 2019, it now expects interest rate reductions. This shift in policy expectations combined with increased pessimism about the global economic outlook has seen government bond yields decline significantly. In Australia, the 10-year bond yield reached an historic low of 1.73 per cent in March.
As a result of the decline in US yields, there has been much commentary recently about the fact that the US yield curve became inverted.[2] That is, short-term yields were higher than long-term yields. In the past this has often been a leading indicator of a recession in the United States (Graph 4).
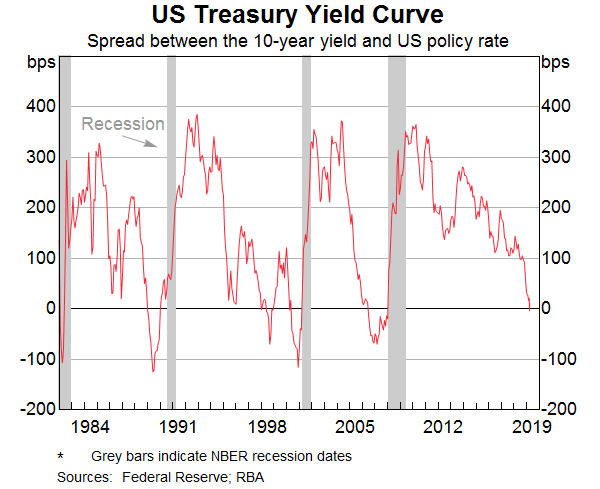
In thinking about this issue there are a few considerations that are worth bearing in mind. Firstly, term premia in sovereign bond markets are unusually low, or even negative. That is, there is no compensation for the risk of holding a longer-term government bond over a short-term bond. Historically, this premium in the United States has averaged around 150 basis points. If that was the premium today, the yield curve would be a fair way from inversion. Secondly, in the past, the yield curve has inverted when the policy rate has risen into clearly restrictive territory. That is not obviously the case today. Thirdly, as I just mentioned, credit spreads are tightening. This doesn't normally happen as the economy slows. Corporate bondholders generally want increased compensation for the risk of default, which rises in a recession.
Australian Economy
Turning to the Australian economy, GDP growth has come in weaker than we expected in the second half of 2018 (Graph 5). Some of the weakness was temporary, such as the disruption to resource exports and the effect of the drought. But the primary reason for this has been that consumption growth has been markedly slower than we had forecast. Partly this was because the rate of consumption growth was revised lower than had been earlier reported. But beyond that, the growth in consumption in the second half of the year was considerably slower than we had anticipated.
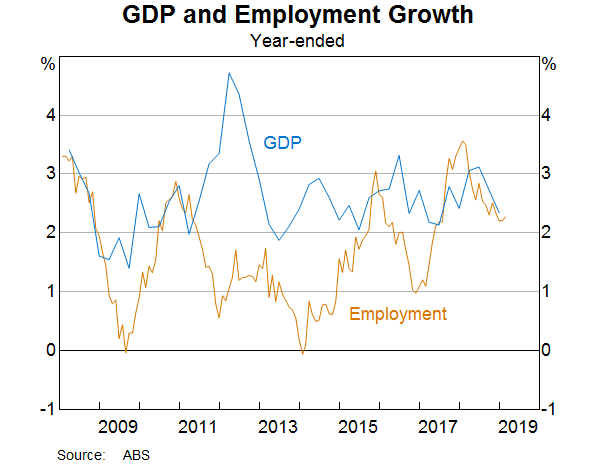
Why did consumption growth slow so markedly in the second half of the year?
Some part of the slowdown is likely to be related to the declines in housing prices, primarily in Sydney and Melbourne. I am not so sure that is from the direct ‘wealth’ effect of lower housing prices as much as it is from the fact that turnover in the housing market is at very low levels, as is typically the case when housing prices have been falling. As people are moving house less, they are spending less on things like household furnishings.[3] They are also spending less on cars.
One puzzle related to the possible wealth effect is that the slowdown in household spending has been much more pronounced in New South Wales than it has been in Victoria, despite similar declines in housing prices. While population growth in Victoria is higher than in New South Wales, that doesn't account for the whole difference.
In my view, the main explanation as to why consumption growth has slowed is the low growth in household income, and an increasing expectation that it is likely to remain low.[4] The Governor has made this point in recent commentary.[5] My colleague Luci Ellis recently examined why household income growth has been low.[6]
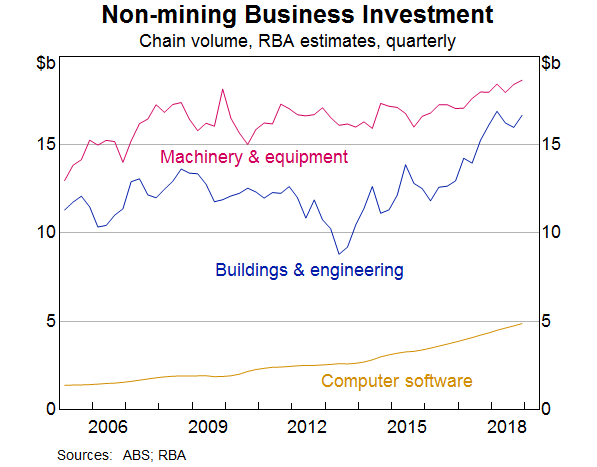
While consumption has been unexpectedly weak, other parts of GDP have evolved broadly as we had expected. Business investment, outside the mining sector, has been growing at a good rate (Graph 6). Some part of this is related to the infrastructure spending occurring right round the country, but far from all of it. There has been strong growth in investment in machinery & equipment and software. Mining investment has continued its large decline from its peak five years ago, but that decline is about at the end. Indeed, mining investment is likely to increase again soon. This will be nothing like the large boom of a decade ago, but it will be positive nonetheless, and so will no longer be a drag on economic growth.
Exports have continued to grow as expected (Graph 7), notwithstanding some temporary disruptions to resource exports. The investment in the resources sector over the past decade is bearing fruit in terms of increased exports of iron ore and LNG. There is further growth in LNG to come in the year although, beyond that, there is likely to be limited scope for further increases in resource exports without a further increase in investment in the sector. Service exports, which include education and tourism, continue to grow. Manufacturing exports have grown quite strongly of late. Some of this is high-tech manufacturing and some of this is wine and food, a significant part of which comes from South Australia.
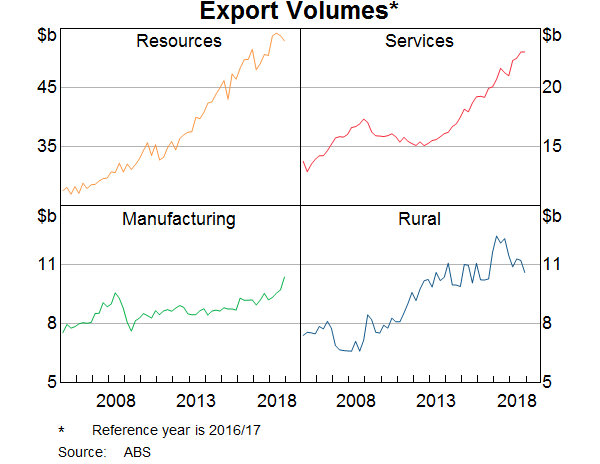
The effect of the drought is evident in the recent decline in rural exports. In aggregate, the drought subtracted around ¼ percentage point from aggregate growth in the second half of 2018. Hopefully normal seasonal conditions will return in time for the winter crop this year.
Dwelling investment (residential construction) is at a historically high level. The recent flow of building approvals implies a much lower level of activity once the current pipeline of activity is completed. Which leads me onto the housing market.
The supply/demand dynamics are playing out in the housing market at the moment.[7] There have been large falls in house prices in Sydney and Melbourne over the past year or so, following very large increases in the preceding five years (Graph 8). There is more supply to come onto the market in Melbourne and Sydney over the remainder of the year, which will further weigh on prices. One notable difference between the two cities that may affect their ability to absorb this additional supply is that the vacancy rate in Melbourne is at a very low level while that in Sydney is above average and rising. Similarly, advertised rents in Melbourne are increasing while those in Sydney are falling.
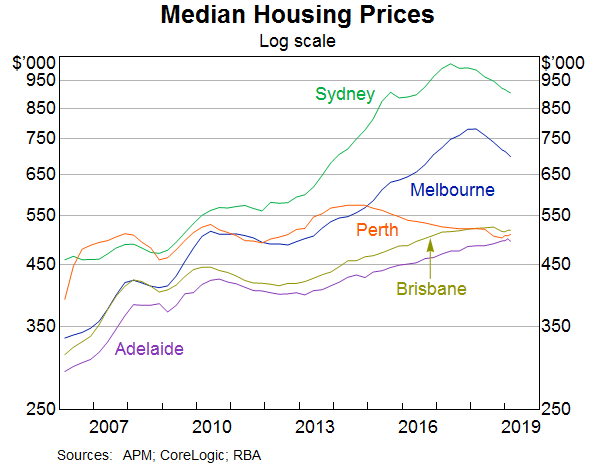
In Adelaide, the cycle has been considerably less pronounced. The median house price in Adelaide has increased a little over the past year, and has grown at an average pace of around 4 per cent per annum over the past five years. The residential construction cycle has also been considerably more muted in South Australia than in other states.
We continue to pay close attention to the housing market developments. My colleague Michele Bullock talked about the financial stability implications of the housing market in a recent speech[8] and we will shortly publish our semi-annual Financial Stability Review, which will discuss the issue in greater detail.
One of the main indicators about the impact of the unfolding dynamics in the housing market is the mortgage arrears rate. The arrears rate has been edging up but remains at a low level. Much of the increase in arrears has been in Western Australia. Negative equity (where the value of the property is less than the value of the mortgage) has also increased, though our estimates are that it also is at a low level and is again concentrated in Western Australia and mining regions.
The critical factor in the future evolution of both arrears and negative equity is whether the household with the mortgage has an income and a job. The labour market is key here and I will turn to that now.
Labour Market
At the same time as GDP has been surprisingly weak, the labour market has been surprisingly strong. The unemployment rate has declined faster than we had forecast and employment growth is stronger than we had earlier forecast.
Graph 9 shows the decline in the unemployment rate as well as the underemployment rate (which takes account of the fact that some people would like to work more hours than they currently do). The decline in the unemployment rate has been most evident in New South Wales and Victoria. In both states it is around multi-decade lows. The unemployment rate in South Australia is higher than that but lower than it is in some of the other states.
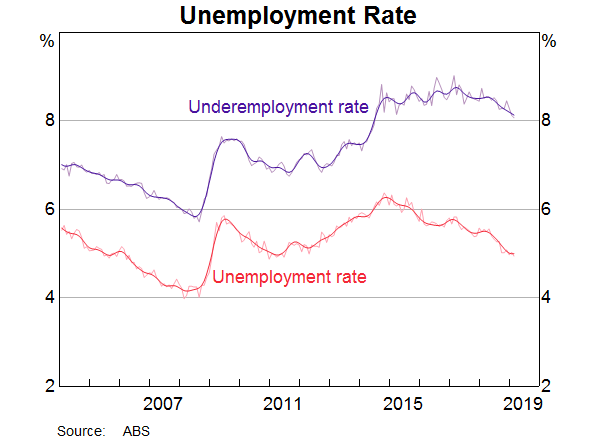
The strength of the labour market is at odds with the slow pace of GDP growth. As I said above, the labour market could be a lagging indicator. But at the same time, businesses continued to invest through the end of 2018 and have continued to hire into 2019. Why would they do this if growth in economic activity has slowed so much?
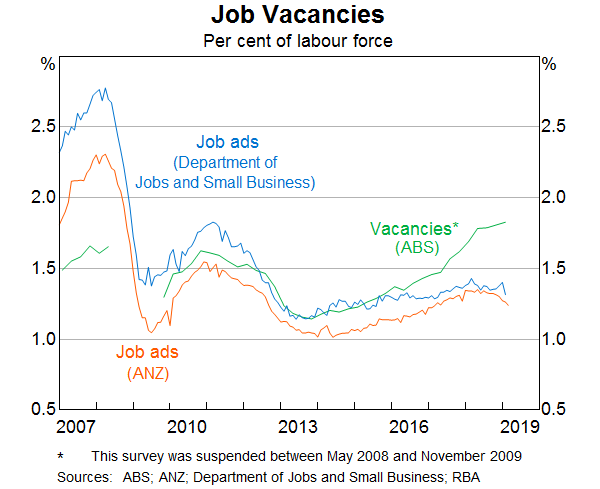
Moreover, while employment has continued to grow strongly, forward-looking indicators of labour demand suggest future employment growth will remain solid. The job advertisement series have declined somewhat recently, but the ABS vacancy series, which surveys businesses about their current level of vacancies, remains at a very high level (Graph 10).
The two lenses on economic growth provided by the labour market and the GDP data are in stark contrast. A third lens, in the form of business surveys, sits in between the two (Graph 11). Business conditions have declined from their high levels of the first half of 2018 but still remain consistent with around trend growth in the economy. This is also the sense I get from the Bank's extensive business liaison program.
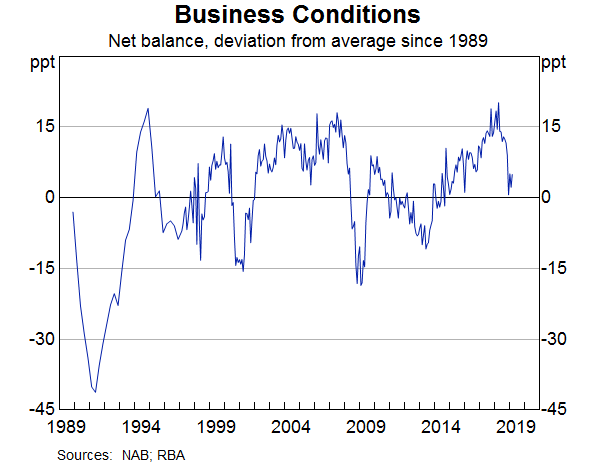
The tension highlighted by these different lenses on economic growth is of crucial importance. Hopefully we will get some resolution of this tension in the coming months with the incoming flow of data.
As the unemployment rate has declined and employment growth has remained strong, wages growth has passed its trough. But the pick-up is only gradual (Graph 12). Using disaggregated data, the small and gradual pick-up in the Wage Price Index can be explained by a decrease in the prevalence of wage freezes.[9] The share of workers experiencing wage freezes has declined. As they move off wage freezes, these workers are getting wage increases of a bit above 3 per cent. Those workers who had been getting 2–3 per cent wage outcomes have generally not been receiving higher wage outcomes lately.
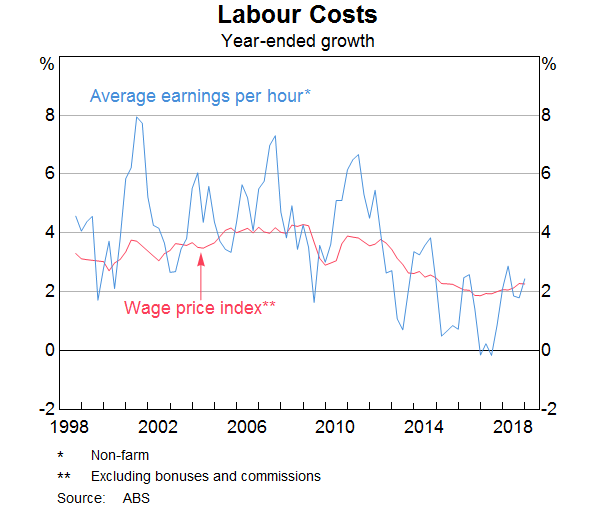
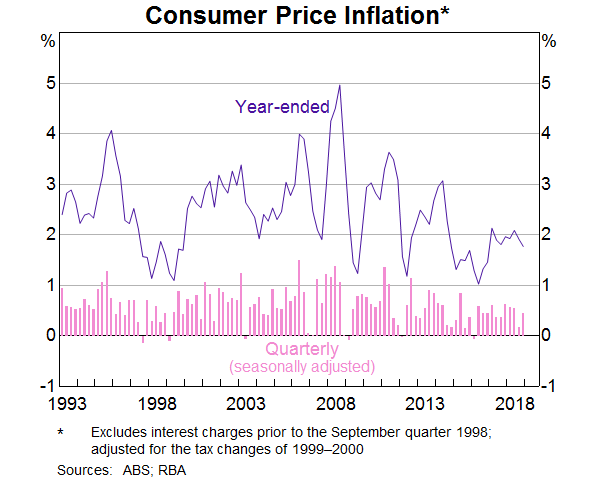
This low rate of wages growth has been a major contributor to the rate of inflation remaining a little below the inflation target in recent years (Graph 13). For inflation to rise to be sustainably within the inflation target range of 2–3 per cent, we need to see higher wages growth. We will get a read on the March quarter Consumer Price Index in a few weeks' time.
Conclusion
I have highlighted some of the issues and tension both globally and domestically around the economic outlook. Globally, the effectiveness and extent of the stimulus measures in China in addressing the slowdown in Chinese growth is one of the key uncertainties. Trade developments is another.
Domestically, I have highlighted the challenge in determining the current and future pace of growth in the economy posed by the conflicting signals provided by the labour market, the GDP data and the business surveys. How those tensions are resolved will play a critical role in whether we continue to make satisfactory progress in achieving the goals of full employment and the inflation target.
Endnotes
Thanks very much to Angus Moore for his help. [*]
That said, the decline in external demand must originate somewhere. [1]
Rennison J and R Wigglesworth (2019), ‘Has the yield curve predicted the next US downturn?’, FT.com site, 4 April. Available at < https://www.ft.com/content/cf9eb29a-5220-11e9-9c76-bf4a0ce37d49>. [2]
See May D, G Nodari and D Rees (2019), ‘Wealth and Consumption’, RBA Bulletin, March. Available at <https://www.rba.gov.au/publications/bulletin/2019/mar/wealth-and-consumption.html>. [3]
Though this doesn't explain why the slowdown was so marked in the second half of 2018. [4]
See Lowe P (2019), ‘Opening Statement to the House of Representatives Standing Committee on Economics’, Sydney, 22 February and Lowe P (2019), ‘The Housing Market and the Economy’, Address to the AFR Business Summit, Sydney, 6 March. [5]
L Ellis (2019), ‘What’s Up (and Down) With Households', Address to Housing Industry Association Industry Outlook Breakfast, Sydney, 26 March. [6]
The Governor covered the housing market in detail in a speech last month: Lowe P (2019), ‘The Housing Market and the Economy’, Address to the AFR Business Summit, Sydney, 6 March. [7]
Bullock M (2019), ‘Property, Debt and Financial Stability’, Urban Development Institute of Australia (WA), Perth, 20 March. [8]
For another factor see H Leal (2019), ‘Firm-level Insights into Skills Shortages and Wages Growth’, RBA Bulletin, March. Available at <https://www.rba.gov.au/publications/bulletin/2019/mar/firm-level-insights-into-skills-shortages-and-wages-growth.html>. [9]