Speech Housing and the Economy

Guy Debelle[*]
Deputy Governor
Address at the CFA Societies Australia Investment Conference
Sydney –
The housing market has a pervasive impact on the Australian economy. It is the popular topic of any number of conversations around barbeques and dinner tables. It generates reams of newspaper stories and reality TV shows. You could be forgiven for thinking that the housing market is the Australian economy.[1] That clearly is not the case. But at the same time, developments in the housing market, both the established market and housing construction, have a broader impact than the simple numbers would suggest.
This has been known for a long time, but often housing cycles have occurred simultaneously with other events. For example, the housing downturn in the early 1990s occurred at the same time as the 90s recession. As a result, it can be difficult to fully isolate the direct effect of the housing market itself from the other forces at work. We have models which go some way towards doing this, but they also tend to suffer from the problem of disentangling the various factors.
Over the past few years, the housing cycles have moved in different directions, and varied quite considerably around the country. The construction and price cycles are clearly highly interconnected. Both reflect the standard economic forces of supply and demand. Both cycles often move in sync, but this time they aren't. So this current cycle presents the possibility to more clearly understand the differing effects of the housing construction cycle and the housing price cycle. The large variation in both cycles across cities round the country also means that we can separate out the effect of some macroeconomic factors which are common across the country and hence shouldn't be a driver of the differences across states. In particular, interest rates have been the same across the country.
Today I am going to discuss the evolution of the housing market and its effect on the economy. Some of the channels of transmission have occurred as expected, some have been more unexpected.
I will first talk about the construction cycle, then the price cycle. Following that I will examine how each of these two cycles has spilled over to activity and inflation in the broader economy. Finally, I will focus on developments on the lending side.
Construction Cycle
The housing construction cycle in Australia clearly turned down at the end of last year. That brought to an end a long upswing at the national level that started in 2012. This downturn in the housing sector was not preceded by rising interest rates. This makes it a particularly unusual cycle because nearly every housing cycle in the past was preceded by rising interest rates. This time around, the dynamics of supply and demand have been paramount.
The cycle started following a pick-up in population growth in the mid 2000s that was, by and large, unexpected. It took a while for construction (the supply side) to respond to this increase in demand. It started to do so around 2012, when there was a solid upswing for the next four years.[2]
One factor contributing to the slow response of supply was the historically high share of high and medium density housing. Graph 1 shows that currently there is almost as much investment spending on higher-density dwellings as detached houses. But this equal spending translates into 2½ higher-density apartments being built for every detached house at the moment.
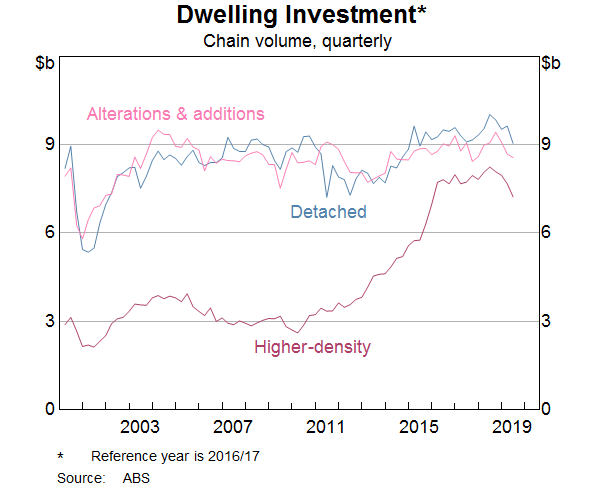
The lead time for high-density construction is long. A higher-density development also requires more certainty around demand before going ahead given the developer is trying to sell more dwellings at the same time. That is relevant for the pre-sale financing too. And then, once construction is actually underway, it takes about two years to build higher-density housing compared with around nine months for a detached house.
The greater share of higher-density means the construction response to changes in demand is probably slower on the way up and on the way down, as higher-density is harder to stop once it's underway. Detached housing construction is generally more flexible than higher-density construction, though in Sydney and Melbourne, the higher-density and detached housing construction are in very different parts of the cities.
The construction cycle has been mostly an east coast story, particularly (greater) Melbourne and Sydney. Western Australia has also had its own construction cycle, which was very much driven by the resources boom. The WA cycle shows the importance of incomes and population dynamics in driving the construction and price cycles. The resource investment boom saw a marked change in the population dynamics in WA. Population growth picked up from 1.1 per cent in 2002 to 3½ per cent at its peak in 2008. Incomes also grew very strongly with the resources boom. The construction response again followed with a lag. But the strong inward migration turned to outward migration once the resources cycle turned and incomes declined too. Housing construction continued past the turn in the cycle, contributing to the price dynamics that I will come to shortly.[3]
One reason for highlighting the differences in construction cycles between the east and the west coast is to illustrate the point that these differences occurred across the country despite the same interest rate prevailing. This means that it is not just interest rates that matter for housing. Other fundamentals such as population growth, incomes and lags on the supply side were important drivers of the construction and price cycles. That said, interest rates do play an important role; the cost of finance is an important consideration.[4]
Residential construction grew from 2012 to be 6 per cent of GDP at the beginning of 2016 and stayed around there for the next three years. This was its highest share of the economy since 2006. While the supply response to the increase in population growth in the mid 2000s took some time, in the end it did come. The increase in supply has worked to address the increased demand. Hence it is not surprising to the see construction activity decline, particularly when it is combined with a decline in demand from foreigners, as well as from domestic investors in a market where prices were falling and facing tighter credit conditions.
Since September 2018, residential construction activity has declined by 9 per cent. The decline has been broad-based across detached and higher-density housing, as well as spending on renovations (alterations and additions in national accounts terminology). Nevertheless, the pipeline of work to be done remains at a high level, particularly for higher-density projects in New South Wales and Victoria, though it has declined in most states (Graph 2).
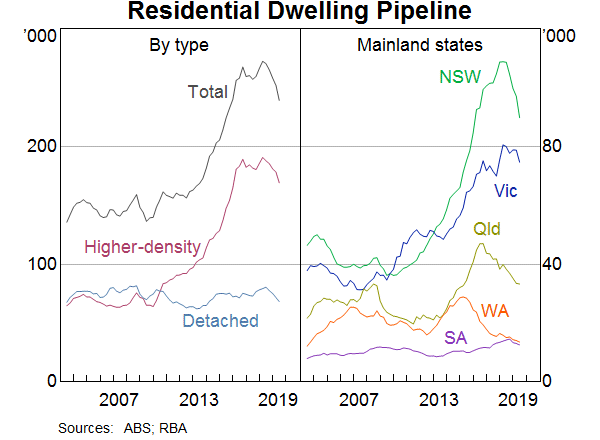
Given the large size of the pipeline, we had expected construction activity to remain at a pretty high level for most of this year, but it turned down sooner and by more than we had expected. The fall has been larger in higher-density than in detached, but still sizeable in each. Even so, much of the downturn in construction activity is still ahead. Building approvals are around 40 per cent lower than their peak in late 2017 (Graph 3).
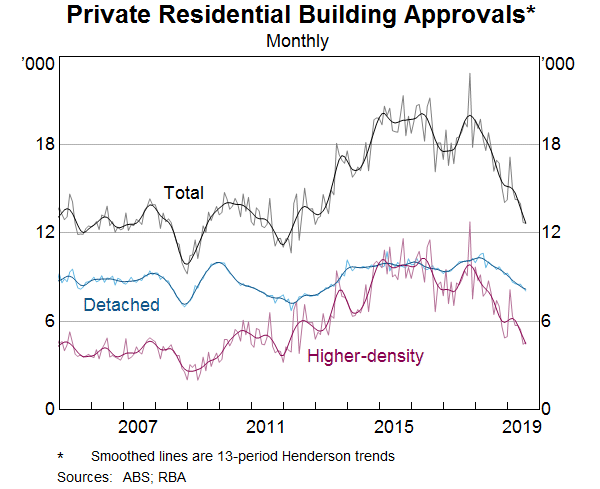
We are forecasting a further 7 per cent decline in dwelling investment over the next year, and there is some risk the decline could be even larger. This will directly subtract around 1 percentage point from GDP growth from peak to trough, given that dwelling investment accounts for around 6 per cent of GDP.
The effect of the downturn in housing construction on the broader economy, though, is likely to be somewhat larger than 1 percentage point given the linkages the sector has with other parts of the economy. For example, the residential construction sector has linkages to the business services sector through architects, draftspeople and construction engineers, and to the manufacturing sector through steel, bricks, etc. The residential construction sector itself accounts for around 2 per cent of total employment. But when we look more broadly, just under 6 per cent of employment is closely related to the residential construction sector (Table 1).
|
Share of Total Employment;
2016/17 (per cent) |
|
|---|---|
| Residential construction | 2.0 |
| Construction services | 1.0 |
| Manufacturing | 0.8 |
| Distribution | 0.6 |
| Business services | 0.6 |
| Household services | 0.3 |
| Other | 0.3 |
| Total | 5.8 |
|
Sources: ABS; RBA |
|
As the residential construction sector downturn continues over the next year, the impact will be felt in these sectors too. However, before this comes across as too gloomy, there are a number of mitigants. Firstly, depending on the skills they have, a number of these workers can shift to the non-residential construction sector where activity is at a high level and is likely to remain so in the period ahead. This includes the high level of infrastructure spending, but is not limited to that.
Secondly, while there is a significant downturn in prospect over the next year or so, some of our liaison contacts in the construction sector have said that they can see through the trough in activity to the other side. While the increase in supply has finally met the earlier increase in demand, demand will continue to grow given population growth but supply is going to decline. So there is quite likely to be a shortfall again in the foreseeable future. Hence some large developers tell us that they are prepared to retain their employees through the coming trough in activity. That said, the outlook for smaller contractors, which are quite prevalent in the housing sector, is not so great in the period ahead.
Price Cycle
I will now turn to the housing price cycle, which is mostly about the established market. Around 70 per cent of housing sales are from the existing housing stock. Even in the peak of the construction cycle last year and at a time when the number of sales in the established market was declining, at most 50 per cent of turnover came from newly built housing.
Clearly, the established and the newly built market are closely related. They are linked by the unavoidable fact that everyone has to live somewhere.[5] That is a fundamental force in the housing market that always needs to be kept in mind. How many people live in each dwelling can change, but that is generally slow moving. It is affected by social forces that influence average household size as well as economic forces like prices, rents and income.
The housing price cycle has also turned, but in the opposite way to the construction cycle (Graph 4). Again the picture is very different across the states. It also differs across cities within states, and even across suburbs within cities. A large part of these differences reflect different population dynamics, particularly migration flows. In turn, that also reflects differences in employment and income as well as differences in the cost of housing.
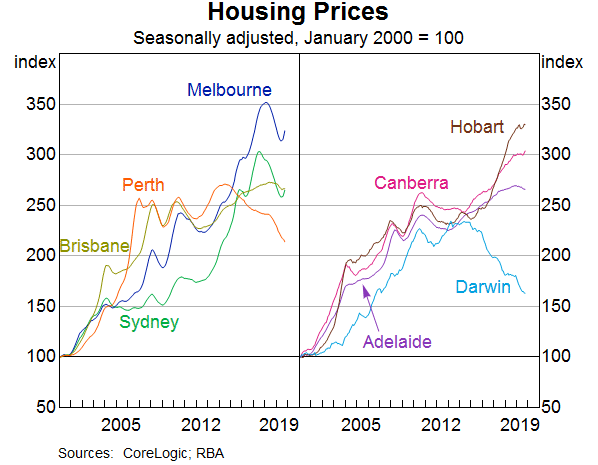
The price cycles in Sydney and Melbourne reflected similar dynamics to the construction cycle I talked about earlier. There was a large increase in demand, which outpaced the increase in supply. Some part of the increase in demand was a result of lower interest rates, but there were clearly other factors such as population growth and foreign demand. Those factors played out differently across the different cities, contributing to the difference in price dynamics. But again, it is worth remembering that the same interest rate applied across all of the cities across the country throughout their considerably different price cycles. This has particularly been the case over the past decade. This is in contrast to the cycle from the mid 1990s to the mid 2000s, which was more uniform and more clearly related to the shift down in the nominal interest rate structure.
The cycles in Melbourne and Sydney have been particularly stark. Prices in those cities increased by 58 and 75 per cent, respectively, from 2012 to 2017. Prices turned down in 2017. Again, this was not a result of rising interest rates. To a large degree, the cycle was likely to turn given the large run-up in prices, although the exact timing of this was hard to predict. The increase in the supply of new housing also contributed, as did the decline in foreign demand. The tightening in lending standards that occurred from around 2014 also played a role.[6] Once prices started to turn down, investors pulled back, not being willing to buy into a falling market. This further contributed to the downward pressure on prices. Prices declined by 11 and 15 per cent in Melbourne and Sydney, respectively.
Over the past few months, the cycle has turned again in Melbourne and Sydney. This has coincided with the lower cash rate and mortgage rates, as well as APRA's recent changes to the interest rate threshold. In addition, it is possible that prices had fallen far enough to rekindle some demand.
At the same time, housing prices in Perth and Darwin have continued to decline. Lower interest rates have not been enough to outweigh the impact of other drivers of housing prices in those two regions including sharply lower population growth. Conditions in other cities have been more subdued, both on the way up and on the way down.
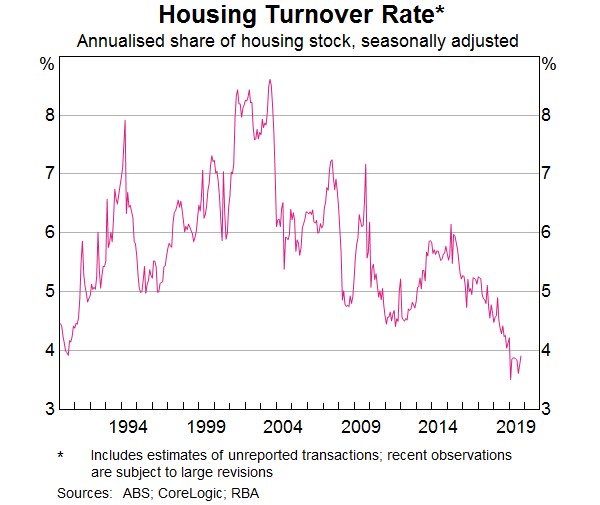
Turnover in the housing market declined to historically low levels earlier in the year, and has only just begun to rise off those lows despite the turnaround in the price cycle. Turnover fell to the lowest it has been as a share of the housing stock in more than three decades (Graph 5). This low turnover has had a number of macroeconomic impacts, which I will come to shortly.
Before that, I will briefly discuss negative equity (this is covered in more detail in the recent Financial Stability Review). Falling housing prices heighten concerns about negative equity. Negative equity is not necessarily a problem in and of itself, although households would have preferred not to have bought at the peak of the market. Rather, negative equity increases the vulnerability of those households should they encounter problems in managing their mortgage, particularly if they were to lose their job.
We estimate that around 3¾ per cent of mortgage balances (by value) are in negative equity. This is up from around 2 per cent a year ago. Over half of these mortgages are in WA and NT, where a little under one-fifth of balances are in negative equity. While this is clearly of concern for those households in negative equity, loans in these areas account for less than 2½ per cent of mortgage balances in Australia.
Other Spillovers to the Economy
Earlier I talked about the direct effect of the downturn in residential construction on the economy and some of the spillovers to other parts of the economy including through employment. Part of this has been reflected in the decline in income for small business, which is evident in the national accounts. Gross mixed income, which is primarily small business income, declined by 3.8 per cent over the past year. Some part of this is lower incomes in the farm sector from the impact of the drought, but a sizeable part is low income growth from contractors in the residential construction sector. This has contributed to the overall historically low growth in household incomes and thereby to the lower growth in consumption. Growth in disposable income slowed from 4 per cent at the end of 2017 to 2 per cent by the end of 2018. We estimate that this explains around half of the recent slowing in consumption.
The decline in housing prices has also led to a fall in household wealth. Our standard estimate of the wealth effect is that a 10 per cent fall in housing prices leads to a 1½ per cent fall in household consumption over time.[7] Given the decline in housing prices that has occurred, we estimate this accounted for the other half of the recent slowdown in consumption growth.
As Graph 5 shows, the fall in housing prices has been accompanied by very low housing turnover. So some part of the ‘wealth effect’ is likely to be related to the (unsurprising) fact that when people move house they tend to buy a lot of household goods like furniture at the same time. In the past, housing prices and turnover have moved in lock step so it has been difficult to determine the impact of each channel. But with prices starting to grow again now, but turnover so far only picking up a little from its lows, we may get a better sense of which has been the bigger drag on consumption – wealth or turnover – and hence what the outlook for consumption might be now the housing price cycle has turned.
The fall in housing prices and turnover has also reduced stamp duty revenue for state governments.[8] But by and large this hasn't resulted in state governments changing their expenditure plans materially, so this hasn't had a procyclical impact.
A related effect on measured GDP growth has been the effect of the decline in turnover on an item in the national accounts called ‘ownership transfer costs’. This little-known part of the accounts measures costs involved with transferring properties such as stamp duties and fees paid to real estate agents and lawyers. Spending on these costs declined by more than 20 per cent over the year to the March quarter and reduced aggregate GDP growth by around 0.4 percentage points. We had not fully taken account of this in our forecasts of GDP and it is part of the explanation of why GDP growth has turned out to be slower than we had expected.
Inflation Impact
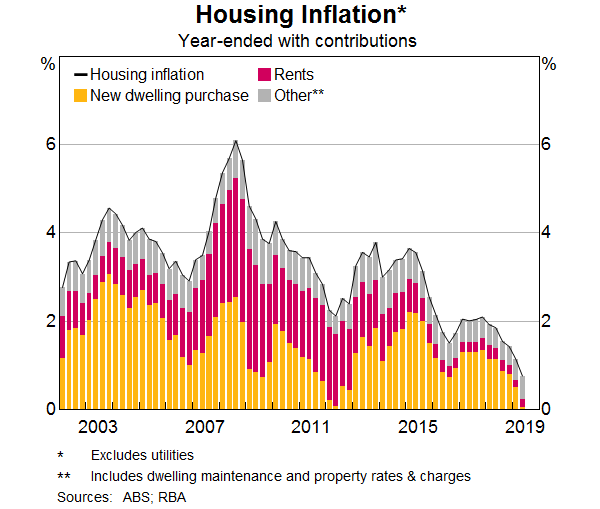
One other area where the spillover from housing to the rest of the economy has been larger than we had expected is its impact on inflation (Graph 6). The two largest housing-related components of the CPI basket are rents and new dwelling purchases by owner-occupiers, which together account for around one-sixth of the CPI basket. (Note that established housing prices are not directly in the CPI.) Inflation in these components is around historical lows, reflecting the conditions in the housing market.
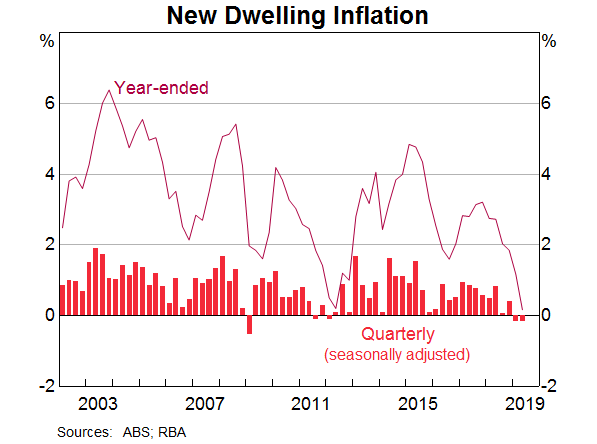
Since 2017, the new dwelling purchase component of the CPI has reflected the cost of building higher-density housing as well as the price of newly built detached housing (prior to that it excluded the cost of higher-density housing) (Graph 7). Surprisingly, despite activity in the housing sector being around historical highs in 2017 and 2018, there was not much pressure on building costs. So inflation from this source was contained. More recently, as the construction cycle has turned down and as demand for new housing has declined significantly, developers have been offering discounts. These haven't been so much in the form of price discounts but rather in the form of add-ons such as a new kitchen, a better fitout etc. Developers do this to limit the spillover of lower prices to other potential sales. The ABS treats these in-kind discounts as quality improvements, which translate into a material reduction in the cost of detached housing in the CPI.
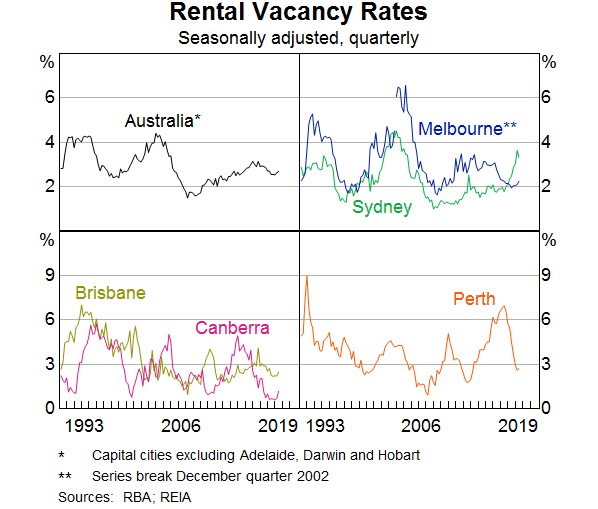
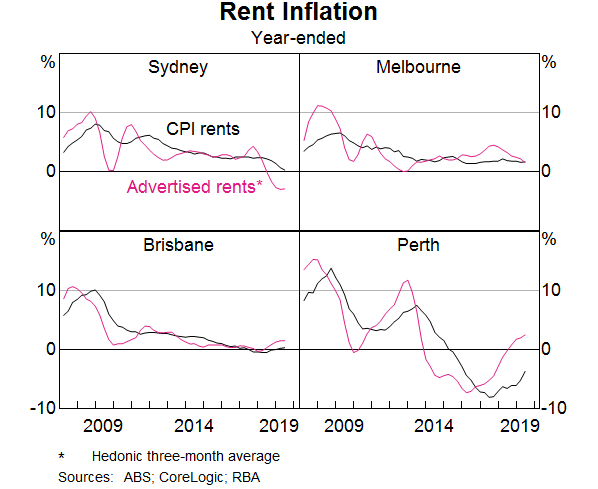
On the rental side, the large additions to the stock of housing, and particularly higher-density housing, have had an impact on rents, particularly in Sydney, where the rental vacancy rate rose sharply to be at its highest in 16 years in June (Graph 8). Consequently, advertised rents are declining, and the rental inflation component in the CPI, which captures existing rents, is close to zero for Sydney (Graph 9). The vacancy rate in Melbourne has remained low as the substantial increase in new housing supply has been largely absorbed by strong population growth. Hence rental inflation in Melbourne has remained around 2 per cent. In contrast, Perth rents have fallen by 22 per cent since 2014, although the pace of decline has eased gradually, as newly advertised rents have increased and the vacancy rate has begun to decline.
Lending Conditions
Finally, it is important to look at lending conditions and credit growth and how that has interacted with the construction and housing price cycles. My main argument is that the slowdown in housing credit growth to households has primarily reflected the housing cycle rather than driven it. That is, the slowdown in credit growth is primarily a demand story rather than a supply story.
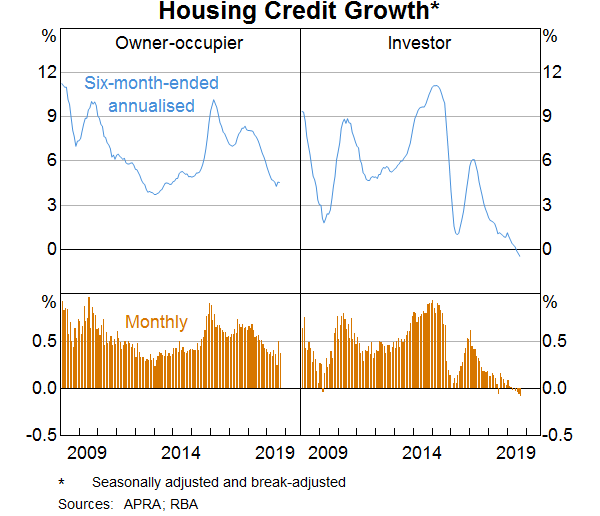
I talked about this last November. At the time I said I didn't see much sign of a credit crunch.[9] And with the benefit of hindsight I would stand by much of that assessment. Yes, there was a tightening in lending standards from 2014 onwards. But through the first part of this, housing lending continued to grow at a fast pace. There was some further tightening over 2018 following the Royal Commission, mostly through stronger enforcement of existing policies. But the bulk of the tightening had preceded that. Credit growth started to slow materially in mid 2017 (Graph 10). Investor demand has slowed to such an extent that the stock of outstanding credit to investors has actually fallen in recent months. In my view this is primarily a decrease in investor demand given falling housing prices, more than the impact of tighter lending conditions.
Throughout, competition for high-quality borrowers with standard loan applications has remained strong. In the end, it is difficult to separate the effect of demand and supply, but this strong competition suggests there is more of a demand than a supply story.
We are seeing a number of borrowers taking advantage of this competition by refinancing to lower rates. This, along with continued switching from interest only to principal and interest loans, amounts to a reduction in variable mortgage rates paid of around a basis point per month. There is still plenty of scope for more of this to occur, given that the interest rate on a new loan is some 30 basis points below the average outstanding rate for owner-occupiers.[10]
This brings me to the question of what will happen now that mortgage rates have declined. Following the recent 75 basis point reduction in the cash rate, on average, variable mortgage rates have declined by around 60 basis points.
Interest rates are historically low. Will we see a material increase in borrowing as a result? While turnover in the housing market remains low, credit growth is likely to remain low, even as prices pick up. Households may be more conservative in their willingness to borrow given low income growth. Lenders are applying tighter standards than in the past. Both of these may well combine to result in a more muted pick-up in lending than in the past.
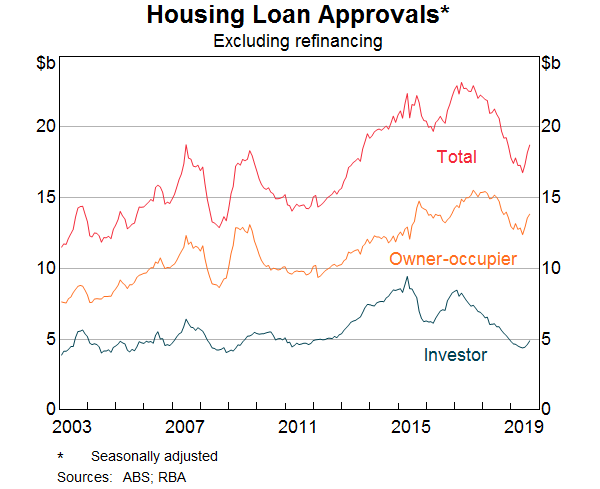
Loan approvals have begun to rise but we have yet to see this flow through to a pick-up in housing credit growth (Graph 11), which has remained at historically low rates for both owner-occupiers and particularly investors. One issue that we are closely monitoring is the extent to which households choose to take advantage of lower interest rates to pay down their mortgages faster. This would be evident in an increase in loan approvals that is not accompanied by an increase in credit growth.
While I believe that the slowdown in housing credit is more a result of weaker demand than tighter supply, I said last November ‘the effect of a tightening in lending to developers seems to me to be a higher risk to the economic outlook than the direct effect of the tighter lending standards on households, which has ameliorated risk. Relatedly, there may also be a bigger impact on lending to small business given the extensive use of property as collateral for small business loans.’ This still is very much the case nearly twelve months on.
Conclusion
Let me now bring this together. There is a sizeable downturn in construction underway. Contacts in the Bank's liaison program indicate that demand for new houses and apartments has remained around the low levels of late 2018. The typical lags between the sale and construction of new dwellings imply that the decline in dwelling investment will continue for some time, despite the recent signs of stabilisation in the established housing market. I have highlighted that the effect on the economy is greater than the direct effect of the decline in construction, with significant spillovers to other parts of the economy and also inflation.
2020 looks like being the low year for the residential construction sector. But we can see through the trough to the other side. Demand is still continuing to increase given population growth. While there are pockets of oversupply, particularly in parts of Sydney where the vacancy rate is high, they are not widespread. Prices have turned in Melbourne and Sydney (though not Perth or Darwin), which probably brings the investor back into the market.
The long lead times on higher-density construction mean the supply response is likely to be slow. The tight conditions on lending to developers may mean it is even more protracted. The growth in demand without a meaningful supply response will lead to a larger price response. From a financial stability perspective that is not so much an issue if it is not accompanied by a material expansion in borrowing. Housing price increases clearly have a distributional impact, but monetary policy is not well placed to address that.
Monetary policy is concerned about aggregate outcomes for inflation and unemployment. In that regard, unemployment is a little higher than it was at the beginning of the year, and there has not been much upward pressure on wages. In turn, this has contributed to the extended run of inflation outcomes below the medium-term target range. As a result, the Board has decided to ease monetary policy in recent months. These actions take account of the expected evolution of the housing cycle that I have talked about today. With these actions, we are seeking to make more assured progress towards both full employment and the inflation target.
Endnotes
Thanks to Kate McLoughlin and Penny Smith for their input. [*]
This is not purely an Australian story. See Leamer E (2007), ‘Housing IS the Business Cycle’, National Bureau of Economic Research Working Paper 13428. [1]
For a full exposition, see Lowe P (2019), ‘The Housing Market and the Economy’, Address to the AFR Business Summit, Sydney, 6 March. [2]
At the same time, in my home town of Adelaide, there hasn't been much of a cycle at all right through this period. [3]
Saunders T and P Tulip (2019), ‘A Model of the Australian Housing Market’, RBA Research Discussion Paper 2019-01. [4]
That said, more than 110,000 people were estimated to be homeless on Census night in 2016. [5]
RBA (2018), ‘Assessing the Effects of Housing Lending Policy Measures’, Financial Stability Review, October, pp 75–88. [6]
May D, G Nodari and D Rees (2019), ‘Wealth and Consumption’, RBA Bulletin, March, viewed [14 October 2019]. Available at <https://www.rba.gov.au/publications/bulletin/2019/mar/wealth-and-consumption.html>. [7]
There are also effects on capital gains tax revenues. [8]
Debelle G (2018), ‘Assessing the Effects of Housing Lending Policy Measures’, Remarks at FINSIA Signature Event: The Regulators, Melbourne, 15 November. [9]
Some of this difference reflects differing borrower characteristics. But for a significant number of borrowers there is the opportunity to refinance at a lower rate or put pressure on your existing lender to lower your mortgage rate. [10]