Speech Beware False Prophets

Andrew Hauser[*]
Deputy Governor
Speech to the Economic Society of Australia (Queensland)
Brisbane –
Introduction
My theme today is learning and the role it plays in monetary policymaking.[1]
So it is fitting that I am speaking with you, on my first visit to Brisbane, just a stone’s throw from two great seats of learning – the Queensland University of Technology (QUT) and the University of Queensland (UQ).
QUT’s Gardens Point campus sits on a stunning peninsula in the Brisbane River that is full of history. The Botanic Gardens started life in 1828 as a means of feeding the penal colony. And Old Government House was built in the 1860s for the first Governor of Queensland, Irishman Sir George Bowen and his wife, the tremendously-titled Contessa Diamantina di Roma (after whom the Diamantina River is named).[2]
But the history of this area, and its connection with learning, is much older than that. The river – or Maiwar as it was long known – has been a source of life for the Jagera and Turrbal Peoples for thousands of years. And the area around Gardens Point was a sacred site, where Aboriginal women received ceremonial teaching – and men were forbidden. Today QUT is establishing a new Faculty of Indigenous Knowledges and Culture to recognise and foster Indigenous Australian excellence and innovation.[3] Against that rich backdrop, I want to acknowledge the traditional owners of this land, pay my respects to their Elders past and present – and extend that respect to any Aboriginal or Torres Strait Islander peoples here today.
Head south-west down the river to St Lucia and UQ’s Great Court and look upwards, and you may see a carving of a jovial man in a hat carrying an apple. The gargoyle is said to be Dr Colin Clark – a prominent British disciple of John Maynard Keynes. Clark was recruited in the late 1930s by Queensland Premier Bill Forgan Smith to help make the case in Canberra for more expansionist state spending, and establish one of the earliest systems of national accounts. When Keynes heard that Clark intended to settle in Australia, he tried to dissuade him, arguing that he would be more influential back in England. But Clark was having none of it: Australia, he wrote, was ‘too remarkable an opportunity to be missed’; its people had ‘minds which are not closed to new truths’, and the country would ‘show the world, in economics, politics, education and technology in the next twenty years’. In what seems to have been the clincher, he noted that ‘economics ranks next after cricket as a topic of public interest’.[4]
Nearly 100 years later, I’d change little in describing my own early impressions of Australia, with one notable exception: sport quite often plays second fiddle to economics (and the RBA) on the front pages!
A vibrant public economic debate, with diverse views, is healthy. But one feature of the landscape is less desirable – and that is the extraordinary certainty with which individual views about the outlook for the economy and the path of monetary policy can sometimes be expressed. ‘The economy is falling off a cliff’; ‘No – the economy is red-hot.’ ‘Rates up now – we’re way behind the curve’; ‘Rates are clearly far too high – slash them’; ‘It’s vital rates stay where they are’. Those seeing things differently are castigated as incompetent, biased or on the make. And changes in view are presented as disastrous or humiliating failures. In short, it’s a world of winners and losers, gurus and charlatans, geniuses and buffoons. This isn’t unique to Australia of course – everywhere is prone to it in some way (witness the extraordinary calls for emergency intra-meeting rate cuts in the United States during the recent market turbulence, for example).
Of course, eye-catching language sells newspapers, secures clients and draws crowds to the soapbox. But when the stakes are so high, claiming supreme confidence or certainty over what is an intrinsically uncertain and ambiguous outlook is a dangerous game. At best, it needlessly weaponises an important but difficult process of discovery. At worst, it risks driving poor analysis and decision-making that could harm the welfare of all Australians. It is right to want to be confident that the central bank will bring inflation back to target and maintain full employment: that is the RBA’s mandate, and we should be held to account for it. But the policy strategy required to deliver that outcome, and the economic judgements that inform it, simply cannot be stated with anything like the same degree of certainty. Those pretending otherwise are false prophets.
Overconfidence is not unique to economic commentary: it’s a universal human failing.[5] In my remarks today, I want first to illustrate some real-world examples, before turning to ways in which central banks can avoid falling prey to it in our own deliberations. By forming contingent hypotheses about the future – rather than overly precise point forecasts. By learning continuously – from our own forecast errors, from diverse quantitative models, from corporate liaison and other qualitative intelligence-gathering, from experience in other countries, and from internal and external challenge, including scenarios and ‘what-ifs’. By communicating clearly and openly about what we don’t know, as well as what we do. And by adopting policy strategies that reflect risks to the outlook, as well as the central case. I will describe how some of these tools were applied in our most recent monetary policy round, and how we hope to develop them further.
Overconfidence in everyday life
To illustrate how commonly overconfidence arises in everyday life, let me pose four questions, most with a Queensland flavour. I’m keen to know both your answers, and also your confidence in those answers:
- How many paving stones cover QUT’s Gardens Point campus?
- Will it rain in Brisbane tomorrow?
- Who will win the 2025 State of Origin rugby league series?
- What will Elon Musk do next?
Question 1 provides scope for the greatest certainty, because there is a precise, knowable answer. At the same time, it’s not an easy question – few of us have intimate knowledge of the campus; fewer still are quantity surveyors or have the time to go and count them! So while we can make more or less informed guesses, we are likely to cite wide ranges of uncertainty around those guesses.
What’s striking, however, is that, while we may think the ranges we give are wide, they are actually almost always too narrow. Table 1 reports the results of an exercise in which professionals across a range of industries were asked a set of hard but factual questions like the one I’ve just posed. The column on the right shows how often people’s ranges of uncertainty are too narrow to include the true answer. So, for example, only 10 per cent of those asked to give 90 per cent confidence intervals should miss the true answer. In fact, miss rates lie between 42 and 64 per cent. People are vastly too confident about what they truly know.
| Percentage of misses | |||
|---|---|---|---|
| Industry tested | Kinds of questions used in test | Ideal (%)** | Actual (%) |
| Advertising | Industry | 10 | 61 |
| Computers | Firm | 5 | 58 |
| Data processing | Industry | 10 | 42 |
| General business | 10 | 62 | |
| Money management | Industry | 10 | 50 |
| Petroleum | Industry & firm | 50 | 79 |
| Pharmaceutical | Firm | 10 | 49 |
| Security analysis | Industry | 10 | 64 |
|
Source: Russo JE and Schoemaker PJH (2016), ‘Overconfidence’, in M Augier and D Teece (eds),
The Palgrave Encyclopedia of Strategic Management, Palgrave Macmillan, London,
p 1238. |
|||
In case you are curious, by the way, the Gardens Point campus is covered by 9,546 Urbanstone Juperana granite pavers. I know this, not because I am a paving nerd, but because the company that provided the materials is part of the RBA’s liaison program, through which we keep a close eye on real-world economic developments – and a key plank of our continuous learning process that I will elaborate on later.
Question 2 asked ‘Will it rain in Brisbane tomorrow?’. Unlike the previous question, there’s no certain answer. But we can put quite well-defined probabilities on it. History suggests that it rains on just under 20 per cent of August days (Graph 1).

But we can do better than that: the Bureau of Meteorology (BOM) uses much richer data and modelling to put the probability of rain tomorrow at a rather alarming 95 per cent (Figure 1)!
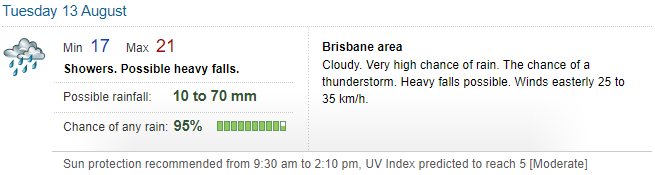
Source: BOM, ‘Brisbane Forecast’, Brisbane Forecast (bom.gov.au), as of Sunday 11 August 2024.
Unlike most of us, weather forecasters are actually quite good at estimating their uncertainty about their short-term forecasts. Even as far back as the 1970s, if they told us there was a 95 per cent chance of rain tomorrow, they were usually pretty close (Graph 2). And meteorological models have evolved enormously in sophistication and accuracy since then.[6]

At first sight, Question 3 – ‘Who will win the State of Origin rugby league series in 2025?’ – seems similar to Question 2. There are only two possible answers[7] – and probabilities seem readily available, for instance from betting markets (Graph 3). But the similarities are illusory. Today’s short-term weather forecasts are the product of advanced stochastic modelling that yields well-defined risk measures. But no model can fully capture the huge range of time-varying, ambiguous and judgemental factors that go into determining the winner of a sports series a year out. Such processes are said to be subject to ‘Knightian’ or ‘radical’ uncertainty.[8]

Even in the short gaps between this year’s games, the quoted odds bounced around like a yo-yo in response to a stream of unpredictable developments – Joseph Sua’ali’i being sent off in game 1; Latrell Mitchell’s triumphant return for NSW in game 2; and the pitched battle of game 3. Who knows on what, as-yet unimagined, events next year’s series will turn. But it seems likely that the current 60/40 odds quoted in favour of NSW reflect excessive confidence that whoever won in 2024 will win in 2025 too, rather than any clear-eyed assessment – a variant of the certainty bias.
My final question – ‘What will Elon Musk do next?’ – is a more extreme form of radical uncertainty. Key drivers of the true answer – goals, beliefs and motivations – are partly or wholly unobservable (so-called ‘latent’ variables). And the range of possible answers is unbounded. Anyone claiming to have identified a small number of well-defined outcomes, each with a clean probability, is at best ambitious – and, at worst, at risk of seriously overestimating their true confidence levels.
Tackling uncertainty and overconfidence in central banking
So what, then, for monetary policymaking?
When we set interest rates, we have to look ahead – that is, make forecasts.[9] That’s one source of uncertainty. Monetary policy works with long and variable lags – so our forecasts have to be medium-term, not short-term. That’s a second source of uncertainty. And most importantly of all, the things we are forecasting – inflation and unemployment – are the complex, time-varying outcomes of the decisions and interactions between many millions of people, companies and other organisations.
That puts us squarely in the world of Knightian uncertainty – of the State of Origin or Elon Musk. Unfortunately, most of the models used for economic analysis come from the worlds of paving stones and tomorrow’s weather! Estimate the average historical relationship between individual economic variables, run those relationships forward in time – and you get a set of deterministic point-estimate forecasts. Such model-based forecasts help show how the economy might respond if relationships remained exactly as they were in the past. But over-reliance on them has two key drawbacks:
- First, the probability of such paths being precisely correct is essentially zero. That makes them a poor basis for decision-making when used in isolation – because the absence of alternatives or fallbacks makes it harder to conceptualise other possible outcomes and weigh up the likelihood of those alternatives becoming reality. And that, in turn, can force forecasters either to underreact to news (forcing the data into their existing narrative, rather than learning) or to overreact (jettisoning one point-forecast for another demonstrably different path, which will also prove to be wrong).
- Second, although it is possible to estimate confidence intervals around point forecasts using the models themselves, they are likely to be substantially too narrow (that is, overconfident) because they fail to account for the fact that the model may simply not be the right representation of reality.[10]
So just as overconfidence can easily affect our everyday lives, it can affect monetary policymakers too. How do we guard against that?
The starting point is to avoid placing too much reliance on point forecasts in the first place, and instead frame our policy decisions in terms of contingent hypotheses or judgements. Some judgements may be strongly held, and hence given a high weight in the decision; others may be very tentative and given only a low weight. Both the hypotheses, and the weights attached to them, are continuously updated through a process of learning.
To bring this to life, consider a key question in the run-up to the RBA’s most recent policy decision: why has CPI inflation been so unexpectedly persistent?
A good place to start is to ask how unexpectedly persistent inflation has actually been – that is, to learn from our own forecast errors. Such learning can be difficult for those who treat forecast ‘misses’ as failures. A more mature approach – and one long adopted by the RBA and other central banks – seeks instead to recognise that where forecasts are carefully constructed to make the best use of current data, ‘misses’ contain vital information about an intrinsically complex and stochastic world. This idea is also embedded in the ‘fancharts’ shown around the RBA’s outlook for inflation and other variables, which are calibrated using past forecast errors, not mechanical model outputs.[11]
Three key facts emerge when we look at the recent path of forecast errors for inflation. First, although underlying inflation for the June 2024 quarter was broadly in line with our May forecast, inflation in earlier periods in 2023–2024 proved somewhat stickier than we had expected (Graph 4).

Second, the pattern for market expectations (derived from inflation swaps) has been somewhat similar, suggesting the upside surprises have not been limited to the RBA (Graph 5).[12]

Third, some other jurisdictions have seen a rather greater incidence of inflation undershoots in recent quarters, raising the possibility that something slightly different might be underway in Australia. Graph 6, for example, shows the picture for the euro zone.[13]

To understand why past inflation outcomes may have been stronger than expected requires a hypothesis. In such circumstances, the economist’s reflex is to reach for a model: often some variant of a Phillips Curve, in which higher inflation reflects some combination of (a) higher expected inflation, (b) higher demand, and (c) lower supply capacity. There is no evidence that longer term inflation expectations rose over this period in Australia. And GDP came in at or below forecast – which we tentatively assume is informative about demand conditions. We have therefore placed some weight on the possibility that past upside inflation surprises may have reflected somewhat weaker supply than previously thought.
Now, it is one thing to hypothesise weaker supply, it is another to quantify it. And that’s because supply is not directly observable: it is a classic latent variable.[14] So any estimate is subject to huge uncertainty. In the most recent monetary policy round, RBA staff approached this challenge in two ways.
The first was to use a range of alternative models that posit different assumptions about the structure of the economy to estimate supply.[15] It is common practice to transform the results of such models into estimates of ‘spare capacity’ in either the labour or product markets. Graph 7 shows the range of spare capacity estimates for unemployment implied by the range of models.[16] Choosing a single path within this range is subject to the very objections to point estimates that I just rehearsed. But to rationalise recent above-forecast inflation outcomes, the August 2024 Statement on Monetary Policy (SMP) assumes that supply was somewhat weaker, and hence the labour market was somewhat tighter, than previously thought.[17] And that extra weakness is assumed to persist, pushing up a little on the outlook for inflation. It must be said, however, that these changes in assumptions are tiny relative to the huge true range of uncertainty over these measures. So we have to be humble about our confidence in this judgement: spare capacity could easily be much higher, or much lower.[18]

As a second cross-check, staff also compared their estimates to qualitative real-world indicators of capacity pressures from company surveys and the RBA’s liaison program.[19] Graph 8 shows that such measures lie at or above the upper end of our model-based estimates. That is also consistent with the messages of persistently elevated cost pressures I have personally heard from liaison visits to Townsville, Perth, Adelaide, Melbourne, Western and central Sydney in recent months.

Future inflation also depends on the outlook for demand – and here too we must guard against the risk of overconfidence. In the latest SMP, we do so in part by considering alternative scenarios, drawing on lessons from overseas (particularly important for open economies such as Australia) and the potential for, potentially sharp, changes in behaviour.
One scenario asks whether the unemployment rate may be about to pick up more rapidly than assumed, pulling down on demand and reducing inflationary pressure.[20] In the central projection, employment growth only falls modestly, with total hours worked in the economy continuing to rise as the population and participation in the labour market grow. That is consistent with past downturns in activity of similar magnitude (Graph 9).

But those assumptions could be wrong. What if unemployment rises more rapidly, as it has for example in Canada, Sweden and New Zealand (Graph 10)? Concerns that something similar might be about to happen in the United States caused last week’s sharp repricing in US rate expectations.

Graph 11 illustrates that a higher unemployment path would bring inflation back to the midpoint of the target range more rapidly, more than offsetting the higher inflation persistence assumed in the central case.

We also conducted a scenario exercise for household consumption.[21] Judgements about consumption are particularly important for the inflation forecast, because consumption accounts for roughly half of total Australian demand. Assuming that unemployment rises only gradually, the central projection is for consumption growth to pick up in line with an expected recovery in household real incomes (Graph 12).

The drivers of the pick-up in incomes are relatively clear, barring further shocks. But consumption also depends on the extent to which households choose to spend or save these higher incomes – and we are much less confident in that judgement.
It is possible, for example, that households fortunate enough to have accumulated assets in recent years may choose to spend rather more than past relationships suggest. Aggregate net wealth in the household sector has increased by 58 per cent in the past five years (Graph 13) – much more than incomes. That could pose upside risks to consumption.

At the same time, other households, particularly the young, have been forced to cut their spending back sharply as real incomes have fallen (Graph 14). Higher future real incomes may relax some of those constraints, allowing such households to increase their spending by more than historical relationships would suggest. But it is also possible that persistent uncertainty about the future may cause them to rebuild savings or pay down debt, posing downside risks to consumption.

These two-sided uncertainties about future saving behaviour are captured in two stylised profiles. One assumes that the saving ratio remains close to its relatively low current level; the other assumes it picks up to around its longer term historical average (Graph 15).

As with the other judgements, it is notable that quite small differences in this assumption – well within historical ranges – produce materially different outcomes for inflation and unemployment (Graph 16).

Policy implications and conclusions
Let me conclude.
As humans, we are all prone to overconfidence, particularly when forecasting the future. In many cases, the answer we ought to give is that we simply do not know. But it can be hard to say that, particularly if your job is to give a view, and particularly where even small changes in judgement can have first-order effects on people’s lives.
Central bankers, and those who comment on us, are no exception to this universal human trait. In my remarks today, I have set out some of the ways in which we can try to lean against overconfidence without falling into the opposite trap of saying nothing at all. By avoiding over-reliance on point estimates and instead framing our assessments in terms of contingent hypotheses. By continually adjusting the weights we place on those hypotheses through a process of learning – from our own forecast errors, from a wide range of analytical models, from qualitative data and intelligence, from other countries, and through what-ifs and scenarios. And by communicating openly and honestly about where we are relatively confident about the outlook (and where we are not), where we are seeking to learn, and the balance of risks. Many of these tools are already in use at the Reserve Bank – and we will move further in that direction as we complete the implementation of the RBA Review recommendations.
Of course the billion dollar question is how to map essentially uncertain judgements into policy decisions. That is really the subject for another speech – but the short answer is one should seek to choose strategies that are responsive to, and also robust to, your evaluation of the risks to the outlook as much as to the central projection. In some cases, uncertainty may induce you to be less activist – as you wait for more data, or try to avoid triggering tail risks through your own actions. In others, it can induce you to be more activist: for example, the asymmetry of potential outcomes underpinned the policy response in many countries during the COVID-19 pandemic.
But beware anyone who claims it is obvious what to do – for they are false prophets!
Endnotes
I am very grateful to Alex Baker, Alex Ballantyne, Michelle Bergmann, Michele Bullock, Natasha Cassidy, Selwyn Cornish, Ryan Couston, Stephen Cupper, Tom Cusbert, Amelia Dakin, Iris Day, Anthony Dickman, Boston Dobie, Jacqui Dwyer, Rachael Fitzpatrick, Bowen Hao, James Holloway, Jessica Hua, Callum Hudson, Sarah Hunter, Ben Jackman, Brad Jones, Chris Kent, Liam La, Kevin Lane, Jeremy Lawson, Virginia MacDonald, Kieran MacGibbon, Martin McCarthy, Alexandra Michielsen, Marcus Miller, Patrick Parrish, Mick Plumb, Max Prakoso, Avinash Rajan, Ravi Ratnayake, Penny Smith, Hamish Sullivan, Joyce Tan, Megan Thomas, Jake Thomson, Dmitry Titkov, Greg Tyler, Tom Williams, Michelle Wright, Joan Zhang, Zhan Zhang and Min Zhou for their assistance with, or comments on, this speech. [*]
Many of the themes in this speech have been covered by RBA colleagues in the past. See, for instance, Stevens G (2011), ‘On the Use of Forecasts’, Address to the Australian Business Economists Annual Dinner, Sydney, 24 November; Debelle G (2017), ‘Uncertainty’, 7th Warren Hogan Memorial Lecture, Sydney, 26 October; Ellis L (2019), ‘Watching the Invisibles’, The 2019 Freebairn Lecture in Public Policy, University of Melbourne, 12 June; Ellis L (2022), ‘The Neutral Rate: The Pole-star Casts Faint Light’, Keynote Address to Citi Australia & New Zealand Investment Conference, Sydney, 12 October; Cagliarini A and A Heath (2000), ‘Monetary Policy-making in the Presence of Knightian Uncertainty’, RBA Research Discussion Paper No 2000–10. [1]
Bowen had an extraordinarily varied career. After his time in Queensland, he served as Governor of each of New Zealand, Victoria, Mauritius and Hong Kong; and led a Royal Commission to draft the Maltese Constitution. [2]
I am grateful to QUT Deputy Vice-Chancellor (Indigenous Australians) Angela Leitch for this information. For further detail on the history of the site and the goals of the new faculty, see respectively: QUT, ‘Campus to Country’, available at <https://www.qut.edu.au/about/campus-to-country>; QUT, ‘Faculty of Indigenous Knowledges and Culture’, available at <https://www.qut.edu.au/about/faculty-of-indigenous-knowledges-and-culture>. [3]
Millmow A (2021), The Gypsy Economist: The Life and Times of Colin Clark, Palgrave Macmillan, Singapore, pp 73–83; Markwell DJ (2000), ‘Keynes and Australia’, RBA Research Discussion Paper No 2000-04. [4]
A fascinating question for another speech is whether economics may be particularly affected by overconfidence: Kozlowski AC and TS Van Gunten (2023), ‘Are Economists Overconfident? Ideology and Uncertainty in Expert Opinion’, British Journal of Sociology, 74(3), pp 476–500; Fox J (2012), ‘Economists Are Overconfident. So Are You’, Harvard Business Review (online), 27 June. And also, confidence amplified perhaps by its gender bias: Sarsons H and G Xu (2015), ‘Confidence Men? Gender and Confidence: Evidence among Top Economists’, 14 July. [5]
A good read on these topics is Silver, N (2013), The Signal and the Noise: The Art and Science of Prediction, Penguin. It includes a discussion of so-called ‘wet bias’, which describes the incentives that may bear on some less honourable weather forecasters to lean towards under rather than over confidence, deliberately over-predicting the chances of rain, on the grounds that people would rather go prepared for rain and be pleasantly surprised than the reverse! [6]
I am reliably informed that this was not always the case, because series draws were previously possible – and indeed occurred in 1999 and 2002 (in both cases Queensland retained the Shield because they won the previous series). The rules were subsequently changed to introduce’golden point’, so now there has to be a series winner. [7]
See Knight FH (1933), Risk, Uncertainty and Profit, 1st reprint edition, Houghton Mifflin Co, Boston; Kay J and M King (2020), Radical Uncertainty: Decision-Making Beyond the Numbers, WW Norton & Co, New York. [8]
In truth, we are usually uncertain even about where we are today: macroeconomic data are typically released only with a lag, and are themselves only estimates of the underlying concept, usually obtained by sampling or surveys and in some cases prone to substantial revision. [9]
There is empirical evidence that confidence intervals formed by first choosing a central case and then overlaying two-sided intervals around it are more vulnerable to overconfidence bias than confidence intervals chosen without such prior ‘anchoring’ to a central estimate: see, for instance, Kahneman D (2011), Thinking, Fast and Slow, Farrar, Straus and Giroux, New York. [10]
For further examples of the RBA’s work in this area, see: Tulip P and S Wallace (2012), ‘Estimates of Uncertainty around the RBA’s Forecasts’, RBA Research Discussion Paper No 2012-07; RBA (2022), ‘Box C: What Explains Recent Inflation Forecast Errors?’, Statement on Monetary Policy, November; RBA (2023), ‘Box B: Has the Economic Outlook Evolved as Forecast a Year Ago?’, Statement on Monetary Policy, November. The importance of building such learning into monetary policy deliberations in a systematic way was underscored in the recent Bernanke Review of forecasting at the Bank of England: see Bank of England (2024), ’Forecasting for Monetary Policy Making and Communication at the Bank of England: A Review’, 12 April; Kanngiesser D and T Willems (2024), ‘Forecast Accuracy and Efficiency at the Bank of England – And How Errors Can Be Leveraged To Do Better’, Bank of England Staff Working Paper No 1078. [11]
This obviously assumes that the market projections are not simply copied from the RBA’s! [12]
Experience in other countries is discussed by Chris Giles in his recent Financial Times piece: Giles C (2024), ‘Learning to Trust the Forecasts’, Financial Times (online), 30 July. [13]
Of course, demand is a latent variable too. And there are many other ways in which the supply judgment could be wrong – most obviously if the Phillips Curve is a poor model of reality. That is why it is important for policymakers to be explicit about the judgments they are making, so the sensitivities of their projections to those judgments can be understood and critiqued. [14]
Most take signal directly from inflation or wage out-turns, but many also incorporate other indicators that provide a read on supply, such as labour productivity. For further information see Ballantyne A, A Sharma and T Taylor (2024), ‘Assessing Full Employment in Australia’, RBA Bulletin, April. [15]
The staff track a wide range of labour market indicators to inform their judgement of capacity, see RBA (2024), ‘2.5 Assessment of Spare Capacity’, Statement on Monetary Policy, August. [16]
RBA (2024), Statement on Monetary Policy, August. It is important to emphasise that the August assumption retains the view that the labour market’s supply capacity has improved over the past decade – just at a slightly slower rate than previously assumed. [17]
The uncertainty surrounding model estimates of the economy’s capacity are explored in Bishop J, J Hua, S Omidi, X Zhou and A Ballantyne (2024), ‘Assessing Potential Output and the Output Gap in Australia’, RBA Bulletin, July. [18]
For further information on the liaison program, see Bullock M (2024), ‘Economic Conditions in Post-Pandemic Australia with a Regional Lens’, Rotary Club of Armidale Annual Lecture, Armidale, 8 August. [19]
RBA (2024), ‘Chapter 3.4: Key Risks to the Outlook’, Statement on Monetary Policy, August. [20]
See RBA (2024), n 20, ‘Key risk #2’. [21]