Bulletin – September 2022 Australian Economy The Reserve Bank's Liaison Program Turns 21
- Download 1MB

Abstract
In 2001, the Reserve Bank established its liaison program – a formal program of economic intelligence gathering, through which Bank staff meet frequently with firms, industry bodies, government agencies and community organisations. The program is systematic in its approach to collecting and assessing information, and the intelligence obtained is a useful complement to published sources of data and economic models in informing the Bank's assessment of economic conditions. In addition, the information gathered is available in near real time, making it useful for ‘nowcasting’ and understanding the implications of short-term shocks to the economy. This article looks at the process of liaison, the nature of the information collected and how it has been used over its 21 years of operation.
Introduction
Over the past 21 years, the Reserve Bank's liaison program has made an important contribution to our understanding of current and emerging economic developments in Australia. The economic intelligence gathered through liaison is incorporated into the Bank's internal analysis and policy discussions alongside other published data sources and economic models, and the themes from liaison are shared externally in a range of public communications.
This article outlines the nature of the liaison program, the information collection and how it is used. In particular, it highlights some of the key areas where liaison information has been especially valuable in assisting the Bank's understanding of economic developments.
Background
It has always been important to the Reserve Bank to have a presence in the community and channels for receiving, and sharing, information about economic conditions. Historically, the Bank's interstate branches played a role in this regard – in addition to their banking business, they were the ‘eyes and ears’ of the Bank in the broader community. However, as the Bank's government banking and registry operations shrank, the branch network diminished and most branches were closed by the year 2000.
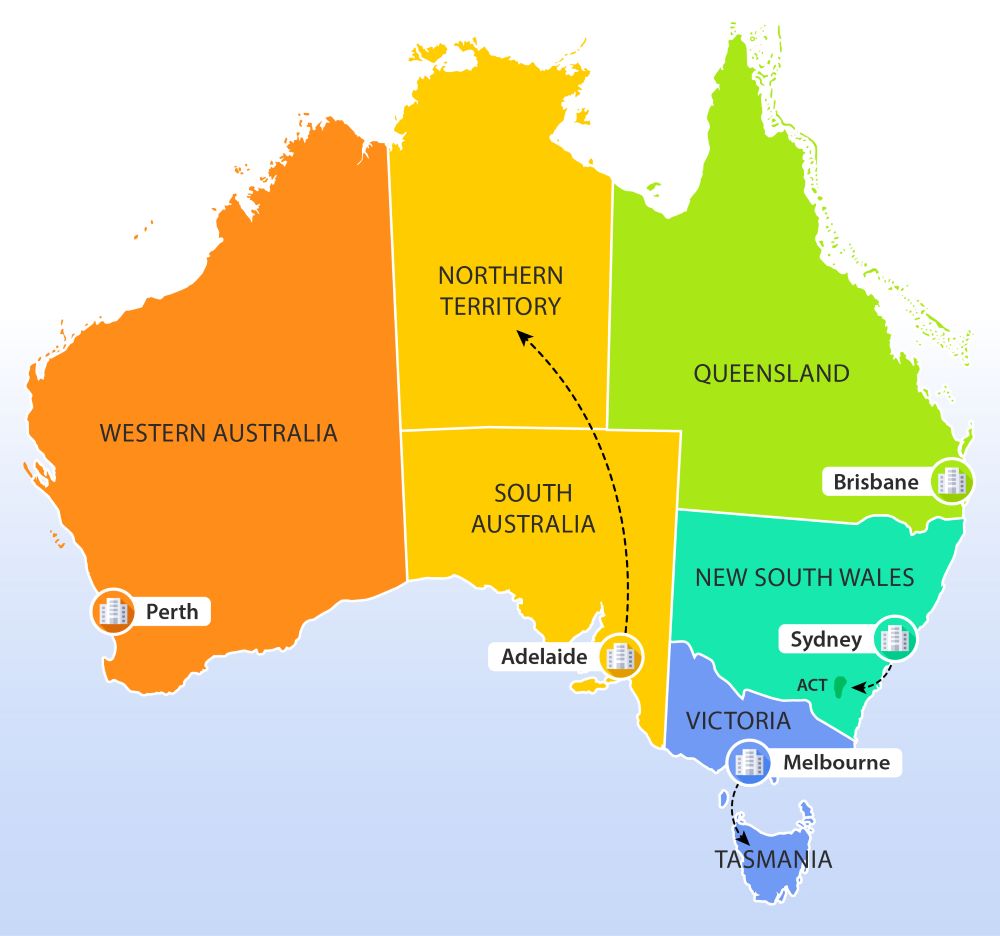
Since that time, the Bank has devoted significant resources to systematically building relationships across a broad cross-section of the business community, and establishing new and direct information channels about economic conditions. The Bank opened offices in Victoria, Queensland and Western Australia in 2001, and in South Australia in 2003; these offices have remained operational ever since.[1] Each state office comprises a small staff, including a senior representative, an economist and a senior liaison officer. Liaison with the New South Wales business community is conducted by a larger dedicated team within Head Office; this team also coordinates the Reserve Bank's liaison program (Figure 1). The staff involved in the liaison program are part of Economic Analysis Department.[2]
The value of liaison information
Most of the economic analysis and forecasting undertaken by the Reserve Bank to inform monetary policy is quantitative in nature and uses official and other sources of data as the primary sources of information. However, there are some limitations to economic data – it may only reflect a share of economic activity, it may provide an imperfect measure of a variable and it is not always timely. This leaves an important role for qualitative information, especially when monetary policy decisions are made in an environment of considerable uncertainty and change is occurring rapidly. Liaison information is also helpful in understanding the drivers of economic data (the ‘why’), as well as how firms are responding.
In addition to the routine analysis of economic data, macroeconomic models are used by the Bank as an important tool to assist in assessments of the economy and its outlook. However, these models are by their nature reliant on data and as such can be subject to error due to the limitations given above. Furthermore, most macroeconomic models require assumptions to be made where there are gaps in the data or where there are credible reasons why historical observations may not be the most informative guide to near-term developments. This is particularly the case during large economic shocks.
Reflecting these challenges, qualitative information can provide a useful supplement to quantitative data and economic models. It can inform assumptions used in the place of data gaps and explain why something has occurred and under what conditions it may or may not occur in the future. The Reserve Bank's liaison program operates within this space by asking economic agents directly about their decisions and experiences.
The nature of the Bank's liaison program
The role of the program
The liaison program has two main roles:
- Economic intelligence gathering – the collection of timely information through liaison meetings to inform the assessment of monetary policy.
- Representation – the presence of Reserve Bank staff across the country to improve the Bank's communication and engagement with the community.
The time and resources devoted to intelligence gathering and analysis are significantly greater than those for representation.
Who do we talk to?
The liaison program has a pool of around 900 currently active contacts. Around three-quarters of these contacts are firms, though an important part of the program is liaison with industry associations, government agencies (particularly at the state government level) and community associations. Contacts are typically invited to participate by Reserve Bank staff following identification that they would maintain or improve the representativeness of the program and enhance the Bank's understanding of economic developments. Participation in the program is voluntary.[3]
In the very early stages of the program, industry associations and government agencies were the focus of our attention, so that the Bank could become more familiar with local industry issues before liaising directly with firms. After gaining high-level insights into industry conditions from these contacts, we began engaging with individual firms from 2002 onwards. Being equipped with some knowledge about their industry enabled us to obtain deeper insights into the conditions facing individual firms and their decision-making, including about key economic variables such as investment, employment and wages. However, industry associations and government agencies remain important contacts that are regularly consulted, as they have insights into entire sectors of the economy.
How representative is the program?
We attempt to interview a range of firms that are broadly representative of the industry structure of the economy. Graph 1 shows that the national share of liaison meetings in each industry group has been broadly representative of each industry's share of output over the life of the program. However, the program has a greater proportion of firms in the wholesale and retail trade sector, compared with their share of output, in order to obtain a more frequent and real-time read on this cyclically sensitive industry; conversely, the program has a smaller proportion in the household services sector where activity is typically less cyclically sensitive and there is a large number of small firms.
The program also aims to ensure broad coverage of conditions across the country. The vast majority of meetings over the life of the program have been conducted in person, which supports our representative role, complemented by virtual meetings. Importantly, staff also conduct regular visits – in person and virtually - with contacts outside of the cities where our offices are based.

Contacts in the program tend to be medium to larger sized firms. By interviewing medium and larger firms, the program can capture a broader sample of activity and employment given available resources. The impost on these larger firms is also less as these contacts are typically better equipped, in terms of available staff and information systems, to answer questions about economic conditions. The Bank gains exposure to the conditions facing smaller businesses (that typically employ less than 20 staff) through some one-on-one interviews, as well as through roundtables, interviews with industry associations and liaison with firms servicing smaller businesses. The Bank also hosts a Small Business Finance Advisory Panel.[4]
Number and frequency of meetings
The Reserve Bank has conducted around 20,000 interviews as part of this program over the past 21 years. Interviews are conducted on a continuous basis throughout the year; this contrasts with many business surveys that are conducted at static points (such as end of the month or the quarter). On average, we speak with around 70–80 contacts a month across the nation and complete almost 900 meetings per year (Graph 2).[5] While most are interviewed for about an hour once per year, around 15 per cent of contacts are spoken to at monthly, quarterly or six-monthly intervals. Participants interviewed more frequently are typically those in more cyclical sectors of the economy, such as retailers and construction firms, or are ‘bellwethers’ of changes in economic conditions (because of their position in a supply chain or exposure to a particular market). Over a typical year, we speak with around 650 individual contacts.
The number and length of meetings can be adjusted in response to shocks. For example, the liaison team conducted a record of around 160 meetings in April 2020 as part of its response to the COVID-19 pandemic; meeting lengths were reduced in recognition of contacts' time constraints during this busy period. The number of meetings conducted in 2021/22 was impacted by COVID-19-related absenteeism for both our staff and contacts, with the total number of meetings in line with the two years prior to the pandemic.

Confidentiality
All meetings within the liaison program are conducted on the basis of confidentiality. This aids in firms being comfortable to share figures and firm-level insights openly with the Reserve Bank, as does the trust built over years of engagement with participants.
Information from the liaison program is aggregated, de-identified and summarised before being shared across the Bank. The Bank is often called upon by other government agencies to provide a view on the economy, including a view ‘based on what firms are saying’. Reflecting our confidentiality commitments, information is only ever shared at an industry or economy-wide level. Similarly, only high-level messages are published in the Bank's external publications.
What information do we collect and how is it used?
Liaison interviews conducted by the Reserve Bank are ‘structured discussions’ involving two main components:
- Core questions – these questions are set and have been asked in most interviews over the past two decades.
- Topical questions – these questions evolve over time and are reviewed regularly.
Key messages from liaison are incorporated into analysis provided to the Reserve Bank Board and communicated to the public on an ongoing basis via the Statement on Monetary Policy and other Bank publications, including the Bulletin and speeches. A regular dedicated summary of liaison messages will be included in the Statement from the November 2022 issue.
Information collected on ‘core questions’
In essence, the core questions each participant is asked at each liaison interview are: how has demand for your goods or services, your investment, headcount, non-labour costs, wages and prices changed over the past year, and how are they expected to change over the coming year?[6]
Based on the responses provided in the interview, we assign a quantitative indicator of the extent of change in the key economic variables being discussed. Specifically, staff assign scores on an ordinal scale from −5 to +5 based on the conditions reported by liaison contacts compared with one year ago.[7] If the level of a variable was unchanged, the score would be zero. An extreme rise would be assigned a score of +5 and an extreme fall assigned a score of −5. While judgement is required for the scores in between, a score of +2 would be considered a ‘normal’ or ‘average’ increase from the previous year.[8] This scaling system provides an important discipline for the interpretation of interviews and generates a rich panel of data for quantitative analysis of actual and expected changes in key economic variables.[9]
Graph 3 shows the evolution of the liaison scores for core variables over the life of the program.[10] The initial negative impact of the COVID-19 pandemic is evident in the declines across all series in the first half of 2020, as is the strong recovery since. Liaison scores for nominal variables such as domestic non-labour costs, wages and prices are currently slightly above +2, indicating that on average firms are reporting higher than ‘normal’ increases in these variables over the past year, after a number of years of subdued outcomes.

Over the life of the program, these scores have been monitored and tested to assess their comparability to official data series. A basic measure of the usefulness of the liaison scores is their correlation with benchmark official variables. Across the core variables on current conditions, the average correlation for the full sample of the liaison program is 0.6. Graph 4 shows the correlation of liaison scores about how economic conditions have changed over the past year against corresponding official data produced by the Australian Bureau of Statistics (ABS), with the degree of correlation suggesting that there is useful information in the scores.

Of particular relevance to monetary policy is forward-looking information, so we also examine the liaison scores for firms' expectations. Granger causality tests suggest there is predictive information about the outlook for aggregate demand and wages in firms' expectations reported through the liaison program (Table 1). Granger causality does not run in the other direction.[11]
| Variable being scored | ABS variable year-ended change |
Granger causality(a) P-value |
|---|---|---|
| Expected change in demand | Domestic Final Demand | 0.01 |
| Gross Domestic Product | 0.01 | |
| Expected change in wages | Wage Price Index | 0.00 |
|
(a) Optimal lag chosen based on Akaike information criterion. Sources: ABS; RBA |
||
Since liaison scores appear to contain useful information regarding official variables, they are one input used to inform judgement-based adjustments to model-driven forecasts and other advice on the possible direction or momentum in economic activity. This is particularly the case where trends in economic data appear to be at a turning point, or the economy is experiencing an economic shock where little or no official data are yet available. In such instances, the scores are used in conjunction with other available data, including surveys, as well as economic theory and economic research to try and gauge the most likely outcome and risks to the forecasts. Firms' answers to other ‘non-core’ questions (discussed below) are also an important input to these judgements.
As part of the information collected and scored by Reserve Bank staff, many participants offer precise numerical information about their business activities. This is often used by staff in assigning liaison scores, but it is also useful in its own right. This is particularly so for information about wages and prices (which are core to analysis of the inflation outlook) and for economic activities that are difficult to measure (like services sector output). Typically, regular contacts in the program (and even newer ones) come to liaison meetings ready to report numerical outcomes or estimates, reflecting the trust firms have in the program's confidentiality.
Understanding topical developments in the economy
In addition to gathering information on core questions, liaison interviews include topical or ‘non-core’ questions that ask contacts in particular industries about the drivers of a development or the impact of a specific shock.[12] The answers to topical questions are often coupled with data analysis to form assessments of issues as they arise; the timeliness of liaison can be particularly helpful in understanding the economic effects of unexpected events (such as natural disasters) or gaining insight into structural changes in the economy. The liaison team will typically identify and seek meetings with relevant contacts within days of a significant event to better understand the scale of the shock, its effects and the implications for the economy. This is aided by longstanding relationships with many of our contacts.
The focus of topical analysis is determined on an ‘as needed’ basis. To ensure information collected remains current and targeted over time, analysts from both the liaison program and the Bank's forecasting teams meet regularly to discuss economic developments and key uncertainties to develop priority questions for firms on different issues. Episodic questions used in interviews may test various internal hypotheses and build a better understanding about how each industry works, the current stage of its business cycle, the challenges and opportunities faced over the medium-to-long term, and how firms are responding to the domestic and international circumstances they face. In doing so, this work supports the Bank's effectiveness, particularly in environments of uncertainty.
While liaison information has improved the Bank's understanding of a wide range of topics over the past decade, the four case studies discussed below provide examples of times when liaison was especially helpful.[13]
Case study 1: The mining investment boom
Insights from liaison were instrumental in improving the accuracy of the Bank's forecasts for mining investment and resources exports during the commodity price boom of the mid-2000s to late 2011, and its subsequent unwinding thereafter. Information from mining contacts gave the Bank an early indication that the amount of mining investment was going to be bigger than most forecasters expected and that, as prices fell, investment would decline at a faster pace than anticipated; this was highlighted in a speech by Assistant Governor Kent (2016), and in an interview (RBA 2014b). Liaison with other firms also highlighted the significant spillovers from mining investment to other sectors of the economy and the labour market, outlined in Bulletin articles by Manalo and Orsmond (2013) and Langcake and Poole (2017).
Case study 2: Retail inflation in the 2010s
Inflation for retail goods in the first half of the 2010s was surprisingly low, especially given the depreciation of the Australian dollar from 2013, which would normally increase the price of imported goods. Statistical analysis did not provide an answer for this weakness, indicating little evidence that the relationship between the exchange rate and retail inflation had changed. It was discussions with retailers in the liaison program that suggested an intensification of competition in the retail sector and firms' efforts to reduce costs along their supply chain were likely to have contributed to low retail inflation. These developments were explored in a Bulletin article by Ballantyne and Langcake (2016).
Case study 3: Wages growth
Both qualitative and quantitative liaison information has contributed to the Bank's understanding of developments in wages growth over the past decade.
The actual wages growth numbers reported by firms through the liaison program have historically had a very high correlation with the private sector Wage Price Index (WPI) produced by the ABS (Graph 5). These numbers, along with data and survey information, are useful for ‘nowcasting’ and ‘nearcasting’ as they are typically available at least six weeks prior to the ABS's publication of the WPI.

In addition to the aggregated wage outcomes reported by firms, the liaison team also reviews the distribution of firms' reported wage growth outcomes and intentions (Graph 6).

Wages growth declined notably from the early 2010s and remained subdued at around 2 per cent per annum until the end of the decade. Discussions with liaison contacts provided some possible explanations for the decline, and indicated that wages growth was likely to remain subdued. This was supported by the numerical wages growth figures they shared. These messages were highlighted in a speech by former Deputy Governor Debelle (2019) and in a Bulletin article by Jacobs and Rush (2015). Firms also provided insights into the range of practices they sometimes use before increasing wages to address skills shortages and how this varies in different time periods; these insights were shared in a Bulletin article by Leal (2019).
The COVID-19 pandemic resulted in another marked slowdown in wages growth in 2020 and 2021. The numerical wages information from liaison was valuable in helping forecast this decline and subsequent rebound. In 2022 thus far, liaison information suggests that wages growth has been picking up. Around 40 per cent of firms over the past two quarters reported wages growth above 3 per cent – this is higher than the share in late 2021 and higher than the years prior to the pandemic (Graph 6). In terms of expected wages growth, over recent quarters there was a much lower share of firms reporting expected wages growth below 2 per cent than prior to the pandemic and a much larger share reporting expected wages growth over the year ahead above 3 per cent.
Case study 4: The recent increase in consumer price inflation
A focus of topical liaison analysis over recent quarters has been the increase in consumer price inflation. Liaison with the construction, energy and retail sectors on this topic has provided valuable information for the Bank to use in its economic assessments.
Liaison with the residential construction sector over the past year or so, combined with official data and surveys, has allowed the Bank to gain deeper insights into the factors contributing to the sharp increase in new dwelling inflation. With firms operating at close to full capacity, liaison has highlighted that a broad-based decline in the availability of most trades since late 2020 has weighed on the ability of construction firms to expand capacity to deliver this large pipeline of investment. Coupled with difficulties in securing sufficient material supplies, firms have noted for several quarters that project completion times have been pushed out relative to their typical timeframes and the volume of residential construction work done has been much lower than would typically be expected by the flow of approvals (Graph 7). As a result of these pressures, input costs have increased significantly. Of note, builders have said that in many cases suppliers and subcontractors are now reviewing costs monthly and residential construction firms are doing the same. The combination of larger and more frequent cost increases is adding upwards pressure to inflation, as discussed in a speech by Assistant Governor Ellis (2022).

Liaison with the energy sector provided insights into the drivers of the sharp increases in wholesale electricity prices in the June quarter and their implications for retail electricity prices. Liaison supplemented the analysis of published data on commodity prices, electricity demand and generation from fossil fuel and renewable sources, by asking a range of contacts in the energy sector for their insights into areas where data were more limited, the key factors in their decision-making during this period, and importantly their expectations for electricity prices over the coming quarters. This information was used to inform the Bank's forecasts for retail electricity and gas bills for households, and in turn consumer price inflation, in the August 2022 Statement on Monetary Policy. Households' electricity and gas prices are expected to increase significantly in the September quarter (though the bulk of the effect on the Consumer Price Index will be delayed until the December quarter), and contacts generally expect further significant increases in retail electricity prices in 2023 (RBA 2022).
Finally, liaison with firms in the retail sector provided valuable information about the outlook for retail inflation (Graph 8). Liaison with these firms over recent quarters has included specific questions on the share of their products undergoing price changes or expected to undergo price changes. Retail contacts have also been asked about the factors affecting pass-through of cost increases to prices, and how the frequency and magnitude of price changes compares to that in the pre-pandemic period. Most retailers in the liaison program have increased prices over recent months, or expect to do so over the months ahead, due to the persistence and magnitude of cost increases from inputs such as energy, shipping and materials. Suppliers are also requesting price increases more frequently. Firms in the liaison program have said that their price increases have become fairly widespread and passing through price increases is now more easily accepted by consumers than prior to the pandemic. Firms have generally reduced discounting, particularly when product availability has been low.[14]

Adaptability of the program
A key feature of the liaison program is the scope to adapt the non-core topics for discussion and the types of contacts spoken to, as well as the number and length of meetings. This has been particularly important in times of crisis, such as during the global financial crisis (GFC) and the COVID-19 pandemic. For example, liaison information from key firms on evolving events during the early part of the GFC indicated that reductions in labour demand would primarily occur via fewer hours worked and the use of accumulated leave rather than large headcount reductions, which aided the Bank's forecasting of labour market outcomes (RBA 2014a; RBA 2014b). Liaison information has been used extensively in the forecast process during the pandemic, and has been critical for providing a timely read on conditions as well as generating insights into the impacts of the shock and policy responses.
While adaptation of the program has primarily reflected changes to the topics discussed with contacts and how frequently we speak with them, the COVID-19 pandemic also led to some practical adaptations. The liaison program shifted rapidly to entirely virtual liaisons from March 2020 in light of public health restrictions. Prior to this, only a small share of liaison meetings had been conducted virtually. Advantages arose from the shift, including: reduced travel time, which increased productivity; a greater ability for liaison staff and subject matter experts to join meetings with contacts across states; and the ability to continue to engage with regional contacts while travel was restricted.
More generally, the Reserve Bank periodically reviews and adjusts the liaison sample to capture changes in the structure of the economy over time to help maintain the representativeness of the program. For example, coverage of online retailers has been expanded in line with the growing share of online retail sales since the mid-2010s, a trend that accelerated during the pandemic. Similarly, community organisations and not-for-profit organisations were included in the program from 2012 to gain greater insight into households experiencing financial stress or long-term unemployment and to improve the Bank's understanding of economic developments in this space. Such information helped inform our understanding of employment outcomes for disadvantaged Australians, as discussed in a Bulletin article by Cunningham, Orsmond and Price (2014). More recently, the liaison sample has been expanded to include First Nations contacts that would otherwise be missed due to the limited sample of smaller firms in the program.[15]
Conclusion
The Reserve Bank's liaison program complements published data and other information sources to enhance our understanding of the economy. The program aims to be systematic in its approach to recording core information over time, but flexible enough to identify and respond to economic shocks and structural changes. It is also an important way through which the Reserve Bank engages with the Australian community. We expect these core aspects of the program to persist, though the Bank remains committed to the program's continual improvement, adaptation and review.
Acknowledgements
First and foremost, the Reserve Bank sincerely thanks all liaison contacts, past and present, for their participation in the program. Without you, the program would not exist, and our analysis and understanding of the economy would be poorer for it. Thank you also for your collegiality and support to our staff, especially those in our state offices for whom you are a key part of their everyday interactions. A special thanks to firms that have been with the program for more than a decade and to the many firms that continued to support the program over the past few years, even while facing significant challenges. We also thank all staff in the program, past and present, for their commitment to making the liaison program a credible and insightful source of information.
Finally, we would like to acknowledge the support, deep knowledge, unique enthusiasm and guidance of the late Mr Chris Bonney, the Reserve Bank's inaugural Manager First Nations and Inclusion, in our efforts to incorporate First Nations firms into our liaison program.
Endnotes
Kate McLoughlin and Aaron Walker are from Economic Analysis Department. Jacqui Dwyer is from Information Department and was formerly involved in the establishment of the liaison program. The authors are grateful for the assistance provided by the Regional and Industry Analysis Section, in particular Oliver Cutbill, and to Richard Evans in the preparation of this article. [*]
The Victorian Office engages with Tasmanian contacts, the South Australian Office engages with Northern Territory contacts, and staff in Head Office engage with contacts in both New South Wales and the ACT. [1]
The Bank's liaison program is not the only form of liaison conducted by the Bank. For example, the Domestic Markets and Financial Stability departments have extensive networks for collecting information from the finance sector. [2]
While liaison meetings are largely focused on information gathering, we ensure there is time in each meeting for our contacts to ask any questions they may have for the Bank. We also host debriefs following the release of our Statement on Monetary Policy and Financial Stability Review publications as a way of saying ‘thank you’ to our contacts. [3]
See RBA, ‘Small Business Finance Advisory Panel’. Gaining small business perspectives is an important part of the Bank's economic analysis as they account for an estimated 30 per cent of economic activity and 40 per cent of employment (ASBFEO 2020). [4]
The number of firms spoken to varies a little from month to month and is typically lower in December and January reflecting the number of contacts on leave at this time. [5]
Typically, we focus on growth over the year to control for seasonal influences. [6]
The origins of this approach come from Likert (1932), who first published a report using such ordinal rankings to gauge the strength of social attitudes. It is most commonly used in social research to measure the level of agreement with a statement, though variants of it have become features of business surveys. Staff undertake training on completing these scores and analysts review scores as part of assurance exercises. [7]
A key exception is for business investment, where a score of zero reflects an ‘average’ or ‘normal’ level of investment, and negative (positive) scores reflect investment below (above) average levels. [8]
Nicholls and Orsmond (2015) use liaison scores to analyse the drivers of small businesses' behaviour. [9]
Not all information firms provide in response to these questions is able to be readily transposed to a score, and sometimes the contact is unable to provide this information. Consequently, most liaison meetings do not result in scores for all of the six variables in Graph 3 (either on current or prospective conditions), but the majority of variables are scored at any point in time. [10]
Granger causality results are not sensitive to lag length and are fairly stable over the sample. For both the overall and private measures of year-ended WPI growth and the expected change in wages scores, we fail to reject the presence of a unit root. Taking the first difference of all series yields similar Granger causality results. [11]
Through discourse, firms often provide additional qualitative information about their business operations, their observations of changes in the economy and the drivers of these trends. In this way, liaison meetings are typically analytical in nature and differ from some business surveys commonly undertaken. Bank staff can subsequently seek data or adjust future interview questions to further explore the potential significance of an issue. [12]
Other publicly available examples of topical analysis utilising liaison insights data include Hsieh, Norman and Orsmond (2012), Lane and Rosewall (2015), Jenner et al (2018), de Atholia, Flannigan and Lai (2020), Grozinger and Parsons (2020), de Atholia and Walker (2021), RBA (2021a) and RBA (2021b). [13]
From time to time, staff also conduct a pricing survey of firms. For an example of published analysis on the results, see Park, Rayner and D'Arcy (2010). [14]
The inclusion of First Nations' contacts complements the work of the Bank's Small Business Finance Advisory Panel and is part of the Bank's commitments under our ‘Innovate’ Reconciliation Action Plan. [15]
References
ASBFEO (Australian Small Business and Family Enterprise Ombudsman) (2020), ‘Small Business Counts’, December.
Ballantyne A and S Langcake (2016), ‘Why Has Retail Inflation Been So Low?’, RBA Bulletin, June, pp 9–18.
Cunningham M, D Orsmond and F Price (2014), ‘Employment Outcomes of the Economically Disadvantaged’, RBA Bulletin, March, pp 23–31.
de Atholia T, G Flannigan and S Lai (2020), ‘Renewable Energy Investment in Australia’, RBA Bulletin, March.
de Atholia T and A Walker (2021), ‘Understanding the East Coast Gas Market’, RBA Bulletin, March.
Debelle G (2019), ‘Employment and Wages’, Speech at the Australian Council of Social Service (ACOSS) National Conference, Canberra, 26 November.
Ellis L (2022), ‘Housing in the Endemic Phase’, Keynote Speech to the UDIA 2022 National Congress, Sydney, 25 May.
Grozinger P and S Parsons (2020), ‘The COVID-19 Outbreak and Australia's Education and Tourism Exports’, RBA Bulletin, December.
Hsieh W, D Norman and D Orsmond (2012), ‘Supply-side Issues in the Housing Sector’, RBA Bulletin, September, pp 11–20.
Jacobs D and A Rush (2015), ‘Why Is Wage Growth So Low?’, RBA Bulletin, June, pp 9–18.
Jenner K, A Walker, C Close and T Saunders (2018), ‘Mining Investment Beyond the Boom’, RBA Bulletin, March.
Kent C (2016), ‘After the Boom’, Speech at the Bloomberg Breakfast, Sydney, 13 September.
Lane K and T Rosewall (2015), ‘Firms' Investment Decisions and Interest Rates’, RBA Bulletin, June, pp 1–8.
Langcake S and E Poole (2017), ‘The Resources Economy and the Terms of Trade Boom’, RBA Bulletin, September, pp 27–34.
Leal H (2019), ‘Firm-level Insights into Skills Shortages and Wages Growth’, RBA Bulletin, March.
Likert R (1932), ‘A Technique for the Measurement of Attitudes’, Archives of Psychology, 140, pp 5–55.
Manalo J and D Orsmond (2013), ‘The Business Services Sector’, RBA Bulletin, March, pp 1–10.
Nicholls S and D Orsmond (2015), ‘The Economic Trends, Challenges and Behaviour of Small Businesses in Australia’, in A Moore and J Simon (eds), Small Business Conditions and Finance Conference, Reserve Bank of Australia, Sydney.
Park A, V Rayner and P D'Arcy (2010), ‘Price-setting Behaviour – Insights from Australian Firms’, RBA Bulletin, June, pp 7–14.
RBA (Reserve Bank of Australia) (2014a), ‘The RBA's Business Liaison Program’, RBA Bulletin, September, pp 1–6.
RBA (2014b), ‘Business Liaison Program’, Video, 13 November.
RBA (2021a), ‘Box B: Supply Chains during the COVID-19 Pandemic’, Statement on Monetary Policy, May.
RBA (2021b), ‘Box B: COVID-19 and Commercial Property in Australia’, Statement on Monetary Policy, August.
RBA (2022), ‘Box A: Recent Developments in Energy Prices’, Statement on Monetary Policy, August.