RBA Annual Conference – 1996 The Evolving Structure of the Australian Financial System Malcolm Edey and Brian Gray
1. Introduction
Like other industrial countries, Australia has experienced major changes to its financial system in recent decades. The net effect has been a transformation in the Australian financial system from a relatively closed, oligopolistic structure in the 1950s and 1960s, based predominantly on traditional bank intermediation, to a more open and competitive system offering a much wider variety of services from an array of different providers. This process of financial system evolution, while driven largely by market forces, has been assisted by prevailing regulatory and supervisory arrangements.
A process comparable to that seen in Australia has been observed and widely discussed in the United States under the generic heading ‘the decline in traditional banking’.[1] There, the phrase has been used to describe a long-term trend involving financial disintermediation and a resulting fall in the relative size of the banking sector compared to other forms of financing. It has been associated, in particular, with an increasing trend towards financing through securities markets. The debate in Australia has been somewhat different, though it shares some common elements with the overseas experience. Here, the focus has been not on a decline in banks per se since, by most quantitative standards, Australian banks currently dominate the financial system as much as at any time in the past few decades. Rather, against a background of change, the focus is on how the competitive forces already at work might affect the future structure of the system, including the nature of the core business of banking and the boundaries between banks and other providers of financial services.
Among the range of influences on financial-sector development, three main forces can be highlighted. The first has been the role of financial regulatory policy which, to an important degree, shaped the broad trends in banks' market shares in recent decades – the extended period of decline up until the early 1980s and subsequent recovery in the post-deregulation period. Second, technological developments have been important in reducing the cost of many information-intensive financial activities and in making available a wide range of new products and delivery systems. A third influence arises from the interaction of these first two factors with the historical cost and pricing structure of traditional intermediation, and in particular with the traditional cross-subsidisation of payments services by banks. The persistence of elements of this pricing structure has created opportunities for growth of specialist low-cost financial service providers which have become an increasingly important source of competitive pressure on banks. An analysis of how these forces have shaped the evolution of the system underlies much of the discussion that follows.
In Section 2 of the paper we give a general overview of the main trends in the financial sector and try to relate those trends to the changing demands of the users of financial services: the government, household and business sectors. Section 3 deals in more detail with banks and financial intermediaries while Section 4 looks at the life insurance and superannuation sector, with an overall assessment drawn together in Section 5. There is an attempt in that final section to raise some questions about the boundaries between the traditionally defined institutions which form the basis of existing supervisory and regulatory arrangements.
2. Overview of the Main Trends
2.1 The Starting Point: The Financial System in the 1950s and 1960s
While the 1950s might seem a remote starting point for analysis, the period provides a good stylised model of what might be called the ‘traditional’ financial system, and many of the important trends to be analysed can be traced back to that time. In the discussion that follows we make use of a basic distinction between the financial intermediaries sector, comprising those institutions whose core functions involve borrowing and lending,[2] and the managed-funds sector, comprising mainly life insurance and superannuation funds along with other investment vehicles like unit trusts. It will be argued that this represents a reasonably natural distinction and that competition within each of the two sectors has generally been more important than competition across sectors. Emerging areas of competition and functional overlap between the two areas are discussed in Section 4.
Table 1 illustrates long-run trends in the structure of the financial intermediaries sector. It can be seen that, until the 1950s, financial intermediation was largely synonymous with banking. In 1953, banks accounted for 88 per cent of the total assets of this sector while the next largest group, pastoral financiers, had only 4 per cent. A summary balance sheet for banks at around the same period (Table 2) shows the main elements of what might be regarded as the traditional bank product mix. Deposits were raised mainly from low-cost sources, with non-interest-bearing cheque accounts and low-interest savings bank deposits together funding around 85 per cent of the balance sheet. Fixed deposits represented most of the remainder. On the asset side, almost half the balance sheet was invested in government securities or held in SRDs, and around 40 per cent accounted for by loans. With interest rate controls in place, bank loans were rationed and available only to the most creditworthy of borrowers. Banks faced little competitive pressure from other institutions, which had not yet begun their rapid development, and the system was not open to foreign bank entry or to offshore transactions. Banking business was essentially a low-risk proposition conducted at regulated prices.
| 1929 | 1936 | 1953 | 1970 | 1980 | 1985 | 1990 | 1995 | |
|---|---|---|---|---|---|---|---|---|
| Banks | 94 | 95 | 88 | 70 | 58 | 59 | 69 | 77 |
| Building societies | 2 | 2 | 3 | 5 | 12 | 10 | 5 | 2 |
| Credit unions | — | — | — | 1 | 1 | 2 | 2 | 2 |
| Money market corporations | — | — | — | 3 | 6 | 11 | 11 | 9 |
| Pastoral financiers | 4 | 3 | 4 | 3 | 1 | 2 | 0 | 0 |
| Finance companies | — | 1 | 3 | 15 | 18 | 13 | 9 | 6 |
| Other | — | — | 1 | 3 | 4 | 3 | 4 | 3 |
|
Sources: Martin Committee (1991) and Reserve Bank of Australia Bulletin. |
||||||||
| Trading banks | Savings banks | Total | Per cent of total assets | |
|---|---|---|---|---|
| Liabilities | ||||
| Non-interest-bearing deposits | 2,336 | — | 2,336 | 43.0 |
| Savings bank deposits | — | 2,289 | 2,289 | 42.1 |
| Fixed deposits | 514 | — | 514 | 9.5 |
| Other (excludes capital) | 142 | — | 142 | 2.6 |
| Assets | ||||
| SRDs | 521 | n.a. | 521 | 9.6 |
| Government securities | 415 | 1,704 | 2,119 | 39.0 |
| Loans | 1,945 | 364 | 2,309 | 42.5 |
| Other | 366 | 119 | 485 | 8.9 |
|
Source: Reserve Bank of Australia Occasional Paper No. 8. |
||||
The other main part of the system was the managed-funds sector, which in terms of assets was around one-third the size of the banks. This comprised principally life offices and superannuation funds, which offered very different services from banks in the form of long-term, highly tax-favoured saving plans. There was some overlap with banking functions in the provision of mortgage lending by life offices, which helped to satisfy the demand for mortgages unmet by banks. This area of lending activity was quite substantial in the 1950s and 1960s but subsequently declined, for reasons discussed in Section 4.[3]
From this sketch we can summarise the three elements of what might be called the traditional bank business mix; namely, lending, deposit-taking and the provision of transactions services.[4] An important question that recurs through this paper is the extent to which these three services need to be provided in a single institution. In this respect a central part of the developing story concerns the emergence of new financial products and new institutions that can compete separately for profitable lines of business, without taking on the whole of the banking product mix. This sort of competition was not possible in the 1950s and 1960s when securities markets were undeveloped and separation of deposit and lending functions, as is now exemplified by cash management trusts and mortgage managers, was not possible.
2.2 Development of Financial Institutions
Overall growth of the financial system and its institutional subsectors is illustrated in Figure 1. System assets more than doubled as a ratio to GDP between the 1960s and 1990s, with much of that growth occurring in the immediate post-deregulation period in the second half of the 1980s. This has been followed by a period of slower growth but the long-term trend still appears to be upward, consistent with patterns in other countries and with theoretical notions of ‘financial deepening’ as an economy grows. That is, the demand for financial services, broadly defined, tends to increase faster than the increase in income.
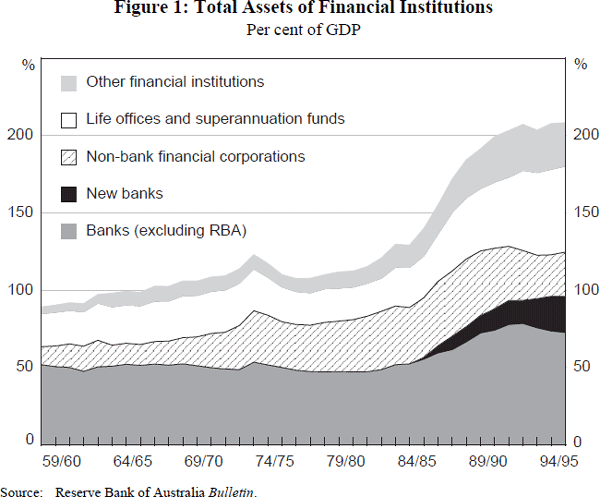
Banks went through an extended period of declining market share during the 1960s and 1970s, when corresponding gains were made by non-bank financial intermediaries, particularly building societies, finance companies, merchant banks and, later, unit trusts (trends that will be elaborated further below). This trend reflected the competitive disadvantage that financial regulations placed on banks. In particular, interest rate controls tended to keep the entire structure of bank rates below market-clearing levels, with a consequent rationing of bank funds and the emergence of a ready market for funding at higher rates. To some extent, the banks became involved in this market by creating new non-bank subsidiaries to conduct this business ‘outside’ the bank itself and, therefore, outside regulatory constraints. But there was also a substantial growth of non-bank financial institutions (NBFIs) not affiliated to the domestic banking sector. In a number of cases, these institutions were owned by foreign banks that sought a financial presence in Australia but were precluded from establishing a formal banking operation by the effective moratorium on new foreign banking authorities before 1985. In other cases, non-bank institutions were joint ventures between domestic and foreign banks.
A strong reverse trend in these market shares has been observed in the post-deregulation period as the banks' ability to compete with NBFIs improved. In addition, banks reabsorbed non-bank affiliates onto their balance sheets and there were a number of prominent non-bank institutions, particularly building societies, which found it advantageous to convert to banks in the late 1980s and early 1990s. A one-off easing of restrictions on foreign bank entry in the mid 1980s, and the more open entry policy adopted in the early 1990s, saw the foreign bank presence increase, in part at the expense of the merchant bank sector.
A critical factor shaping the recent history of the financial system, and widely analysed elsewhere, was the credit boom which followed financial deregulation. This phenomenon, and its interaction with macroeconomic developments in the 1980s, contributed to growth of the financial sector in a number of ways. Most importantly, it gave the system the capacity to satisfy long-standing, repressed demands for finance. This had the predictable (in a qualitative sense) effect of allowing a one-off expansion of the financial sector relative to its historical trend. Related to this, the expansion in the availability of finance contributed to an asset price boom which further fed back into credit growth. Rising asset prices and expectations of continued asset price inflation fed the demand for credit and also provided increased collateral to support debt-financed asset acquisition. Finally, rising real asset prices and the high real interest rates that followed deregulation meant that the managed-funds sector generated exceptionally high rates of return in the 1980s. Since these funds tended to be locked in (particularly in superannuation funds) and automatically reinvested, the high rates of return contributed substantially to growth in these institutions' assets. The net result was a near doubling of the size of the financial sector relative to GDP in little more than a decade.
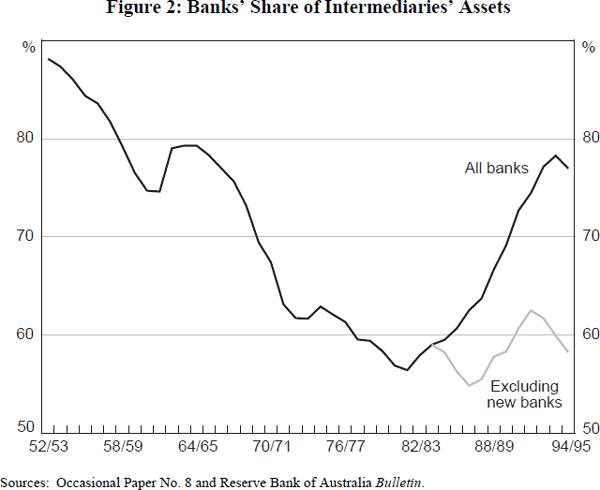
The shifting market share of banks vis-à-vis other financial intermediaries is illustrated more starkly in Figure 2, which shows banks' assets as a share of the total financial intermediation sector. This declined steeply to a low point of 57 per cent in 1982 before recovering equally dramatically to almost 80 per cent by 1994, comparable to banks' market share in the 1960s. The pattern of decline and recovery is exaggerated somewhat by the growth and subsequent reabsorption of NBFI subsidiaries by banks, but the qualitative picture remains valid; on a consolidated basis, banks' asset share fell to a trough of 61 per cent in 1981, still a substantial reduction in the market share of consolidated banking groups from the levels of the 1960s and 1970s. On the other hand, the recovery in banks' aggregate market share during the subsequent period was substantially boosted by the entry of new banks, particularly through the conversion of existing non-bank intermediaries. When new and pre-existing banks are shown separately, it is apparent that banks already existing in the mid 1980s largely did not recover the market share lost in earlier decades. This may be one indicator of the increasingly competitive environment faced by banks, a theme that will be discussed in greater detail below.
2.3 The Non-Financial Sectors
Before turning to a more detailed analysis of competitive forces within the intermediation sector it will be useful to look at trends in the financial demands of the other parts of the economy which are the financial sector's clients. This is done in the next three subsections covering the government, corporate and household sectors.
2.3.1 Government
Developments in government finance have exerted a powerful influence on the financial sector throughout the postwar period. The federal government entered the postwar period with a substantial volume of debt, amounting in 1950 to more than 100 per cent of GDP. This ratio was steadily reduced until the late 1970s and underwent a further major reduction in the second half of the 1980s, reaching a trough of 15 per cent of GDP in 1990/91. This trend has meant that holdings of government debt have necessarily represented a diminishing proportion of the balance sheets of financial institutions, and particularly of banks, which had held a large part of the outstanding supply in the 1950s. The reduction in government security holdings in turn allowed banks to expand their lending to the household and corporate sectors, thereby gradually changing the structure of banks' balance sheets. Between the early 1950s and the early 1990s, public sector securities and SRDs fell from over 50 per cent to under 10 per cent of banks' total assets.
The combination of higher deficits and higher inflation in the 1970s had important consequences for the financial system in general and for the marketing of government securities in particular. High and variable inflation meant that the demand for government securities became more unpredictable at the same time as the flow of deficits to be financed increased. This in turn generated difficulties of monetary control that led to pressure for the introduction of market-based mechanisms to ensure that government financing requirements could be met. Important responses to these pressures were the introduction of treasury note tenders in 1979 and bond tenders in 1982, replacing the previous systems of administered interest rates on these instruments. The move to market-determined rates on these securities in turn stimulated a whole range of other financial developments as well as intensifying the pressure to deregulate deposit and lending rates of banks, a process described in detail by Grenville (1991).
2.3.2 Corporate sector
By international standards, leverage within the Australian corporate sector has traditionally been relatively low, and this remains the case despite a substantial increase in corporate borrowing in the late 1980s. Average debt-equity ratios of Australian companies appear broadly similar to those in the United States and Canada but significantly below those in the United Kingdom, other European countries and Japan (Table 3).[5] As is elaborated by Prowse in this volume, differences in leverage and other aspects of the corporate funding mix reflect a wide range of differences in the structural characteristics of the respective economies. One important dimension of this is the distinction often drawn between ‘Anglo-Saxon’ and ‘universal-banking’ financial systems, which differ in the extent to which their institutional characteristics favour intermediated rather than direct financing of business activities. Prowse argues that there is some tendency for these divergent systems to become more similar, a result of ongoing financial innovation and internationalisation of financial systems.
| 1981–1985 | 1986–1990 | 1991–1993 | |
|---|---|---|---|
| United States | 0.5 | 0.8 | 1.0 |
| Japan | 4.8 | 4.2 | 4.0 |
| Germany | 3.6 | 2.7 | 2.8 |
| France | 2.7 | 2.2 | 1.4 |
| Italy | 3.6 | 3.0 | 3.1 |
| United Kingdom | 1.1 | 1.1 | — |
| Canada | 0.9 | 0.9 | 1.0 |
| Australia | 0.5 | 0.6 | 0.6 |
|
Sources: OECD Non-financial Enterprises Financial Statements (for all countries except Germany and Australia); OECD Financial Statistics (for Germany); and Reserve Bank of Australia. |
|||
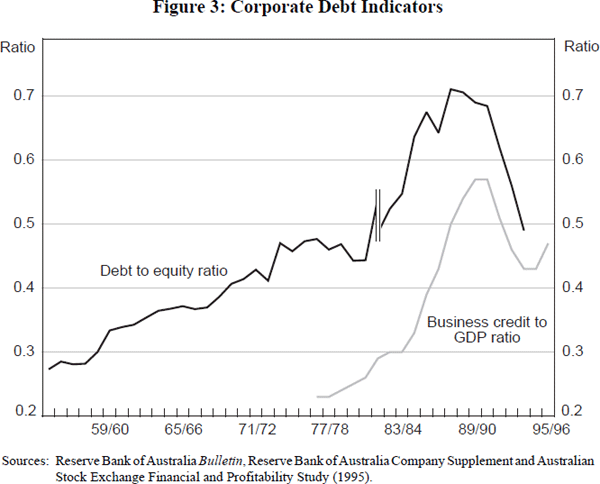
The Australian historical experience seems broadly consistent with the pattern of increasing corporate debt observed in other low-leverage systems, particularly in the United States and Canada. Starting from a low base in the 1950s and 1960s, the average debt-equity ratio in Australia has been on a sustained upward trend, accelerating sharply in the second half of the 1980s before the subsequent period of debt reduction observed more recently (Figure 3). The spike in leverage in the late 1980s is in fact understated by the data in Figure 3, based on a continuous sample of companies, since many of the companies whose leverage increased most dramatically at that time did not survive the period and are therefore excluded from the continuous sample.[6] Notwithstanding the substantial debt reductions that took place in the early 1990s, the volume of corporate debt outstanding remains considerably higher relative to GDP than was the case in the early 1980s, and the most recent data suggest that corporate borrowing has again begun to increase.
An important characteristic of the debt component of Australian corporate financing is the limited use made of direct borrowing through the issue of corporate securities. Corporate borrowing demands in Australia have traditionally been met mainly by financial intermediaries – that is, by banks, merchant banks and finance companies, with the largest part of the market being accounted for by banks. Currently only around 10 per cent of the aggregate corporate balance sheet is financed by debt securities.[7] In this respect the pattern of corporate financing in Australia differs from those in the larger English-speaking countries, particularly the United States and the United Kingdom, where debt security issuance has historically represented a sizeable proportion of overall corporate sector funding.[8] A possible explanation is the smaller size of the Australian economy and the relatively small number of Australian companies that would be considered large on an international scale. Direct security issuance is clearly likely to be more viable the larger the company (other things equal), since large companies are more likely to have well-established reputations as well as being able to spread the cost of information over a larger volume of capital to be raised.
The fact that direct forms of financing have not been favoured to date, however, provides little guide to the future. There is a strong belief within banking circles that a number of underlying factors are generating conditions which could lead to an expansion in the corporate debt market. One factor is the increased sophistication of institutional investors and increased demand from that source for good quality debt. In Australia, the expected expansion in the funds-management and superannuation sector could be an important catalyst in this regard. The potential for growth could be further enhanced if attempts to rein in the growth of government debt are successful in the years ahead, as there could then be an increase in demand for alternative securities.
These observations concerning direct and indirect funding have an important bearing on the larger question of the long-term role of banks. An important part of the core business of banks, and of financial intermediaries more generally, has been the funding of businesses through non-marketable loans. Intermediaries earn income in this line of business through the application of expertise in credit assessment and from their store of detailed knowledge about individual borrowers. The question arises as to whether this line of business, or some segment of this business, will continue to represent a growth market for financial intermediaries, as it has over much of the historical period reviewed above.
One view, put for example by Bisignano (1991), is that technological improvement is continually reducing the information costs associated with direct financing, even for relatively small companies. Goodhart (1988) takes a somewhat contrary view arguing that banks (or financial intermediaries more broadly defined) seem likely to retain at least that part of lending linked to the small to medium business sector, where the practical difficulties of assessing creditworthiness are much greater, technological improvements notwithstanding, than for larger companies. It could, of course, be argued that the issue is more involved than suggested by either of the above authors. Corporate demands for finance tend to be diverse, with required borrowings linked variously to long-term capital investments at one extreme or to the need for shorter-term standby and liquidity facilities on a day-to-day basis. While direct forms of financing could be an efficient means of obtaining longer-term funds, a role could still exist for intermediated forms of financing in satisfying shorter-term requirements, even where the largest borrowers are concerned. It could also be argued that, even if there is a significant shift towards direct forms of financing, banks would be well placed to provide the associated services of origination, underwriting and distribution.
2.3.3 Households
The data in Figure 4 illustrate the household sector's position as a net holder of financial assets and show that both sides of the aggregate household balance sheet have undergone a trend expansion over several decades. Notwithstanding this trend, and the fluctuations in some of the balance-sheet components, an immediately striking feature of the asset side of the balance sheet is the relative stability of household deposit holdings. These currently stand at just under 40 per cent of GDP and have shown only minor fluctuations around a very gradually rising trend since the early 1960s. There seems to be reasonably close substitutability among deposits of competing intermediaries, suggested by the fact that the trend in total deposits is much more stable than either the bank or non-bank components of that aggregate. This could be argued to be consistent with a fairly stable level of desired deposit holdings relative to income, driven essentially by transaction and short-term saving requirements, with the institutional split between banks and non-banks being influenced by the relative attractiveness of their interest rates.[9] This behaviour can be contrasted with the much greater variation in household assets held with life insurance and superannuation funds, which did not appear to give rise to any offsetting fluctuations in deposit holdings. In other words, household behaviour seems to make a clear distinction between deposits with intermediaries and balances with funds managers.[10]
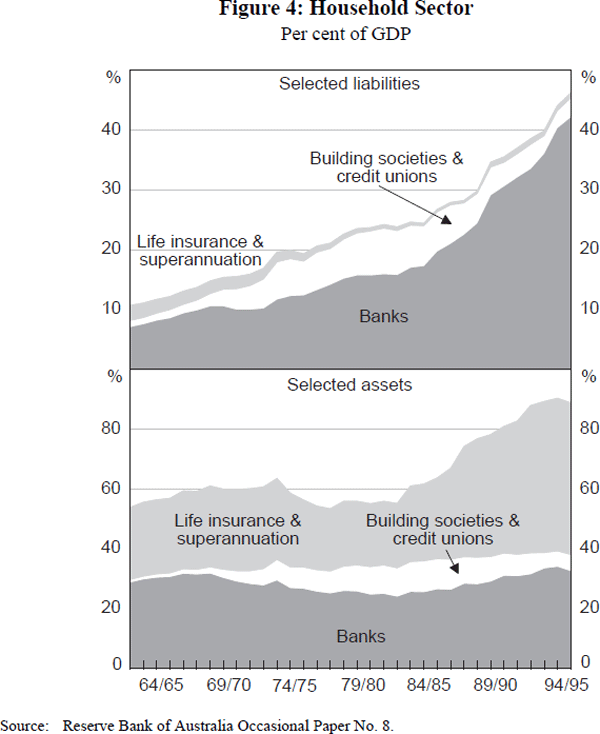
On the other side of the balance sheet the most important item is lending for housing, which accounts for around three-quarters of personal sector borrowing. Growth in overall borrowing by the household sector shows no sign of abating and, as in other areas of financial intermediation, banks have gained a strong recovery in market share since the mid 1980s, although very recent developments are putting that share under pressure.
3. Financial Intermediation and Securities Markets
Within the intermediaries sector, two main trends have been important in shaping the competitive environment. The first, already outlined in Section 2, was the development of financial regulatory policy and its interaction with performance of the different groups of intermediaries. In broad outline, banks lost market share up to the mid 1980s but regained it rapidly once deregulation allowed them to compete for business on more equal terms. As is evident referring back to Table 1, banks now dominate the intermediation sector to an extent not seen since the 1950s and 1960s, accounting for almost 80 per cent of the total assets of this group of institutions. But it is worth underlining the ease with which business could move back and forth between banks and non-bank intermediaries as competitive advantages shifted.
The second trend, to be elaborated further below, has been the unbundling of the banks' traditional product mix. This refers to the increasing capacity for new entrants to bid separately for components of banks' traditional business without offering a comprehensive range of banking services. This trend has potentially far-reaching consequences for the financial sector since it suggests that, even in an environment where banks are not hampered by regulatory constraints, there may be increasing competitive pressure on the most profitable parts of banks' traditional business base.
3.1 The Bank Product Mix
As was argued earlier, the traditional mix of products provided by banks can be viewed in broad terms as comprising three elements – deposit-taking, lending and providing transactions services. This of course has never been the complete picture and in recent years bank activities have expanded well beyond the traditional product range, as evidenced by the growing proportion of banks' income arising from fee-related activities as opposed to net interest earnings. Nonetheless, net interest income continues to provide the bulk of the aggregate profits of Australian banks, indicative of the fact that traditional intermediation services remain a central part of their overall business.[11]
An important issue to be addressed in relation to the basic economics of the banks' product mix concerns the extent to which the joint products within the mix are inherently separable. In other words, to what extent can the markets for these services be competed for separately rather than delivered jointly by ‘full-service’ institutions? Historical trends suggest that there has always been at least some scope for specialist institutions to compete with banks on a partial range of services. Important examples in the 1960s and 1970s were the building societies and finance companies, which could be thought of as offering limited ranges of deposit and lending services independent from the more comprehensive services, including transaction facilities, available from banks. These institutions grew rapidly in those decades (Figure 5), although the growth was much more a result of their ability to operate outside of key regulatory controls than to the specialist characteristics of their product lines.
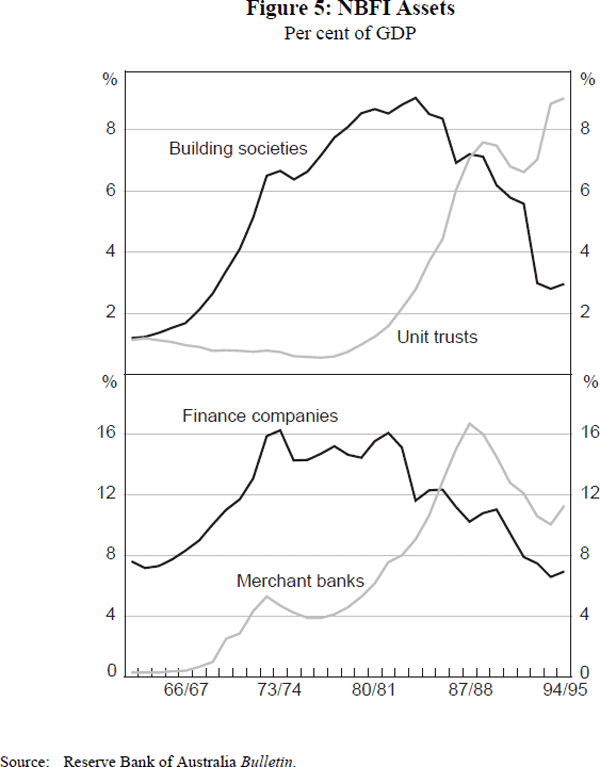
A much more important spur to competition for specialist lines of business came with the growth in size and liquidity of securities markets in the late 1970s and early 1980s. This allowed specialist institutions either to finance their lending activities by raising funds in liquid securities markets, or to operate effectively as retail deposit-takers while investing their funds in securities rather than loans. In other words, the development of securities markets helped to make possible the provision of deposit and lending services by separate institutions.
Three examples can be cited as illustrative of the process.
First, on the deposit side, was the growth of cash management trusts, the first of which was established in 1981. Although these are, strictly speaking, funds-management rather than deposit-taking institutions, they offer a service that from the point of view of the customer is akin to a short-term retail deposit offering close to wholesale rates of interest. Cash management trusts remain relatively small in aggregate (currently with around $7 billion in total assets, or around 3 per cent of aggregate household deposits) but have had an important impact on competition for the marginal depositor, and hence on the pricing of banks' own deposit services. In this way they have contributed to the competitive pressures that have seen a steady erosion of banks' low-cost deposit base.
A second example, on the lending side, was the growth of merchant banking. This occurred in two distinct phases – one in the late 1960s and early 1970s, and the other in the 1980s (see Figure 5). Asset price inflation and an expanding demand for credit played a role in both episodes, with these institutions being active lenders at the more speculative end of the risk spectrum. Regulatory constraints on banks also clearly played a big role in the earlier episode but it is significant that merchant banking activity continued to expand rapidly in the mid 1980s after those constraints on banks were removed. The merchant banking sector engages in a wide range of financial activities but an essential characteristic of much of their activity is to provide loans to businesses, funded by borrowing in domestic financial markets or from non-residents. In this way, they perform the lending and credit assessment functions associated with traditional banking without engaging in retail deposit-taking. Merchant bank assets expanded to a peak of around 13 per cent of the financial intermediaries sector in 1988 but then contracted sharply for several years. They nonetheless remain a significant presence as the largest of the non-bank intermediary categories, currently accounting for just under 10 per cent of total intermediaries' assets.
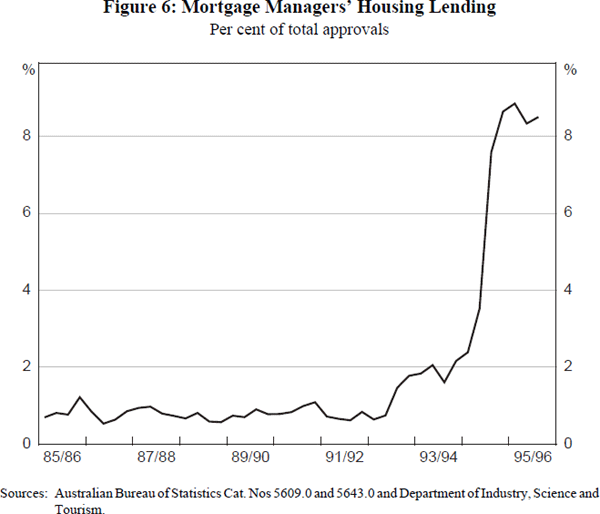
The third and more recent example of specialist competition is the growth of mortgage managers. These have been in existence since at least the 1970s but it is only in the past few years that they have grown dramatically and emerged as a significant, though still small, competitor to banks in the housing loan market. They currently account for about 8 per cent of new housing loans, compared with a market share of less than 1 per cent only a few years ago (Figure 6). Mortgage managers arrange housing loans largely funded by the issue of mortgage-backed securities that are in turn mainly held by institutional investors. The growth of this market provides a good illustration of the potential for separation of lending from deposit-taking functions in the financial intermediation sector, and also illustrates the role that funds managers can play as providers of funds to specialist institutions.
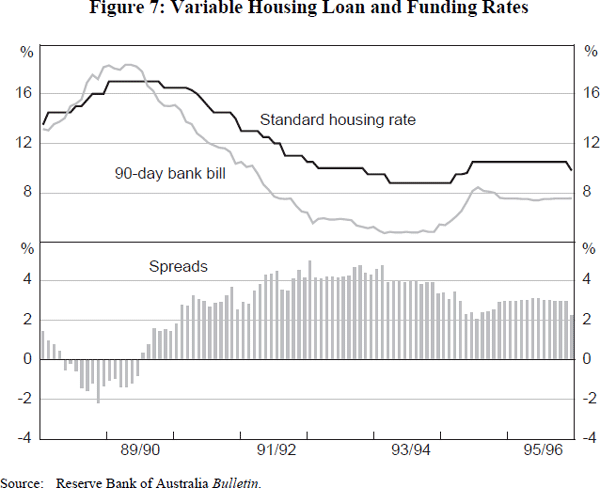
The market opportunity for mortgage managers arose from a number of factors, discussed in more detail below, that contributed to a widening of the gap between standard housing loan rates and money-market interest rates; this was particularly evident in 1992 and 1993 when the gap was around 4 percentage points, though it has since narrowed considerably (Figure 7). By comparison, rough estimates suggest that mortgage managers can deliver a residential mortgage product at the bank bill rate plus around 150 to 200 basis points. The widening of the banks' interest differential in this area could be argued to have been partly a cyclical phenomenon; banks typically smooth out the path of mortgage interest rates relative to money-market rates and this means that the difference between the two is likely to be largest at the bottom of the interest rate cycle. But there is also an important structural dimension to this issue (discussed in detail below). Increasing competition for deposits, and a desire to preserve average profit margins, have meant that the overall structure of bank interest rates on both the deposit and lending sides have moved up relative to money-market interest rates. This created the opportunity for specialist lenders, funding themselves at money-market related rates, to undercut the banks and put pressure on banks to lower margins.
It should be noted that the process of disentangling traditional banking products by specialist institutions or entities is still in its infancy in Australia. In the United States, where disintermediation has been a feature of the financial system for a decade or more, almost two-thirds of residential mortgages and half of the outstanding credit card receivables are now funded through the wholesale markets via securitisation programs. Other entities, such as state and local authorities, are increasingly looking beyond the banking system to fund their activities via the issue of securities backed by their receivables (water, electricity, gas etc). These practices have the potential to erode further the traditional market for bank funding in the United States and there is no reason to believe, in principle, that a similar process could not take hold in Australia. The issue, essentially, is the efficiencies which can be derived out of the intermediary structure as opposed to the efficiencies of separately producing each of the services implicit in the intermediation process.
3.2 Competition and Margins
An important influence on these competitive developments has been the traditional pricing structure of the banks' joint product mix. This has typically involved very low fees for transactions services, with bank revenue essentially coming from the net interest margin, a system often described as one involving ‘implicit’ interest payments to deposit holders in the form of free or low-cost transactions services. This pricing structure was sustainable as long as there were reasonably strong natural barriers to the separate production of banks' core services, which was essentially the case up to the 1970s. As noted above, the absence of well-developed securities markets meant that lending and deposit services could not be separately provided, and there was little scope to provide transactions services independently of deposit-taking facilities. The key subsequent development is that, to an increasing degree, separate production of these services is now possible and, as illustrated earlier, the new ‘production technology’ for basic deposit and lending services is increasingly one which does not require extensive branch networks. To the extent that this is the case (and the trend is still at an early stage) it means that the economic function of branch infrastructure should be viewed as being related primarily to transactions rather than intermediation services. This in turn suggests that, under the prevailing price structure, the provision of transactions services by banks is essentially loss-making and has to be cross-subsidised from net interest earnings.
The pricing structure described above is clearly not one the banks would ideally want. There is a strong economic logic to pricing transaction services more in line with costs, and indeed a wide range of transactions fees have been introduced by banks in recent years. These appear however to remain well short of full cost recovery.[12] The low-price regime on transactions services is essentially inherited from history and banks have faced strong public resistance to changing it. Nonetheless, the situation seems unlikely to be sustainable indefinitely, and changes are occurring. Banks will be unable to compete with specialist institutions while they are required to cross-subsidise payments services which their competitors do not offer.
The need to cross-subsidise transactions services and maintain an expensive infrastructure network have important implications for banks' competitive position, particularly when viewed in conjunction with another development, the decline in banks' low-cost deposit base (Figure 8). Low-cost deposits – defined here as non-interest-bearing accounts, statement savings accounts and passbook accounts – currently represent about 12 per cent of the major banks' total liabilities. This is down from over 50 per cent in 1980 and from even higher levels in the 1960s and 1970s. The trend can be attributed to a number of longer-term factors including the effect of periods of high inflation in sensitising depositors to differences in rates of return, as well as competition from non-bank competitors. This shift in the composition of deposits has been an important source of upward pressure on banks' average cost of funds relative to money-market interest rates.
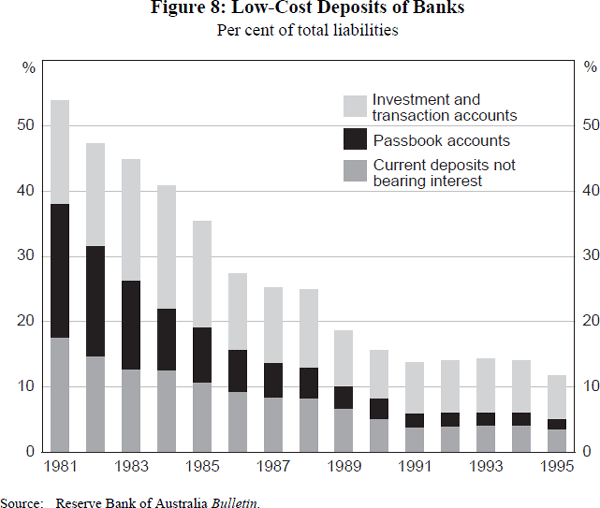
Another factor influencing this relative cost of funds in the past few years has been the decline in inflation and the consequent fall in average nominal interest rates. Since the ‘low’ interest rates referred to above had little or no scope to fall further, the general fall in market interest rates has necessarily compressed the margin between low-cost and market rates. In other words, the cost advantage derived from a given volume of low-cost deposits has declined at the same time as their share of total deposits has fallen. In a low-inflation environment, there is no reason to expect a significant reversal of this trend.
Against this background it is useful to look at what has happened to margins between deposit and lending rates. The Campbell Committee expected that deregulation would lead to reduced margins by increasing overall competition and removing constraints that had channelled competition into non-price areas such as the extension of branch networks (Valentine 1991). There has been considerable debate as to whether these and other expected benefits of financial deregulation have been realised, and some borrower groups such as small businesses have expressed concerns recently about high margins.[13] These concerns partly reflected the fact that key lending rates fell less than one-for-one with cash rates during the extended period of cash-rate reductions in the early 1990s, which was in turn related to banks' tendency to smooth their main lending rates over the course of a cycle. There was also concern that heavy loan-losses incurred by banks made them reluctant to cut gross margins.
The data presented in Figure 9 summarise a number of aspects of these issues. They suggest that average margins have been fairly stable although showing some tendency to fall since the early 1980s. Two features of the data seem particularly striking. The first is the way that average deposit rates and average lending rates have moved together over the course of a number of interest rate cycles. These averages seem much more closely related to each other than to developments in general securities-market interest rates such as the 90-day bill rate. Secondly, abstracting from cyclical movements, both deposit and lending rates have moved upward relative to the bill rate over a period of time. This is true both for the averages depicted in the upper panel of Figure 9 and for the main indicator lending rates. Similar behaviour has been observed in a number of other OECD countries that deregulated their financial systems.[14]
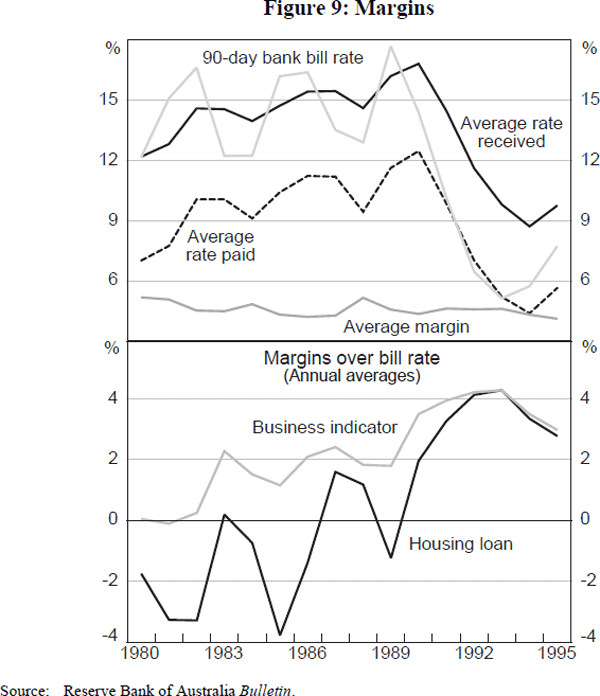
In the light of the preceding discussion this behaviour can be interpreted as consistent with a form of joint-product pricing that aims to preserve average margins. With competition having been stronger on the deposit than on the lending side, average deposit costs have moved upward, and the cost of cross-subsidising transactions services has effectively been shifted from depositors to borrowers. It is this pricing structure that is now under pressure from specialist lenders.
The banks have been responding to these pressures on a number of fronts. In the housing loan market, banks have substantially narrowed the gap between their standard mortgage rates and the bill rate in the past two years, first by raising mortgage rates less quickly than the bill rate during 1994, and more recently by interest rate reductions that were a direct response to the competitive pressures outlined above. They also introduced reduced-rate loans like ‘honeymoon’ loans and ‘no-frills’ loans. More generally, the retail banks seem to be adopting marketing strategies that emphasise the full-service nature of their products, aiming thereby to differentiate themselves from more specialist institutions. In this regard the ability to smooth interest rates gives standard bank loans a potentially attractive characteristic compared with the new securitised loans.
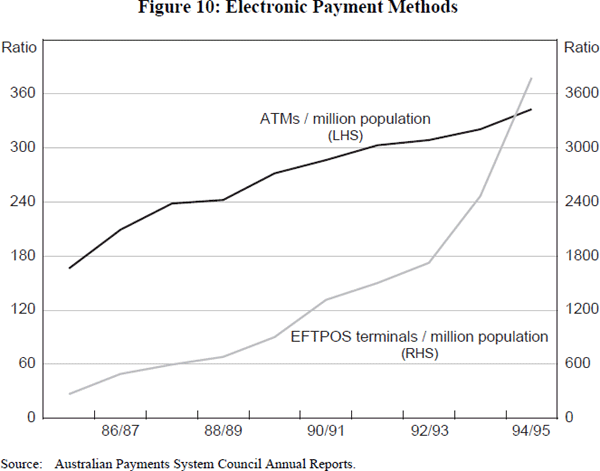
Banks have also sought to reduce costs through measures to increase operating efficiency, particularly through reductions in branch and staff numbers. Increased account fees can also be thought of primarily as a cost-containment measure, since these fees are still pitched well below cost and appear to be designed mainly to discourage excessive use of transactions facilities. Particularly important has been the structuring of fees to encourage a shift to electronic payment methods. There has been considerable expansion of the ATM network and the number of EFTPOS terminals in recent years (Figure 10), and these and other card-based payment systems now account for more than half the volume of remote payment transactions.[15] A byproduct of this technology, however, and of banks' relatively low transaction charges, has been a greatly increased capacity for bank customers to make low-value transactions. To an important degree the result has been to stimulate demand for additional transactions services rather than significantly displacing demand for over-the-counter transactions at bank branches.[16] Thus, the general logic for higher transactions charges remains powerful.
Against the background of these developments, banks have also set their eyes increasingly on the burgeoning superannuation and funds-management sector as a potential long-term offset to these pressures. Aggregate funds under management currently total over $300 billion and, on latest estimates, banks already control around 25 per cent of that total. Growth of banks' activities in this area has been rapid over the past five years (Table 4). The question of how banks (narrowly defined) can effectively insulate themselves (and their depositors) from the activities of their funds-management subsidiaries will be one of the ongoing issues facing supervisors and regulators. Another is the extent to which banks should be permitted to offer, or conceivably could offer, superannuation products of some form through their own balance sheets.
| 1990 | 1991 | 1992 | 1993 | 1994 | 1995 | |
|---|---|---|---|---|---|---|
| Life office groups | 45 | 45 | 44 | 42 | 39 | 39(c) |
| Banking groups | 21 | 23 | 23 | 25 | 26 | 25 |
| Other | 34 | 32 | 33 | 33 | 35 | 36 |
|
Notes: (a) Excludes general insurers. Source: Reserve Bank of Australia. |
||||||
It should be emphasised that the competitive pressures, and potential responses analysed in this section are still emerging. Bank profits, on the whole, remain high if judged by recent results and the real pressures would appear to lie ahead.
3.3 Impact of Foreign Banks
Only two foreign institutions operated continuously as authorised banks in Australia in the postwar period prior to 1985.[17] The absence of a wider foreign banking presence reflected the moratorium on foreign bank entry, discussed earlier, that had effectively applied in Australia since the war. Despite these restrictions, foreign banks did participate in the Australian financial sector via three main channels – through correspondent banking arrangements with Australian banks, through lending to Australian borrowers facilitated by the presence of representative offices and, most importantly, through the activities of foreign-owned or partially owned merchant banks. The merchant banking sector accounted for about 5 per cent of the assets held by intermediaries by the late 1970s and much of that related directly to the activities of foreign-owned institutions.
The emergence of a ‘foreign bank presence’ in Australia in the absence of ‘authorised foreign banks’ represents what, with hindsight, appears to have been a novel approach to the definition of banks and non-banks within the Banking Act 1959. Section 11 of the Act, for example, draws a distinction between those ‘persons’ wishing to ‘carry out banking business’ and those wishing to ‘carry out the general business of banking’. The latter required a formal banking authority while the former could be exempted from that requirement. Nowhere, however, were the activities which constituted the ‘general business of banking’, as distinct from the ‘business of banking’, specified. Those institutions successfully seeking an exemption under section 11 became part of the non-bank sector. Large numbers of foreign banks entered the Australian market by this mechanism.[18]
A more formal opening of access to the domestic banking system was an important focus of the Campbell Committee. In outlining the case for foreign bank entry, the Campbell Committee argued that foreign banks would add to the competitiveness of the system. The Committee also warned that the contribution foreign banks could make to improved competition should not be exaggerated, given that they were already present in the market. There was a strong sense however that, as banks, such institutions could provide a more comprehensive array of banking services (especially in the retail area), could structure themselves in more efficient ways, and could generally be more competitive than as non-bank entities.
The relaxation of foreign bank entry announced in 1984 saw a limited number of pre-existing non-bank institutions convert to bank status in response to an invitation from the government. There was, in addition, an injection of a number of genuinely new banking entrants and an expansion in the number of foreign banks operating as merchant banks.[19] One feature of the entry requirement was that foreign banks assumed a subsidiary rather than a branch structure. This was based on a view that to engage in the full range of banking activities in the Australian market, which encompassed both wholesale and retail activities, it was desirable from a prudential perspective to require capital to be held locally. In addition, it was felt that capital should also be set at a relatively high absolute level to encourage applicants with sufficient financial standing.[20]
The experience of foreign banks from the mid 1980s to the end of the decade, and their impact on the Australian banking system, proved to be mixed. At one level, the introduction of new banks, and the perception of the competition they would bring to the market, brought a new competitive focus to the entire banking system. There were some concrete examples of that process relatively early on. Some of the innovations in retail banking in the mid 1980s, for example, such as the payment of interest on current accounts and improvements to credit card facilities, flowed from the foreign banking sector and were quickly taken up by Australian banks. On the wholesale side, foreign banks continued their ‘merchant banking’ activities and in that sphere were innovative in product development and in financial and derivative markets. In terms of overall assets, however, the picture was less noteworthy. As a group, foreign banks quickly established around a 10 per cent share of total banking system assets, as assets were shifted from the non-bank to the banking sector, and that proportion was broadly maintained over the remainder of the decade. With only very minor exceptions, foreign banks were not able to make an impact on the dominant position of the Australian banks in the retail and commercial market, where large customer franchises had been established through extensive branch networks.
A second round of foreign bank entry began in 1992 when a generally more open-ended policy was adopted. In contrast to the position taken in the mid 1980s, foreign banks were encouraged to apply for authorisation at any time and in any number and, provided they met the entry requirements, they were permitted to adopt either subsidiary or branch structures. Where a branch structure was chosen, the bank was not permitted to participate in retail finance activities on the grounds that full local supervision and the depositor protection arrangements of the Banking Act could not realistically be applied.[21] A number of foreign banks strongly challenged this view but the policy was maintained and remains in force.
The number of foreign entrants increased significantly from 1992 (Table 5). Overall, however, the activities of foreign banks remained relatively small compared to the long-established Australian banks. Their share of banking system assets rose to 14 per cent by 1996 as a result of new entries but, with only minor exceptions, their activities remained heavily focused on wholesale or institutional markets.[22]
| 1984 | 1986 | 1988 | 1990 | 1992 | 1994 | 1996 | |
|---|---|---|---|---|---|---|---|
| Branches | 2 | 3 | 3 | 3 | 3 | 8 | 17 |
| Subsidiaries | 0 | 15 | 15 | 15 | 14 | 13 | 13 |
| Total | 2 | 18 | 18 | 18 | 17 | 21 | 30 |
|
Source: Reserve Bank of Australia. |
|||||||
3.4 Financial Markets
Growth of financial-market activity has been a major feature of financial-sector development since the 1970s. Important early developments were the freeing of the CD rate in 1973, subsequent growth of the CD and commercial bill markets, and the introduction of a bill futures market in 1979.[23] Additional impetus came from the introduction of market tenders for treasury notes (1979) and government bonds (1982) and the float of the exchange rate and removal of exchange controls in 1983. New foreign bank entrants after 1985 further stimulated growth and innovation. Another important factor has been the growth of the funds-management sector and the associated demand for risk-management and financial-trading services. In a sense, the increasing liquidity of the main financial markets created a momentum of its own by making it increasingly possible to compare funds managers' performances over short periods and thereby stimulating competition among them as to comparative rates of return. This in turn generated demand for high-frequency financial trading and for new instruments of risk management. Financial-market volatility was itself also a factor in stimulating trading activities and demand for risk-management products.
Important areas of growth were in the markets for foreign exchange and interest-rate products, where turnover grew dramatically in the late 1980s. The other area to expand rapidly was that of financial derivatives, including foreign exchange and interest rate futures, forwards, swaps and options. In many of these areas, the Australian market is quite large in international terms. Australia has the ninth largest foreign exchange market and the sixth largest interest rate futures market in the world, ahead of a number of countries with much larger economies. The markets have also become increasingly sophisticated, though the products most heavily traded have been at the simpler end of the spectrum. Issuance and trading of corporate bonds remain relatively small, however, underlining the point that the growth of financial markets has been primarily related to the risk-management function of these markets, rather than to any shift to securitisation of financial flows to the business sector. Growth of the main markets is summarised in Table 6.
| Year ended June | Commonwealth treasury bonds | State govt bonds | Bank bills | Equities | Promissory notes | Foreign exchange | |||||
|---|---|---|---|---|---|---|---|---|---|---|---|
| Physical | Futures | Physical | Futures | Physical | Futures | Swap | Spot | Forward | |||
| 1980 | 0.1 | — | — | — | — | 0.03 | — | — | — | — | — |
| 1985 | 0.3 | — | — | 0.3 | 0.5 | 0.07 | 0.07 | — | 0.8 | 2.0 | 0.3 |
| 1990 | 1.2 | 1.7 | 2.0 | 1.7 | 11.4 | 0.23 | 0.19 | 0.5 | 7.5 | 8.6 | 1.4 |
| 1995 | 6.0 | 6.0 | 2.9 | 1.0 | 19.0 | 0.47 | 0.44 | 0.8 | 14.0 | 7.2 | 1.0 |
|
Source: Reserve Bank of Australia Bulletin and Occasional Paper No. 8. |
|||||||||||
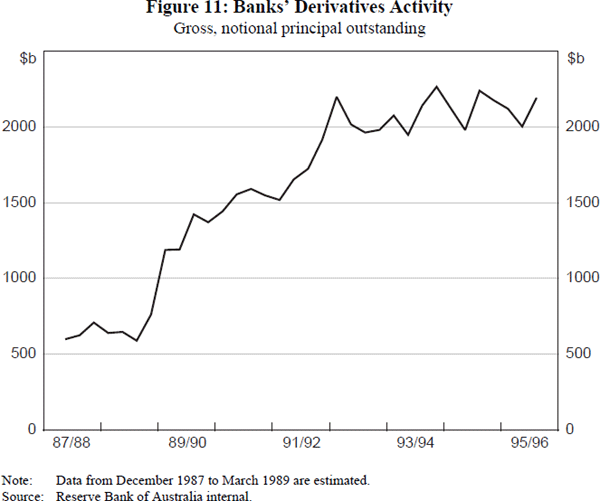
Much of the development and innovation in these markets occurred within the banking system. Similarly, trading activity in the new financial markets has been largely dominated by banks. For example almost 90 per cent of foreign exchange dealing and around 80 per cent of over-the-counter interest-rate derivatives dealing fell to these institutions.[24] Figure 11 shows the rapid expansion in banks' derivative activities, especially over the latter part of the 1980s. Financial market growth has thus provided an important field for banks to expand their activities during the post-deregulation period.
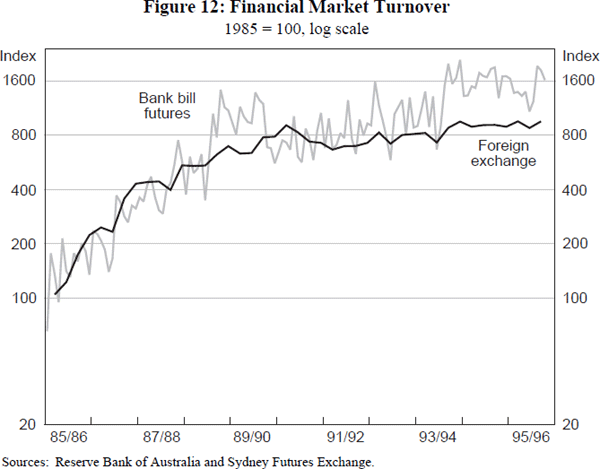
Financial market trading is highly competitive and margins on established products generally thin. This has been increasingly the case in recent years. Good returns can be obtained if new products or new financial markets can be exploited but growth and profitability potential decline as the ‘product cycle’ matures. This phenomenon is clearly evident in the two largest financial markets (foreign exchange and bill futures) illustrated in Figure 12, although to some extent the recent slower growth may be related to more stable trading conditions and a consequent reduction in demand for risk-management products. A number of major market players have reduced their financial trading activities or withdrawn from particular segments where profitability is lowest. Since 1994, many banks have greatly scaled down their proprietary trading (active position taking).
This characteristic of the product cycle suggests that future profitability of financial market activities will depend on continued growth and innovation in these markets. On that score, prospects for growth are likely to be supported by continuing growth of the funds-management sector (see Section 4). The scope for continued product innovation, however, is hard to predict. Equity and commodity-related derivatives are gaining in interest amongst the more specialist market players and the more sophisticated institutions have begun to investigate the potential offered by the development of other new markets, such as the emerging market for electricity in a number of Australian states. There is also a very tentative examination of the scope for developing credit derivatives by some institutions, an innovation that is still in embryonic form even in the United States. Many institutions are looking also at the use of derivatives to differentiate and add value to their balance-sheet products via the use of swaps and options, a potential growth area for derivative activities. The question remains, however, as to whether the next generation of developments within the financial markets will offer anything like the same potential for growth in revenues as occurred in the 1980s.
3.5 Profits, Productivity and Efficiency
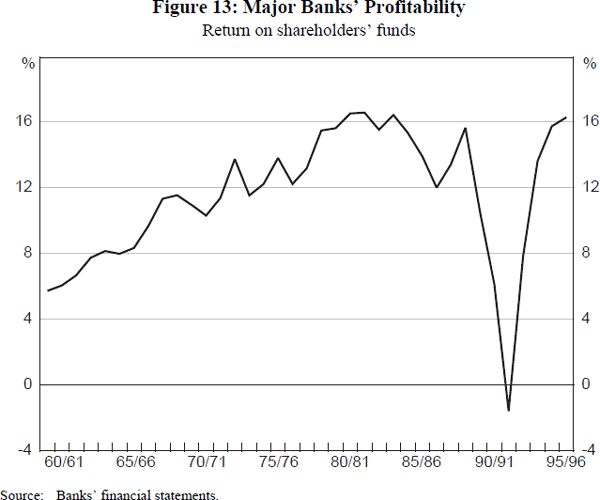
Although banking was highly regulated prior to the 1980s, with controls over most lending rates and various controls over the composition of bank asset portfolios, entry was also tightly restricted. While the former influence acted to limit profitability of the banking sector, the latter would have tended to enhance it. Available data suggests that profitability of banking in Australia, in fact, grew steadily over the 1960s and 1970s, probably reaching a peak by the early 1980s (Figure 13). At that point, profitability in banking appeared to be well above the average of other Australian industrial sectors (Table 7).
| 1980–1982 | 1990–1992 | 1994 | 1995 | |
|---|---|---|---|---|
| Banks and finance | 14.6 | 3.5 | 14.4 | 16.0 |
| All companies | 10.8 | 4.9 | 7.2 | 8.0 |
|
Source: Australian Stock Exchange Financial and Profitability Study. |
||||
The structural shifts to the financial system that followed deregulation saw some of the assumptions underlying banking in Australia begin to break down. Profitability stabilised, albeit at a relatively high level, in the first half of the 1980s as the combination of increased freedoms within the system interacted with greater potential for price competitiveness and, around the middle of the decade, increased competition from new entrants to the market. Over this period, Australian banks sought to expand their operations both domestically and internationally in the search for new sources of revenue and comparative advantage. For some banks, this process has continued to the present time. For others, the process of overseas expansion was halted and reversed in the early 1990s (see below). There were tentative signs by the middle years of the 1980s, however, that profitability in banking may have begun to ease a little from the high points of earlier years.
Further interpretation of the effects on profitability of the structural changes in the financial sector was complicated greatly in the late 1980s and early 1990s by the effects of the first post-deregulation cycle in the banking sector (and the most significant cycle in the banking system since the 1930s). Profitability in the banking system fell sharply with the collapse of the asset boom which had fuelled much of the speculative lending activity of the late 1980s, and the recession of 1990/91. While the timing of losses varied, all the main groups of banks – major, state and others – registered overall losses at some point between 1990 and 1992. Foreign banks as a group were the hardest hit with losses amounting to 30 per cent of their capital in 1990 alone. Between 1986 and 1990, aggregate foreign bank losses absorbed an amount equal to their original start-up capital. State banks lost heavily over the period (with concentrated effects in Victoria and South Australia) and some major banks suffered large losses in the early 1990s. Similar episodes of losses, in some cases more severe, were experienced in the non-bank sector (particularly amongst merchant banks) as well as in the banking systems of other countries over a comparable period.[25]
The response to the downturn in profits around the turn of the decade was a process of rationalisation which continues today. Costs, which had risen over the 1980s, became a new focus as did the viability of many of the overseas operations which had expanded in the previous decade. Domestically, the major banks especially sought to reduce the number of branches and to reduce staff levels, which had expanded rapidly between 1985 and 1989. These factors, together with improved economic conditions, and the eventual rundown in stocks of problem loans, saw profit levels in banking rise again to levels previously seen in the early to mid 1980s. Nonetheless a question mark remains concerning the extent to which banks will be able to maintain these levels of profitability as competitive forces become more pronounced in the period ahead. The widespread presumption, and one of the key themes of this paper, is that underlying banking profitability is on the wane, and it is this factor which has driven much of the debate on where the banking and financial system is headed in the longer term.
A more general question, and one that has been the subject of considerable debate, concerns the nature and extent of net public benefits from financial deregulation. The broad outlines of this debate are well known.[26] Financial deregulation was expected to bring a variety of efficiency gains, and a convincing argument can be made that many of these have been delivered – for example, increased diversity of choice for buyers of financial services, increased product innovation including a wide range of new retail banking services, higher returns to depositors and removal of non-price credit rationing induced by regulatory constraints. Moreover, as alluded to above, there are good reasons for thinking that reductions in lending margins are likely in the years ahead. The costs usually cited as coming from deregulation are those associated with the financial cycle that followed the deregulation period – the lowering of credit standards, excessive credit expansion and the resultant loan-losses and balance-sheet contraction that contributed to the severity of the early 1990s recession. Whether these transitional costs could have been avoided by alternative approaches to macroeconomic management or to financial regulatory policy is another question.[27] As far as regulatory policy is concerned, it is not clear that some sort of transition to a deregulated system could have been avoided, given the shrinkage of the regulatory base that was occurring under the old system. Of course, none of this debate is unique to Australia.
One reason that this debate has tended to be inconclusive is that there is no agreed method of measuring the financial sector's output and efficiency. Essentially two types of approaches are available – what might be termed the output and the income approaches.[28] Output-based approaches attempt to measure the production of services directly using indicators of the volume of services performed, such as transactions processed or assets under management. These measures are subject to the criticism that they do not necessarily capture the real value of output to the consumer – the argument that deregulation has induced greater financial turnover but that it is not particularly productive.[29] Income-based approaches aim to solve this problem by defining output as the real net revenue that financial intermediaries earn.[30] The problem with this is that it fails to distinguish price and volume movements – deregulation can be expected to have reduced the cost but raised the volume and quality of financial services supplied, and revenue measures do not separate these components.
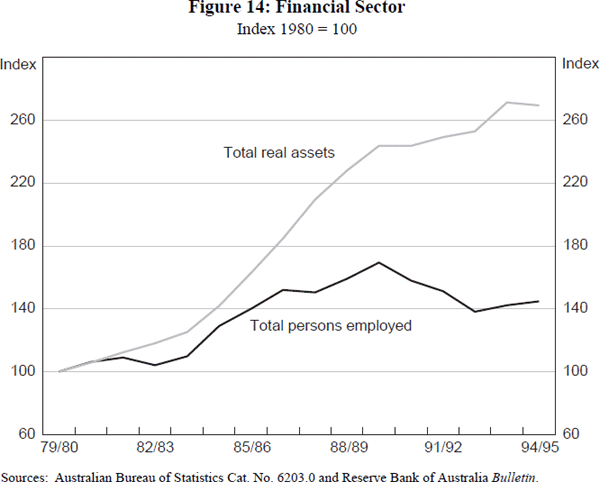
For what they are worth, simple output indicators such as the one depicted in Figure 14, based on total assets, suggest that major increases in financial-sector productivity have occurred since the early 1980s. Here it is noteworthy that, after an initial period of growth in the mid 1980s, financial-sector employment has contracted considerably, notwithstanding the continuing growth in financial activity. Moreover, in one important sense, that growth is understated by asset measures because off-balance sheet services have grown even faster. Other direct measures of productivity such as transactions processed per employee, ATM and EFTPOS facilities and the like, would similarly show major increases.
4. Funds Management
A basic distinction in principle can be made between intermediaries, which offer deposit and loan services on a capital-guaranteed basis, and funds managers, which manage but do not bear investment risk on behalf of their account holders. This distinction is reflected in the differing balance-sheet structures of the two types of institutions. Financial intermediaries require capital in order to shield depositors from investment risks whereas funds managers have a structure in which investment risk is borne by the members; in effect, members' funds are a form of equity. To a large extent the two sets of institutions have developed separately in Australia, and their structure and growth need to be explained in terms of rather different forces. It was also argued earlier that households have tended to view deposits and funds under management as quite distinct products and not closely substitutable; at any rate, the broad historical experience seems consistent with that interpretation. Nonetheless, a number of areas of growing competitive interaction between intermediaries and funds managers can be identified, including the increasing involvement by banks in funds-management activities already discussed in Section 3. The discussion that follows focuses mainly on the life insurance and superannuation sector, which comprises the bulk of the funds-management sector.[31] We first look at the historical sources of growth of these institutions and then move on to consider the issue of competition between funds managers and intermediaries.
4.1 Life Insurance and Superannuation: Sources of Growth
Historically the life insurance and superannuation sector has represented around 20 to 25 per cent of the total assets of the Australian financial system. It is currently a little above that range, having grown rapidly in recent years. The structure of the industry has been influenced by a number of major policy developments during the past 10–15 years. Three were particularly important.
The first was a shift in the tax treatment of superannuation. Prior to 1983 superannuation was taxed at extremely low effective rates, with contributions fully deductible, earnings untaxed, and only a small tax on final benefits. Subsequent tax changes (the most important of which were made in 1983 and 1988) reduced this concessional treatment substantially by introducing or raising taxes at all three of these levels; the treatment remains concessional relative to other financial savings, but much less so than previously.[32] Ironically these changes, by reducing inequities and fiscal revenue costs, laid the foundation for subsequent expansion by making private superannuation a more suitable vehicle for mandatory saving. However, the successive layers of tax changes have enormously increased the complexity of superannuation and appear to have contributed to rising administrative costs for superannuation funds.
The second main policy development was the introduction of award superannuation beginning in 1986, when the Industrial Relations Commission endorsed a claim for a general employer-provided superannuation benefit, set initially at 3 per cent of income. This benefit was gradually incorporated into employment awards as they came up for renegotiation over the next several years. Payments were directed either into existing funds or into union-created industry funds which in other respects were the same as those already in existence (that is, managed by private funds-management firms); these funds now represent the fastest-growing part of the superannuation industry, although their asset base remains small. A consequence of this history is that many of the structural features of superannuation coverage for the newly-covered employees (for example, the choice of fund, and the nature of benefits provided) are written into awards which continue to govern those basic conditions under the newer government-mandated scheme.
The third main development was the introduction of the Superannuation Guarantee Charge in 1991. This gave the mandatory system its current basic shape by legislating a timetable for further increases in contributions and setting tax penalties for non-compliance. The target level of employer contributions, to be phased in over a number of years, was set at 9 per cent. Further policies announced in 1995 specified a timetable for supplementary contributions by employees of 3 per cent, with a matching contribution from the federal government, to bring the total contributions rate to 15 per cent by 2002. These broad parameters now have bipartisan political endorsement, although the new government has indicated that the delivery method for the employee and government contributions could still be varied.
The higher contributions rates resulting from these policies can clearly be expected to have a major impact on the industry, and indeed on the financial system as a whole, in future decades – issues to be taken up by other papers in this volume.[33] Already the proportion of employees covered has increased dramatically from around one-third of private-sector employees in the early 1980s to around 90 per cent at present. But this increase has yet to have a significant impact on the sector's overall asset growth, which is largely explained by other factors outlined below.
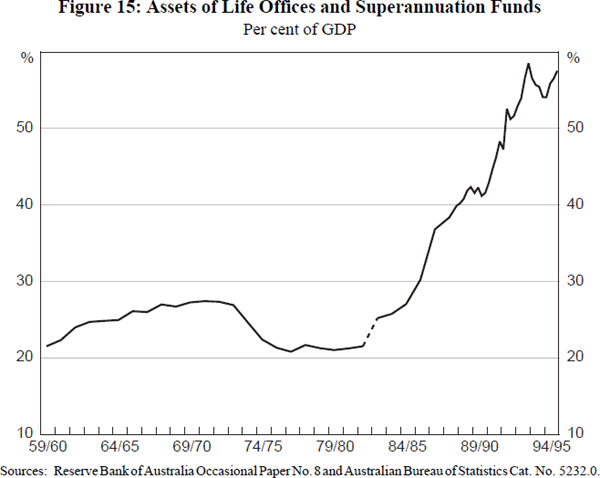
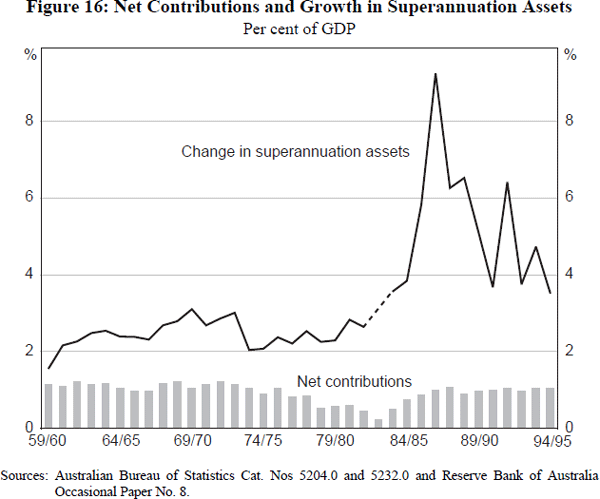
Trends in the superannuation sector's overall size and its sources of funds are summarised in Figures 15 and 16.[34] Broadly, the historical growth of the superannuation sector can be divided into three phases. The first phase, which ended in the early 1970s, was one of moderate and fairly steady growth. In the second phase, which comprised most of the 1970s, superannuation assets shrank relative to nominal GDP, largely reflecting poor earnings performance and high inflation. The third phase, from the early 1980s onward, has been one of rapid expansion in which total assets more than doubled as a ratio to GDP, although this may have slowed down in the latest few years. The data presented in Figure 16 divide the sources of superannuation asset growth between net new contributions and a residual representing earnings on existing assets and capital gains. Although net contributions have fluctuated significantly in some periods, it is apparent that most of the variation in overall growth performance is attributable to variation in the earnings and capital gain component, rather than in contributions.[35] The three growth phases outlined above correspond broadly to periods of moderate, negative, and high real rates of return on financial assets, as summarised in Table 8.
| Average earnings rate | Inflation rate | |
|---|---|---|
| 1960s | 5.2 | 2.5 |
| 1970s | 6.8 | 9.8 |
| 1980s | 14.9 | 8.4 |
| Early 1990s | 6.8 | 3.0 |
|
Source: Australian Bureau of Statistics Cat. Nos 5204.0 and 6401.0. Earnings defined as the difference between change in assets and net contributions. |
||
On the basis of currently available data, aggregate net contributions to superannuation funds do not yet show the upward trend expected to result from the compulsory plan.[36] A number of possible reasons can be given for this. First, there is likely to be a strong cyclical influence on net contributions. They fell substantially in the recession of the early 1980s, when withdrawals related to early retirements are likely to have been particularly important. This may again have been a factor in the early 1990s. In addition, many voluntary schemes contain a tranche of employee-contributed funds which do not have to be preserved to retirement but can be withdrawn on leaving a job.[37] There is also provision to allow early withdrawal of funds in cases of hardship. For all these reasons, recessions can be expected to result in significantly increased withdrawals from superannuation funds as jobs are lost. Secondly, many employers were already satisfying, at least partly, the requirements of the compulsory plan under pre-existing voluntary arrangements. This has allowed some scope for absorption of the compulsory scheme into existing arrangements, and has meant that the aggregate effect of the new compulsory schedule has so far been relatively small; but it can be expected to increase as the mandatory contributions rate increases significantly above levels currently prevailing. Thirdly, an important factor in the second half of the 1980s was the phenomenon of overfunding of existing defined-benefit schemes. High rates of return meant that surpluses were accumulated in many of these schemes, enabling the employers who sponsored them either to withdraw funds, or to finance their superannuation liabilities with reduced contributions. Finally, it is possible that increased tax rates on superannuation savings after 1983 have discouraged voluntary contributions.[38]
To summarise these trends, it is apparent that most of the variation in the growth of superannuation funds' assets in recent decades is attributable to changes in the funds' earnings rates, combined with the fact that the long-term nature of superannuation accounts tends to mean that earnings are locked in and automatically reinvested. Although a sustained lift in net superannuation contributions is projected for the future under current policies, there is little evidence of that so far in the available data. This observation is relevant to debate as to the potential for compulsory superannuation to divert household funds that would otherwise have gone to financial intermediaries.[39] On the basis of the trends outlined above, claims that this has already occurred to a significant degree would not be substantiated. Nonetheless, competition for new savings between banks and superannuation funds is likely to be an important issue in the future. Most projections of the impact of compulsory superannuation assume a degree of crowding out of other forms of saving,[40] implying a reduced flow of household funds into other savings vehicles as compulsory superannuation flows increase. To the extent that this occurs, however, it may affect households' direct asset holdings more than deposits with intermediaries, since the former are more likely to be regarded as closely substitutable with superannuation accounts.
4.2 Competition with Intermediaries
Related to this issue is the more general question as to whether the structure of financial institutions is changing in a way that brings funds managers and intermediaries more directly into competition, through overlap in their functions or increasing similarity of product lines. One aspect of this, already discussed in Section 3, is the involvement of banks in funds-management business through subsidiaries. In principle however, the existing regulatory and prudential guidelines keep these businesses separated. For example, banks are not permitted to offer funds-management products on their own balance sheets or to apply their capital directly to funds-management operations.
Putting that aspect aside, a good general case can be made that the two sets of institutions have operated in fairly distinct markets. On the assets side of the respective balance sheets, the banks' core business of direct lending can be contrasted with the life and superannuation sector's main investments in debt securities, equities and property. However, one area of overlap historically was that life offices were significant mortgage lenders for a period of time up until around the early 1970s. Their involvement in mortgage business reflected a number of conditions prevailing at the time, including the banks' inability to meet fully the underlying demand, and the relatively early stage of development of alternative mortgage lenders. The life offices were also able to link their loans with the provision of whole-of-life policies which benefited from generous tax treatment. Life-office mortgages were generally on fixed-interest terms, which meant that their profitability declined substantially as the general level of interest rates rose in the 1960s and 1970s. Total direct lending by life offices has declined steadily in relation to their balance sheet, dropping from around 40 per cent of assets in the late 1950s to around 7 per cent at present. Similarly, superannuation funds (to date at least) have only a small involvement in direct lending (Table 9).[41] The growth areas for investment by life and superannuation funds have for a number of years been in equities and foreign assets. More recently, however, some life offices have again become more active in the home-mortgage market, seeking to take advantage of the same kinds of competitive opportunities as the mortgage managers.
| $ billion | Per cent | |
|---|---|---|
| Cash and short-term bank instruments | 40.4 | 14.5 |
| Loans | 20.7 | 7.4 |
| Fixed interest | 53.7 | 19.2 |
| Equities | 99.2 | 35.6 |
| Property | 24.2 | 8.7 |
| Foreign | 37.2 | 13.3 |
| Other | 3.4 | 1.2 |
| Total | 279.0 | — |
|
Source: Australian Bureau of Statistics Cat. No. 5232.0. |
||
In terms of liabilities, the basic differences in financial structures of intermediaries and funds managers have already been noted. Superannuation fund liabilities are the long-term savings of their members, whereas bank liabilities are a combination of transaction balances, short-term savings and marketable-debt instruments. The banking system in Australia has not traditionally been an important vehicle for longer-term saving,[42] so the competition with the long-term savings institutions for household-sector funds has not been particularly strong. This short-term/long-term distinction reinforces the conceptual distinction between capital-guaranteed deposits with intermediaries, and funds-under-management which are subject to investment risk. On the basis of these two sets of distinctions, intermediaries and funds managers have historically been competing for household funds in quite different areas of the market.
In a number of respects, this neat division is becoming less clear cut. Specialist funds-management institutions, such as unit trusts, are able to offer a range of short-term investment services, some of which closely resemble deposits, and these institutions have grown substantially in recent years. Increasingly banks are offering the same services, but not on the balance sheet of the bank itself. Also important is that the superannuation sector has become a major holder of essentially mobile or short-term savings of retirees. This trend has been boosted by increasing rates of early retirement, the wide availability of lump-sum retirement benefits and the advent of rollover funds, which retain the status of tax-favoured superannuation vehicles but offer some of the characteristics of shorter-term savings.[43] This has provided a category of relatively high-wealth individuals with a highly attractive alternative to financial intermediaries for holding what are fairly liquid balances. Another important consequence of these developments is that the funds-management sector has itself become an important provider of funds to financial intermediaries. For example around $40 billion, or 15 per cent of superannuation assets are currently held as bank securities or deposits with financial institutions, a significant proportion of these institutions' liability base. Growth of these ‘wholesale’ sources of funds to the banks represents a potential source of upward pressure on their average cost of funds.
The banks clearly believe there are advantages to be gained from combining their intermediation role with funds-management activities, and have pushed for allowance of more direct involvement in retirement-saving products, as well as having introduced a range of over-the-counter investment products in recent years. These developments, and the changing nature of the funds-management sector itself, point to increasing areas of overlap between the products offered by banks and funds managers. Although the legal distinction between capital-guaranteed and other products is preserved, the system seems to be moving towards a spectrum of more closely substitutable products in place of the clear traditional dividing line between deposits and funds-management services.
5. Conclusions
A feature of the historical experience reviewed in this paper has been a widening of competition between banks and other suppliers of financial services. Developments in financial regulation have been an important, and familiar, part of the story. Regulatory constraints contributed to the loss of the banks' initial dominance of financial intermediation, and the removal of those constraints stimulated some of the important subsequent trends – a recovery in banks' market share, a general expansion in the volume and range of financial activity and stronger competition from new entrants. But to a significant degree, regulatory policies were responding to pressures for change rather than being an initiating force, and they were arguably more important in shaping the speed and timing of structural changes than their underlying direction.
The deeper underlying forces for change have been developments in technology, which transformed supply conditions in the industry, and their interaction with the cost and pricing structures of traditional intermediation. The net effect can be viewed as a general shift in the nature of the ‘production technology’ of financial services. Traditional banking involves a joint-production technology that produces deposit, lending and transactions services within a given institution. This structure has faced an increasing challenge from separate-production technologies: that is, from specialist enterprises that efficiently produce a single line of financial service, such as cash management accounts, payment services or securitised mortgages. Similarly, financial market trading can be seen as a specialist product that does not need to be part of a full-service banking operation.
This separation of basic product lines has had important consequences for the competitive position of the major banks. Already single-service providers have been able to compete vigorously with banks in key lines of business and, although banks retain a large share of deposit and loan markets, this competition has clearly begun to affect their interest margins. Competition has also put pressure on banks to reduce the cross-subsidisation of payments services, in turn contributing to the general trend towards separate pricing and production of individual services. The separation of product lines also affects the nature of the core business of banking. In contrast to the traditional structure, where the core business was readily identifiable as the joint production of deposit, loan and transactions services, there can increasingly be seen to be several separate core products, not all of which need to appear together in any one institution. In this sense, the special position of banks, at least within the financial intermediation sector, is becoming less easy to define.
It is important not to exaggerate the extent to which these trends have already progressed. The major banks continue to run large traditional deposit and lending businesses which still account for the bulk of their profits and for most of the assets of the financial intermediation sector. Securitisation is much less advanced in Australia than in several countries with otherwise comparable financial systems. Nonetheless, there has been a growing functional overlap between different providers of financial services, which can be seen as taking place on three levels.
The first level, and the one that is furthest advanced, involves competition between banks and other intermediaries. Although banks dominate the intermediation sector in terms of balance-sheet size, there is strong competition with other intermediaries and a high degree of overlap between the activities of the main groups of institutions – banks, building societies, finance companies and merchant banks. This has been amply testified by the ease with which business could move back and forth between these groups of institutions over the past few decades, reflecting the shifting advantages conferred by changes in regulatory policy.
The second level of the evolving competitive scene involves competition between intermediaries and funds managers. This is much less advanced than competition within the intermediaries sector but, in a number of respects, the traditional functional separation between intermediaries and funds managers has been breaking down. One aspect of this has been the growth of banks' own funds-management operations (although these remain separated from banks' on-balance sheet activities). At the same time there has been an increasing involvement of funds-management institutions in intermediation activities like mortgage lending. Also important has been the provision of short-term investment facilities by both banks and funds managers, which bring funds-management products more directly into competition with bank depository services.
Finally, there is a third level of potential development involving competition between financial and non-financial businesses. This has not occurred to any significant degree in Australia although there are a number of examples in overseas markets of non-financial businesses entering the market as financial service suppliers.[44]
All this raises the question of where are the remaining natural boundaries (if any) between the different suppliers of financial services. An important lesson from earlier regulatory policy experience was that regulations tended to break down where they placed artificial constraints on competition between institutions performing essentially similar functions. The analysis presented in this paper suggests that there has been a tendency for functional overlaps between institutions to increase but that, in a number of important areas (the second and third levels outlined above) this process has not yet gone very far. How far the process continues in the foreseeable future will depend importantly on the regulatory policy response, and particularly on whether policies are aimed at removing remaining institutional distinctions or reinforcing them.
Footnotes
See Edwards (1993) and Ettin (1995). An alternative view is given by Boyd and Gertler (1994). [1]
The main groups are banks, merchant banks, finance companies, building societies, credit unions and pastoral financiers. [2]
More recently, life offices have again become active in the mortgage market. [3]
A fourth element, the passive holding of government securities, is best thought of as something separate and only incidentally important in the early postwar period, rather than being part of the core business of banking; it was a product of regulation and of the high levels of government debt incurred during the war. [4]
Some caution is needed in comparing balance sheet ratios across countries because of differences in accounting practices. [5]
See Mills, Morling and Tease (1993). [6]
This figure excludes bank bill finance. [7]
Data presented by Tease and Wilkinson (1993) suggest that, in flow terms, security issuance provided funding of comparable magnitude to bank loans for the corporate sectors of both countries in the 1980s. [8]
This view is consistent with more detailed evidence presented by Dilnot (1990). [9]
A separate question concerns the substitutability between superannuation and other non-deposit stores of household saving, which is not addressed here. See Morling and Subbaraman (1995). [10]
Currently around 60 per cent of banks' income is accounted for by net interest. This figure understates the importance of intermediation business since it excludes bill acceptance fees, which are really a form of intermediation income. [11]
The Prices Surveillance Authority (1995) concludes that bank transaction services are priced significantly below cost on the basis of allocations of infrastructure costs in line with standard accounting principles. See also Burrows and Davis (1995) for a discussion of the economics of cost allocation for joint products. [12]
For a discussion of these issues in an Australian context, see Fraser (1994) and the papers in Macfarlane (ed.) (1991). See also Edey and Hviding (1995) for a discussion of other OECD countries' experiences. [13]
See Edey and Hviding (1995). [14]
See Mackrell (1996). [15]
Prices Surveillance Authority (1995), p. 179. [16]
The Bank of New Zealand and Banque Nationale de Paris. The Bank of China also operated up to 1972, re-opening in 1985. [17]
The Financial Corporations Act 1974 provided that all institutions satisfying the definition of ‘money market corporations’ (merchant banks) automatically gained a section 11 exemption under the Banking Act. [18]
The decision to allow an increase in the number of merchant banks operating in the market was against the background of the decision that only a limited number of new banking authorities would be issued. In all, 16 applicants for banking authorities were accepted of a much larger number that applied. [19]
A minimum Tier 1 capital requirement was set at $20 million, and subsequently increased to $50 million. [20]
For these purposes, retail activities were defined in terms of retail deposit-taking. In brief, branches were not permitted to take deposits from customers unless the initial deposit amount was $250,000 or more. Any deposits taken within foreign bank branches were not extended the benefits of the depositor protection provisions of the Banking Act. [21]
The noteworthy exception was Citibank which established a highly innovative retail operation. It was very small, nonetheless, relative to most of the established banks. [22]
This was the first interest rate contract offered on an exchange outside the United States. [23]
For a review, see Reserve Bank of Australia (1996). [24]
Similar experiences occurred in a range of different countries over a comparable period (the United States, Japan, parts of Europe and Scandinavia). This suggests that the processes which led to the cycle in the banking sector in Australia were not unique and may have been derived from basically similar underlying causes (Macfarlane 1989; Borio 1990; and BIS 1993). [25]
See Perkins (1989), Harper (1991), Phelps (1991) and Edey and Hviding (1995). [26]
Concerning issues of macroeconomic management, and specifically monetary policy, see Macfarlane (1991). [27]
For further discussion of these conceptual issues, see Colwell and Davis (1992). A third approach, where output is measured by the volume of inputs, essentially assumes zero productivity growth. [28]
See Stiglitz (1993). [29]
This is essentially the approach taken in the national accounts. [30]
Cash management trusts and other unit trusts are also usually classified as funds managers, although in some respects (particularly in the case of cash management trusts) their activities resemble those of deposit-takers. Some aspects of these institutions are discussed in Sections 2 and 3. [31]
Fuller discussions of these tax issues are provided by Edey and Simon (1996) and FitzGerald (1996). [32]
Projections by Knox (1995) suggest that the superannuation sector could roughly double as a ratio to GDP, from its current level of 40 per cent, over the next 25 years, eventually reaching something like four times GDP when the system reaches its peak asset holdings. [33]
For statistical purposes this discussion treats life insurance and superannuation funds as a single aggregate because their activities are similar and much of the historical data does not distinguish between the two. [34]
Capital gains are likely, however, to be understated in the 1960s and 1970s, and overstated in the early 1980s, as a consequence of the widespread use of historical-cost valuations prior to the 1980s. [35]
These data should be interpreted cautiously, however, as they have in the past been subject to substantial revision. [36]
Recent regulatory changes restrict this right of withdrawal, subject to grandfathering of existing withdrawable amounts. [37]
There is also a serious longer-term policy concern: the potential for funds to leak from the compulsory scheme due to incentives favouring early retirement and dissipation of accumulated savings. See Edey and Simon (1996) and FitzGerald (1996). [38]
This issue was discussed by the Martin Committee report (1991). [39]
Official projections are discussed in Saving for Our Future (1995). These assume that one-third of the projected increase in superannuation contributions is offset by reductions in other forms of saving. Similar non-official estimates are also available. See Covick and Higgs (1995) and Corcoran and Richardson (1995). [40]
The 7 per cent balance-sheet share shown in Table 9 is likely to be overstated, as it includes loans to public authorities by public-sector superannuation funds. [41]
This view is documented by Edey, Foster and Macfarlane (1991). [42]
Following rule changes in 1992, rollover-fund operations can now be carried out within ordinary superannuation funds. [43]
See Llewellyn (in this volume) for a discussion of this trend. [44]
References
Bank for International Settlements (1993), 63rd Annual Report 1992/93, Basle, June.
Bisignano, J. (1991), ‘Banking Competition, Regulation and the Philosophy of Financial Development: A Search for First Principles’, London School of Economics, Financial Markets Group Conference, 8 November.
Borio, C.E.V. (1990), ‘Banks' Involvement in Highly Leveraged Transactions’, Bank for International Settlements Economic Papers No. 28, October.
Boyd, J.H. and M. Gertler (1994), ‘Are Banks Dead? Or, Are the Reports Greatly Exaggerated?’, Federal Reserve Bank of Minneapolis Quarterly Review, (18)3, pp. 2–23.
Burrows, G. and K. Davis (1995), ‘Costs and the Pricing of Retail Transactions Accounts’, Inquiry into Fees and Charges Imposed on Retail Accounts by Banks and Other Financial Institutions and by Retailers on EFTPOS Transactions, report prepared for the Prices Surveillance Authority, No. 65, pp. J1-J18, June.
Colwell, R.J. and E.P. Davis (1992), ‘Output, Productivity and Externalities – The Case of Banking’, Bank of England Working Paper Series, No. 3.
Corcoran, S. and C. Richardson (1995), ‘Superannuation and the Macroeconomy’, paper presented at the 24th Conference of Economists, Adelaide.
Covick, O. and B. Higgs (1995), ‘Will the Australian Government's Superannuation Initiatives Increase National Saving?’, paper presented at the 24th Conference of Economists, Adelaide.
Dilnot, A.W. (1990), ‘The Distribution and Composition of Personal Sector Wealth in Australia’, Australian Economic Review, No. 89, January, pp. 33–48.
Edey, M., R. Foster and I. Macfarlane (1991), ‘The Role of Superannuation in the Financial Sector and in Aggregate Saving: A Review of Recent Trends’, Reserve Bank of Australia Research Discussion Paper No. 9112.
Edey, M. and K. Hviding (1995), ‘An Assessment of Financial Reform in OECD Countries’, OECD Economics Department Working Paper No. 154, OECD, Paris.
Edey, M. and J. Simon (1996), ‘Australia's Retirement Income System: Implications for Saving and Capital Markets’, paper presented at NBER Conference on Social Security, Cambridge, Massachusetts, August.
Edwards, F.R. (1993), ‘Financial Markets in Transition – or the Decline of Commercial Banking’, in Changing Capital Markets: Implications for Monetary Policy, Federal Reserve Bank of Kansas City, pp. 5–62.
Ettin, E.C. (1995), ‘The Evolution of the North American Banking System’, in H.J. Blommestein and K. Biltoft (eds), The New Financial Landscape: Forces Shaping the Revolution in Banking, Risk Management and Capital Markets, OECD, Paris, pp. 181–229.
FitzGerald, V. (1996), ‘An Assessment of Current Superannuation Arrangements’, CEDA Information Paper No. 44, March.
Foster, R.A. (1996), ‘Australian Economic Statistics 1949–50 to 1994–95’, Reserve Bank of Australia Occasional Paper No. 8, June.
Fraser, B. (1994), ‘Some Current Issues in Banking’, Reserve Bank of Australia Bulletin, June, pp. 9–17.
Goodhart, C.A.E. (1988), The Evolution of Central Banks, MIT Press, Cambridge, Massachusetts.
Grenville, S. (1991), ‘The Evolution of Financial Deregulation’, in I. Macfarlane (ed.), The Deregulation of Financial Intermediaries, Reserve Bank of Australia, Sydney, pp. 3–35.
Harper, I. (1991), ‘Competition: Choice and Diversity, Gainers and Losers’, in I. Macfarlane (ed.), The Deregulation of Financial Intermediaries, Reserve Bank of Australia, Sydney, pp. 63–86.
House of Representatives Standing Committee on Finance and Public Administration (Martin Committee) (1991), ‘A Pocket Full of Change: Banking and Deregulation’, AGPS, Canberra, November.
Knox, D.M. (1995), ‘Some Financial Consequences of the Size of Australia's Superannuation Industry in the Next Three Decades’, paper presented at the Third Annual Colloquium of Superannuation Researchers, Melbourne.
Macfarlane, I. (1989), ‘Money, Credit and the Demand for Debt’, Reserve Bank of Australia Bulletin, May, pp. 21–31.
Macfarlane, I. (ed.) (1991), The Deregulation of Financial Intermediaries, Reserve Bank of Australia, Sydney.
Macfarlane, I. (1991), ‘The Lessons for Monetary Policy’, in I. Macfarlane (ed.), The Deregulation of Financial Intermediaries, Reserve Bank of Australia, Sydney, pp. 175–201.
Mackrell, N.C. (1996), ‘The Cheque's Role in Today's Payment System’, talk presented to AIC Banking Conference on the Future of Cheques, 16 May.
Mills, K., S. Morling and W. Tease (1993), ‘Balance Sheet Restructuring and Investment’, Reserve Bank of Australia Research Discussion Paper No. 9308.
Morling, S. and R. Subbaraman (1995), ‘Superannuation and Saving’, Reserve Bank of Australia Research Discussion Paper No. 9511.
Perkins, J.O.N. (1989), The Deregulation of the Australian Financial System: The Experience of the 1980s, Melbourne University Press, Carlton, Victoria.
Phelps, L. (1991), ‘Competition: Profitability and Margins’, in I. Macfarlane (ed.), The Deregulation of Financial Intermediaries, Reserve Bank of Australia, Sydney, pp. 67–110.
Prices Surveillance Authority (1995), ‘Inquiry into Fees and Charges Imposed on Retail Accounts by Banks and Other Financial Institutions and by Retailers on EFTPOS Transactions’, PSA Report No. 65, Sydney, June.
Reserve Bank of Australia (1996), ‘Australian Financial Markets’, Reserve Bank of Australia Bulletin, May, pp. 1–10.
Saving for Our Future (1995), AGPS, Canberra.
Stiglitz, J.E. (1993), ‘The Role of the State in Financial Markets’, in Proceedings of the World Bank Annual Conference on Development Economics 1993, The International Bank for Reconstruction and Development, Washington, DC, pp. 19–52.
Tease, W. and J. Wilkinson (1993), ‘The Provision of Financial Services – Trends, Prospects and Implications’, Reserve Bank of Australia Research Discussion Paper No. 9315.
Valentine, T. (1991), ‘What the Campbell Committee Expected’, in I. Macfarlane (ed.), The Deregulation of Financial Intermediaries, Reserve Bank of Australia, Sydney, pp. 36–60.