RBA Annual Conference – 2000 What Went Right in the 1990s? Sources of American and Prospects for World Economic Growth J Bradford DeLong[1]
1. Introduction
1.1 Productivity slowdown and speed-up
In the second half of the 1970s productivity growth in the US and the rest of the OECD collapsed: the productivity slowdown. Then Chair of the President's Council of Economic Advisers, Charles Schultze, speaks of the years when the CEA's forecasts of nominal GDP growth were dead on – but their forecasts of real GDP growth were 2 percentage points too high and their forecasts of inflation were 2 percentage points too low. The causes of the productivity slowdown were a mystery at the time (Denison 1979) and remain largely a mystery even today: it was too large to be easily accounted for by oil prices, by environmental regulation, by the changing demography of the labour force, or by the shoe-leather and other identified costs of moderate inflation.
At the time economists doubted that the productivity slowdown would continue. But it did continue. And so it gave rise to what Paul Krugman (1990) called the Age of Diminished Expectations – an OECD-wide age that lasted for more than two decades of slow growth, depressing wage performance, and an increasing gap between public financial resources and the requirements of the social insurance state.
In the second half of the 1990s productivity growth in the US exploded: a productivity speed-up. Back at the start of the decade of the 1990s virtually everyone expected the Age of Diminished Expectations to continue, and for US economic growth in the 1990s to be as slow as it had been in the 1970s and 1980s: a growth rate of measured potential real GDP over the 1990s of 2.5 per cent per year. But actual measured growth in the US economy over the 1990s averaged more than 3.4 per cent per year. And since 1995 American measured real economic growth has averaged 4.1 per cent per year, with few (but some) indications that real output has materially exceeded the economy's long-run productive potential. This productivity speed-up caught economists and other observers – all save the editors of Business Week – by surprise, just as the productivity slowdown of the 1970s had.
1.2 The questions raised
What have the sources of this good – extraordinarily good – macroeconomic performance been? Why weren't mainstream economists able to see it coming beforehand? Will the productivity speed-up last as long as the productivity slowdown did, or will it vanish in the next few years? And what does the acceleration of growth in the US in the second half of the 1990s have to tell us about growth in the world in the future?
These are important questions. But they are not questions to which I can give convincing solid answers. I can only guess, and I am going to do so.
My answers – or, rather, my guesses – focus on three factors: investment, computers, and the NAIRU. One possibility is that forecasts of US economic growth made in the early 1990s undershot because they did not accurately assess either the likelihood of large-scale deficit reduction or the effect of large-scale deficit reduction on investment. To confirm this possibility would be politically convenient – it is, after all, the line pushed by White House communications. To confirm this possibility would raise my confidence that my social marginal product is positive – I did, after all, work for the Clinton administration while it was focused on deficit reduction as job one. But the reduction in the deficit was too small and the boom in economic growth too large, to attribute more than a fraction of the speed-up in growth to the correction of previous fiscal policy errors. The lever is too small, and the rock to be moved too large.
A second possibility is that past forecasts of US growth undershot because they did not accurately assess either the rapid forthcoming fall in the price of data processing and data communications equipment or the slowness with which diminishing returns to computer power would set in. This possibility looks more likely with each passing month. The pace at which prices of computer and communications hardware fall continues to rise, and the rate at which computer and communications capital grows continues to rise as well. Limited diminishing returns show themselves in a higher and higher share of GDP received as income by owners of computer and communications capital.
The almost inevitable conclusion is – as Oliner and Sichel (2000) have argued most powerfully – that the computer sector has in the past decade come of age as a macroeconomic factor. The productivity speed-up is due primarily to events in information technology.
Since there is no reason to believe that the information technology revolution is anywhere near the upper asymptote of its logistic, we can forecast with some confidence that the productivity speed-up in the US will not evaporate. And we can also forecast with considerable confidence that productivity growth rates elsewhere in the industrial core are about to accelerate: investments in computer technology that have been undertaken in the US have, by and large, not been undertaken outside the US; and investments in computer technology that have yielded high returns inside the US are likely to yield high returns outside the US as well.[2]
Thus the ultimate lessons for the future of economic growth drawn from the American experience of the 1990s have to be optimistic ones. The forces that made for rapid growth in the US in the second half of the 1990s seem likely to persist in America. These forces seem poised to be duplicated elsewhere in the world economy. At least as far as the OECD-wide industrial core of the world economy is concerned, the future today looks brighter than at any time since 1973.
2. The Growth Acceleration
2.1 Real GDP growth in the 1990s
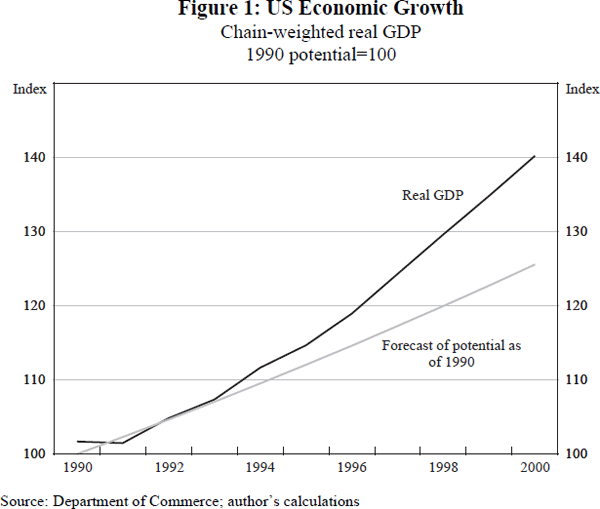
Back at the start of the decade of the 1990s, virtually everyone expected US economic growth in the 1990s to be slow – as slow as it had been in the 1970s and 1980s. Forecasts at the start of the last decade (made on a basis consistent with today's chain-weighted national income and product accounts), projected a growth rate of measured potential real GDP over the 1990s of 2.5 per cent per year or so – a 1 per cent per year increase in the labour force and employment and with a 1.5 per cent per year increase in real labour productivity.
Such forecasts were overly pessimistic. Actual measured growth in the US economy over the 1990s has averaged more than 3.4 per cent per year – nearly a full annual percentage point faster than was predicted a decade ago by the then-consensus forecasts (Figure 1).
More remarkable still is the extent to which the recent acceleration in American economic growth has been confined to the second half of the 1990s. Between 1990 and 1995 measured chain-weighted real GDP grew at a rate of 2.4 per cent per year (Figure 2).
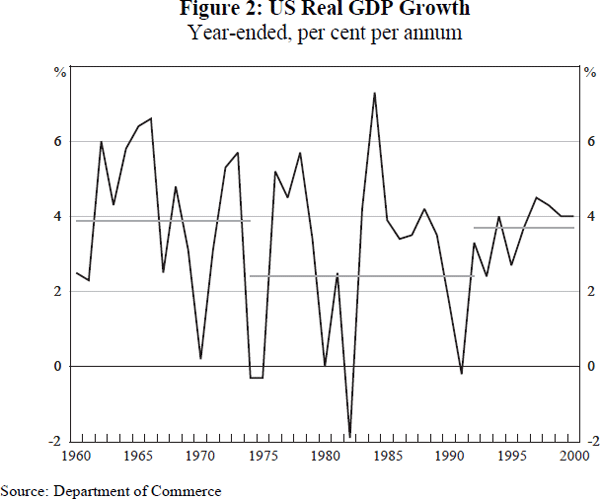
This was a fast enough growth rate for American policy-makers in the middle of the decade to be pleased with themselves, and to pat themselves on the back on their skilful management of economic policy. In the first half of the 1990s the recession of 1990–1992 had been kept mild. The subsequent recovery had carried the economy through then-current estimates of the NAIRU by the end of 1994. This recovery had been strong in spite of a substantial contractionary shift in fiscal policy toward budget balance (a shift that was expected to boost growth in the long term via capital deepening, but that many in 1993 and 1994 had worried would reduce growth in the short term by reducing aggregate demand). While all this had been accomplished, it had still proven possible to reduce inflation from 4 to 2 per cent per year.
But, as of the middle of the decade, there appeared to be few opportunities for good macroeconomic news. Unless the Federal Reserve was extremely lucky and kept exact balance, the expectation as of the mid decade was either for a severe slowing of growth or for a rapid return of rising inflation. Only the editors of Business Week were materially more optimistic.
Yet since 1995, American measured real economic growth has averaged 4.1 per cent per year with few indications that real output materially exceeds the economy's long-run productive potential. Inflation has shown few signs of rising. The broadest index of inflation, the GDP deflator, rose by 2.1 per cent between 1994 and 1995 and by 1.5 per cent between 1998 and 1999. The last six months of the core CPI show inflation at 2.6 per cent per year; the last six months of the core PPI show inflation at 0.8 per cent per year; the last six months of the GDP deflator show inflation at 2.9 per cent per year.
2.2 Inflation and unemployment
Surprisingly good performance on output growth and inflation has been coupled with unbelievably good performance on unemployment (Figure 3). The short-run inflation-unemployment trade-off in the US now appears to be more favourable than at any time at least since World War II, perhaps ever. Back in 1994, American economic forecasters argued whether the NAIRU might be less than 6 per cent. Today they argue whether it might be less than 4.5 per cent.
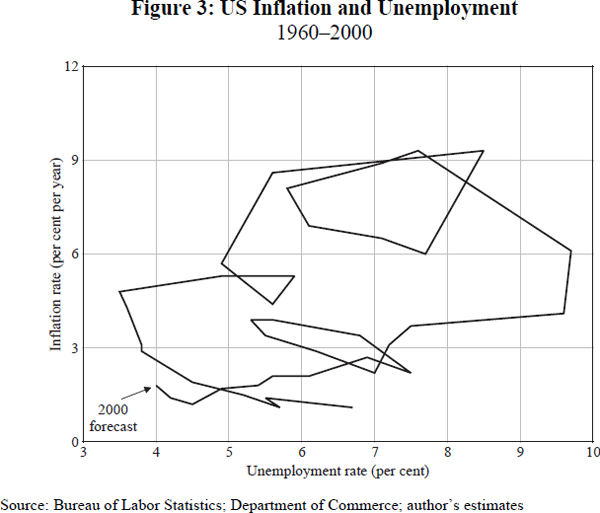
Thus the US today is some 10–15 per cent richer than mainstream economists would have dared to forecast a decade ago. It has an unemployment rate – a hair more than 4 per cent – that is two percentage points lower than mainstream economists would have dared to forecast a decade ago. And it has a much more favourable short-term inflation-unemployment trade-off than the US economy had a decade ago, when a decline in unemployment below 6 per cent set off increases in inflationary pressures reminiscent of the late 1960s or the late 1970s.
How far can standard factors and forces go in accounting for this burst of macroeconomic good news?
3. Investment
3.1 The federal deficit and low investment
At the peak of the 1982–1989 business-cycle expansion nominal spending on private investment amounted to only 15.4 per cent of GDP. Such a nominal private investment share compares unfavourably to the 16.5 per cent of GDP in nominal private investment at the peak of the 1970–1973 expansion, or to the 18.4 per cent of GDP at the peak of the 1975–1979 expansion. The 1980s expansion was the only recent one in which the nominal share of investment in GDP fell as the expansion proceeded.
The reasons for this relatively low share of investment in total spending were twofold: a decline in the private savings rate, and the large budget deficits that had emerged during the 1980s as a result of Reagan administration fiscal policy (Figure 4). (These two factors, however, were counterbalanced by the rise in foreign net investment in America – the flip side of the high trade deficits of the 1980s.)
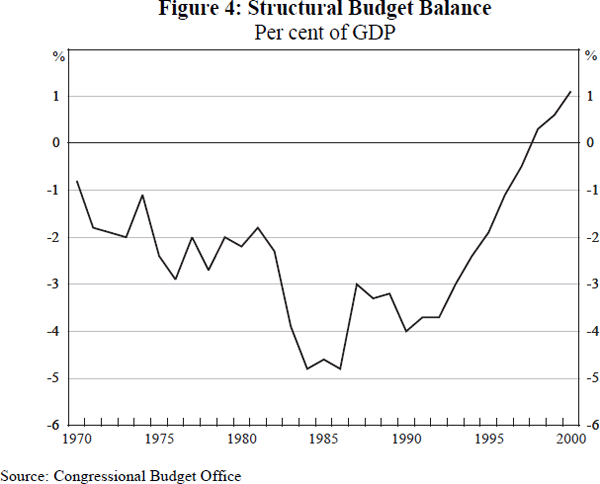
The change in fiscal policy stance since the early 1990s has been dramatic. The productivity-slowdown years of the late 1970s saw a structural federal budget deficit of some 2 per cent of GDP. The Reagan-deficit and the read-my-lips-no-new-taxes years of the 1980s and early 1990s saw structural deficits of some 4 per cent of GDP. Since 1993, however, the structural budget balance has improved steadily by 0.6 per cent per year, bringing the federal budget into surplus (although not resolving the potential long-run funding crisis of the social insurance state).
Forecasts of potential output growth made as of 1990 had to assume the continuation of large federal budget deficits and of relatively low shares of nominal investment in GDP. The political system seemed incapable of reducing the structural deficit: Democrats anxious to avoid further reductions in rates of spending growth confronted Republicans unwilling to raise taxes. Large deficits were, for each side, preferable to abandoning its core values. Given the continued decline in the private savings rate and given the expectation that continued gridlock in Washington DC would produce continued high deficits[3], a forecast of high investment in the 1990s simply did not add up.
Yet the premises of such pessimistic forecasts were wrong. Political gridlock in Washington DC did not continue. The 1990 deficit-reduction program imposed on President Bush by the (Democratic) congressional leadership cut the structural deficit from 4 to 3 per cent of GDP, and – more important – it changed the rules by which the American Congress debated and considered the budget in a way that gave a permanent structural advantage to forces pushing for deficit reduction.[4] The 1993 Clinton deficit-reduction program then cut the structural deficit from 3 to 1 per cent of GDP. And the structural deficit then vanished completely as strong economic growth led to higher revenues.
3.2 The effects of reduced deficits
What effect did the successful reduction and elimination of the structural deficit have on measured American real GDP growth? What difference does a shift in the structural budget balance from −4 per cent of GDP back to zero make? Clinton administration policy-makers early in the decade certainly hoped that deficit reduction would lead to lower interest rates, a high-investment recovery, and faster output and income growth (see Woodward (1994)[5]).
The answer depends on three factors: (a) the rate of return on capital, (b) the proportion of additional budget deficits that are financed from abroad, and (c) the impact of budget balance shifts on private saving. And it turns out that conventionally calibrated Solow (1957) growth models cannot attribute much of the acceleration in post-1995 productivity growth to the reduction in the federal deficit.
First of all, the structural deficit was not eliminated until the end of the decade. For the period relevant for growth in the second half of the decade, the structural deficit averaged 1.5 per cent of GDP – less than 4 per cent, true, but not zero.
Second, conventionally calibrated Solow growth models predict a marginal product of capital on the order of 10 per cent per year. Thus a 2.5 per cent of GDP reduction in the deficit and increase in national investment could boost real GDP growth by one-quarter of a percentage point in its first year, and by somewhat less in subsequent years as a smaller and smaller proportion of the increase in gross investment added to the net capital stock.
In all likelihood, however, the boost to growth would be lower. At least a third of the reduction in the deficit would be likely to generate not an increase in domestic investment but a reduction in the inflow of capital from overseas (see Feldstein (1993a, 1993b)). The effects of shifts in budget deficits on private savings rates remain hotly disputed, with no argument changing anyone's mind (see Barro (1974); Bernheim and Bagwell (1988)), but surely reductions in budget deficits do not increase private savings.
Thus straightforward application of the standard Solow growth model suggests that one-sixth of a percentage point per year is a good estimate for the share of the post-1995 growth acceleration that can be attributed to better fiscal policy. Switching from Solow to new growth theory models does not materially help. Even the 25 per cent per year rate of return on investment in machinery and equipment estimated by DeLong and Summers (1991) does not materially help. This is because machinery and equipment are only one part of investment; even their highly optimistic assessments of rates of return on investment can account for only one-third of a percentage point per year of the post-1995 growth acceleration.
This does not mean that deficit reduction in the 1990s was not important, or was not worth doing. But it does mean that the post-1995 growth acceleration is a much larger phenomenon than can be easily attributed to better fiscal policy: the lever is simply not large enough to move the stone. To account for the lion's share of good economic performance, we must look elsewhere.
4. Computers
4.1 Economists' scepticism toward computers
Until the past several years, economists were sceptical of claims that the computer revolution was having a material effect on the productivity of the American economy as a whole. As Solow (1987) put it, ‘you can see the computer age everywhere but in the productivity statistics’. As Gordon (1997) put it, ‘for more than a decade American corporations have been shovelling billions of dollars in computers down a black hole, with no response at all from the sluggish growth rate of American productivity’.
The most thorough and reasoned statement of this point of view came in Sichel (1997). He concluded that up through the early 1990s the information technology sector had contributed about 0.3 per cent per year to the growth of GDP (and perhaps half that to the growth of NDP, net domestic product). He went on to argue that this contribution to economic growth could not rise rapidly unless ‘the return earned by computer hardware and software… surge[d] in coming years’.
Oliner and Sichel (1994) provided the details underpinning this reasoning. The real stock of computers would grow rapidly in the future, but the real economic return to investments in computers would fall as computer prices fell. Back in the 1970s computer CPUs were carefully scheduled with batch jobs to keep their capacity utilised. Today most of the CPUs installed are idle, running Solitaire or screensavers or – in the best case – searching for extraterrestrial intelligence.
4.2 More recent estimates
Yet by the year 2000 there was a new article by Oliner and Sichel (2000) with a very different conclusion:
[the contribution to productivity growth from] the use of information technology – including computer hardware, software, and communication equipment – … surged in the second half of the [1990s]. In addition, technological advance in the production of computers appears to have contributed importantly to the speed-up in productivity growth. All in all, we estimate that the use of information technology and the production of computers accounted for about two-thirds of the 1 percentage point step-up in productivity growth between the first and second halves of the decade.
What had changed? In the first half of the 1990s the stock of computer hardware grew at about 17 per cent per year, and owners of computer hardware received 1.4 per cent of GDP as income. The contribution of computer hardware to economic growth was approximately the product of these two numbers: about 0.22 percentage points per year (Table 1). But as Oliner and Sichel (2000) calculate their estimates, by the second half of the 1990s owners of computer hardware received 1.8 per cent of GDP as income, and the stock of computer hardware grew at some 36 per cent per year – implying a growth contribution from computer hardware that had more than doubled to 0.58 percentage points per year.
| Period | 1974–90 | 1991–95 | 1996–99 |
|---|---|---|---|
| Growth rate of labour productivity | 1.43 | 1.61 | 2.66 |
| Contributions from: | |||
| – Capital deepening | 0.81 | 0.60 | 1.09 |
| – Information technology capital | 0.45 | 0.48 | 0.94 |
| – Hardware | 0.26 | 0.22 | 0.58 |
| – Software | 0.10 | 0.21 | 0.26 |
| – Communication equipment | 0.09 | 0.05 | 0.10 |
| – Other capital | 0.36 | 0.12 | 0.16 |
| – Labour quality | 0.22 | 0.44 | 0.31 |
| – Multifactor productivity | 0.40 | 0.57 | 1.25 |
|
Source: Oliner and Sichel (2000) |
|||
Oliner and Sichel then add on the benefits from increases in the stock of software capital and communications equipment, and add productivity gains not just from the use of computer technology as capital but in the production of semiconductors and other information technology products as well. They reach their conclusion that two-thirds of the acceleration in post-1995 productivity growth can be attributed to the computer sector. Moreover, Oliner and Sichel's estimates of recent contributions are not extreme. Whelan's (2000) are a little bit larger. Jorgenson and Stiroh's (2000) are a little bit – but not much – smaller.
4.3 Understanding the change
The earlier – pessimistic – conclusions about the likely contribution of computers to American economic growth were implicitly driven by a belief that investments in computers were subject to rapidly diminishing economies of scale. Thus marginal returns to computers would diminish at least as rapidly as the stock of computers and computing power grew.
Jack Triplett's (1999) estimated price indices for computers and semiconductors could show that a computer in 2000 cost one-ten thousandth as much as a computer in 1960 (Figure 5). But that would have little effect on economic growth because the marginal computer in 2000 would perform services only one-ten-thousandth as useful as the marginal computer in 1960. Thus the income share of computers in real GDP would not rise. And with a constant rate of technological progress in computers and communications, the contribution of information technology to economic growth would not rise either.
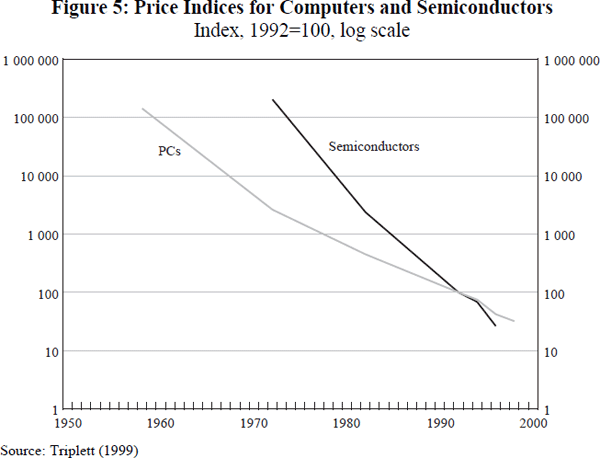
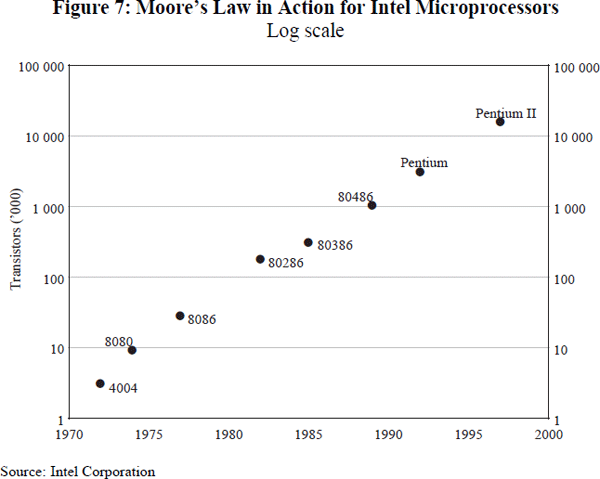
Yet these assumptions have turned out to be false. In the American economy the income share received by information technology equipment and software has grown: returns to computers have not diminished as rapidly as Oliner and Sichel (1994) expected. And the pace of improvement and cost reduction in information technology has accelerated, with no sign of any forthcoming deceleration. For two generations the folk wisdom has been that the rate of technological improvement in semiconductors and computers is constant: ‘Moore's Law’ is the rule of thumb that the density of circuits on a piece of silicon doubles every eighteen months. Yet the second half of the 1990s saw the pace of cost reduction in information technology approximately double.
4.4 Computers and investment
There remains one loose thread to be tied. Was the more-rapid-than-usual decline in computer prices driven by the increase in investment made possible by the reduction in the budget deficit? To the extent that the recent explosion in computer power and in the contribution of computers to GDP growth came about because higher-than-usual demand pushed computer manufacturers and computer users alike down a learning curve, there is a possibility that we might have had this burst earlier had investment been earlier. But the relatively low-investment, high cost-of-capital late 1980s were not an attractive time to undertake the large scale transformations of business organisation and communications that underpin the current wave of extraordinarily high investment in computers.
One possibility is that investment and productivity are very closely linked, and that a balanced budget for the US in the 1980s would have brought the productivity speed-up forward in time by perhaps five years. A second possibility is that the sudden high contribution of computers to growth hinged on key innovations that were only tangentially related to macroeconomic factors.
I cannot tie this loose end here.
5. NAIRU
Alongside astonishingly rapid productivity growth in the US in the 1990s has come astonishingly good inflation-unemployment performance. Note that the apparent large inward shift of the short-run Phillips curve is a separate issue from the productivity speed-up: it is completely conceivable that growth could have accelerated without having any effect on inflation-unemployment dynamics. But not only is the same unemployment rate associated with a higher level of real GDP as labour productivity has boomed, but the same unemployment rate is associated with a lower level of inflation.
Figure 6 shows actual inflation and the dynamic forecast starting in 1990 for the simplest of all Phillips curve models: expected inflation is equal to last year's inflation, and this year's inflation is equal to expected inflation plus a parameter times the difference between the NAIRU (here set at 6 per cent, at the low end of possible NAIRU estimates as of the start of the 1990s) and the unemployment rate.
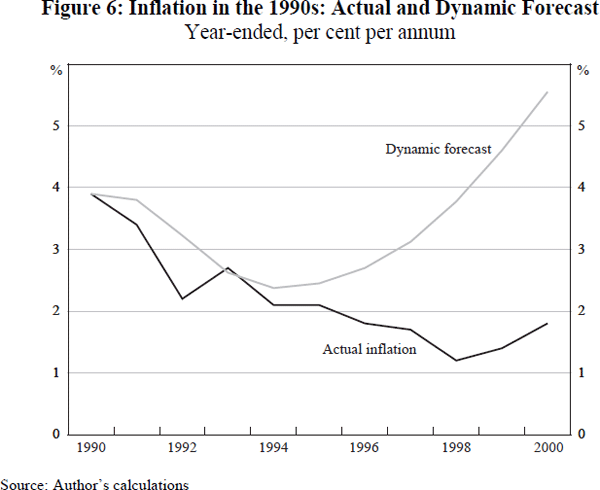
Given how low the US unemployment rate has fallen in the 1990s, the inflation rate would have been expected to be nearly 6 per cent per year by now. But it isn't: the NAIRU in the US has fallen remarkably far, remarkably fast.
There is some question whether it is worth trying to determine the causes of the fall in the American NAIRU in the 1990s. If truth be told, the standard neo-Keynesian Phillips curve never worked very well at all outside the US. Only the fact that too large a proportion of major journal editors and textbook writers lived in the US allowed it to become the default model at all. On the other hand, the standard neo-Keynesian Phillips curve did a very good job at explaining the behaviour of US inflation and unemployment from the mid 1960s up to the early 1990s.
It is entirely possible that the surprisingly good behaviour of the NAIRU in the US during the 1990s is largely unlinked to the speed-up in productivity growth. But Alan Blinder (2000) has raised an interesting possibility: a productivity speed-up can drive a wedge between the real wage aspirations of workers and the rate of productivity growth. If productivity growth suddenly speeds up but this speed-up is not generally recognised or incorporated into the wage bargaining process, then the NAIRU will fall.
This is not an equilibrium story. Unless real wage aspirations are and remain unrelated to productivity growth, such a fall in the NAIRU is likely to be temporary. As people's perceptions of productivity growth – and thus of real wage aspirations – rise to actual trend productivity growth, the wedge between wage aspirations and productivity growth will disappear. The NAIRU will then rise again.
How long are these misperception lags? I do not know. Is this theory the explanation for the extraordinarily good inflation-unemployment performance of the US in the 1990s? I do not know. It is, however, clearly a possibility. It is hard not to be struck by the coincidence of a relatively low American NAIRU during the rapid productivity growth 1960s, of a relatively high American NAIRU during the productivity slowdown period of the late 1970s and 1980s, and now a low NAIRU again during the high-productivity-growth late 1990s.
6. The Future
If the Oliner-Sichel interpretation that the speed-up in productivity growth is the result of innovations in computer and communications technology is correct – and it looks like a good bet – then obvious conclusions follow.
First, returns to investment in computer capital have run into diminishing returns relatively slowly. There is no reason to believe that this will change – no reason to believe that the marginal product of computer capital in the US is about to drop to zero. There is also no reason to believe that the pace of innovation – and cost reduction – in data processing and data communications is about to slow. Moore's Law has been good for more than three decades, and promises to hold for at least one more: few things about technology are more predictable than the continued rapid fall in computer and communications hardware prices (Figure 7).
Hence productivity growth in the US appears likely to continue to be strong for at least the next decade. The productivity slowdown is over. The Age of Diminished Expectations is past.
Furthermore, most of the rest of the world has not yet undergone the data processing and data communications revolutions that the high-tech part of the US economy has experienced. There are exceptions: Finland, for example. But throughout most of the world – even most of the developed world – the benefits of entering the information age have not been captured.
Leave to one side the implications of better communications technologies – the ‘death of distance’. Even ignoring the fall in communications costs, there is every reason to think that productivity growth outside the US is about to accelerate as well: the trail has been blazed. Imitation is often much easier than innovation.
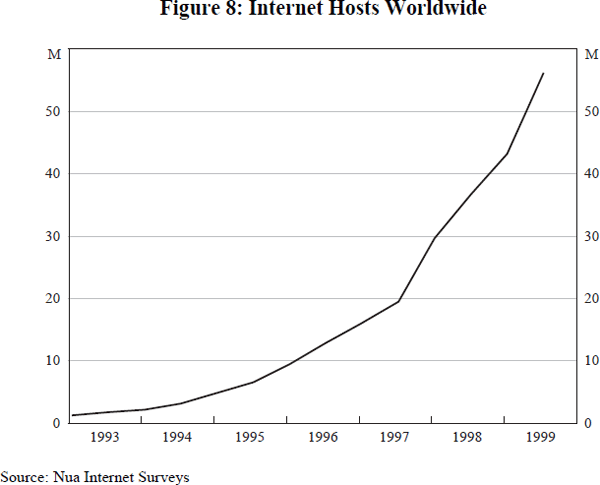
There is plenty of room for imitation. There are fewer than 70 million internet hosts worldwide (Figure 8). Even in the most computerised and information technology-intensive sectors of the world economy, it is clear that there is still plenty of room for additional investments in information technology.
There is no reason for things that have proven to be relatively high marginal product investments inside the US to be low marginal product investments outside the US. To the extent that the productivity speed-up is due to the information technology revolution, what has happened in the US over the past decade is likely to be a mirror in which others can see aspects of their futures.
Thus from a growth-oriented macroeconomic standpoint the future looks bright for the whole OECD, the whole industrial core of the world economy – brighter than it has looked at any time since the beginning of the 1970s.
Footnotes
I would like to thank George Akerlof, Larry Ball, Alan Blinder, Michael Froomkin, Dan Sichel and Janet Yellen for helpful discussions. [1]
Possibly connected with the productivity speed-up is the sudden and swift fall in the American economy's NAIRU in the 1990s. This factor is hard to pin down. Our models of what determines the NAIRU are poor, awkward, and do not work very well. NAIRUs bounce all over the place, for all kinds of reasons, many of which we do not understand (see Ball (1996)). One possibility, however, is that the fall in the US NAIRU is also a consequence of the information technology revolution. [2]
As seen in Cogan, Muris and Schick (1994), for example. [3]
The contrast between the success in the 1990s of the Budget Enforcement Act and the failure in the 1980s of Gramm-Rudman to control the deficit is striking. [4]
A book that can be read with profit if one remembers that Woodward's principal sources came from the media affairs section of the White House, and that both Woodward and his principal sources had very, very limited understanding of the substantive debate over macroeconomic policy conducted within the Clinton administration. [5]
References
Ball LM (1996), ‘Disinflation and the NAIRU’, NBER Working Paper No 5520.
Barro RJ (1974), ‘Are Government Bonds Net Wealth?’, Journal of Political Economy, 82(5), pp 1095–1117.
Bernheim BD and K Bagwell (1988), ‘Is Everything Neutral?’, Journal of Political Economy, 96(2), pp 308–338.
Blinder AS (2000), The Internet and the New Economy, Internet Policy Institute, Washington DC.
Cogan J, T Muris and A Schick (1994), The Budget Puzzle: Understanding Federal Spending, Hoover Institution, Stanford.
DeLong JB and LH Summers (1991), ‘Equipment Investment and Economic Growth,’ Quarterly Journal of Economics, 106(2), pp 445–502.
Denison EF (1979), Accounting for Slower Economic Growth: The United States in the 1970s, The Brookings Institution, Washington DC.
Feldstein MS (1993a), ‘The Dollar and the Trade Deficit in the 1980s: A Personal View’, NBER Working Paper No 4325.
Feldstein MS (1993b), ‘Government Spending and Budget Deficits in the 1980s: A Personal View’, NBER Working Paper No 4324.
Gordon RJ (1997), ‘Comment on Daniel Sichel's “The Computer Revolution: An Economic Perspective”’, forthcoming (2000) as ‘Does the “New Economy” Measure Up to the Great Inventions of the Past’, in Journal of Economic Perspectives, 14(4).
Jorgenson DW and KJ Stiroh (2000), ‘Raising the Speed Limit: U.S. Economic Growth in the Information Age’, Brookings Papers on Economic Activity, 1, pp 125–135.
Krugman PR (1990), The Age of Diminished Expectations: U.S. Economic Policy in the 1990s, The Washington Post Company, Washington DC.
Oliner SD and DE Sichel (1994), ‘Computers and Output Growth Revisited: How Big is the Puzzle?’, Brookings Papers on Economic Activity, 2, pp 273–334.
Oliner SD and DE Sichel (2000), ‘The Resurgence of Growth in the Late 1990s: Is Information Technology the Story?’, Federal Reserve xerox.
Sichel DE (1997), The Computer Revolution: An Economic Perspective, Brookings Institution Press, Washington DC.
Solow RM (1957), ‘Technical Change and the Aggregate Production Function’, Review of Economics and Statistics, 39, pp 312–320.
Solow RM (1987), ‘We'd Better Watch Out’, New York Times Book Review, July 12, p 36.
Triplett JE (1999), Computers and the Digital Economy, The Brookings Institution, Washington DC.
Whelan K (2000), ‘Computers, Obsolescence, and Productivity’, Federal Reserve System Finance and Economic Discussion Series No 2000/06.
Woodward RS (1994), The Agenda: Inside the Clinton White House, Simon and Schuster, New York.