Strategic Review of Innovation in the Payments System: Results of the Reserve Bank of Australia's 2010 Consumer Payments Use Study – June 2011 4. The Use of Established Payment Methods
This section analyses the evolution of the use of the more established payment methods of cash, credit cards, debit cards and cheques. We also examine why people choose particular payment methods, which provides insight into where there may be gaps in innovation in the payments system.
Cash Payments
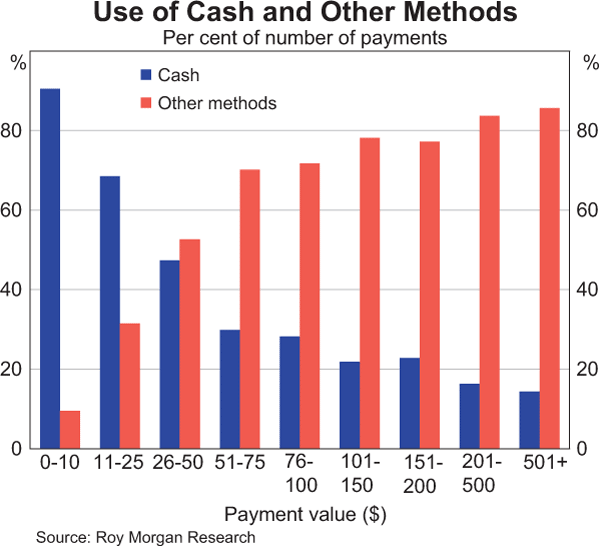
As discussed above, although cash is still the most frequently used method of payment in Australia, its use is declining relative to other payment methods. For example, while cash accounted for around 80 per cent of payments of $50 or less in 2007, this share declined to around 75 per cent in 2010.[11] Card payments, particularly those made with a debit card, are responsible for the bulk of this shift away from using cash for low-value payments: card payments accounted for around 24 per cent of payments of $50 or less in 2010, up from 19 per cent in 2007. Furthermore, while in 2007 cash was used more frequently than all other payment methods combined for payments up to $50, the same is now true only for payments up to $40 (Graph 9).
The decline in cash use has been broadly based across industries, with use declining as a proportion of total payments for all merchant categories except restaurants and ‘other’ (Table 8). The largest decline in cash use was for household bills. This may reflect increased promotion by billing companies of ‘paperless’ bills, which encourages payment by electronic means, such as BPAY. Also, some billing companies have added charges for over-the-counter payments, including cash transactions.
| Merchant category | Share of payments in 2010 (per cent)(a) |
Change from 2007 (percentage points) |
|---|---|---|
| Take-away | 87 | −7 |
| Pub/bar | 87 | −4 |
| Small food store | 85 | −4 |
| Restaurant | 84 | 7 |
| Transport | 80 | −3 |
| Leisure | 79 | −8 |
| Other | 72 | 1 |
| Services | 59 | −3 |
| Other retailer | 58 | −6 |
| Supermarket/liquor | 54 | −7 |
| Health | 45 | −10 |
| Petrol | 44 | −3 |
| Holiday travel | 22 | −3 |
| Household bills | 20 | −17 |
|
(a) Based on payment methods included in both the 2007 and 2010 studies (excludes internet/telephone banking and payments using the online payment schemes, prepaid cards, store cards and petrol cards) Source: Roy Morgan Research |
||
Despite the move away from cash, it remains an important payment method for spending at many businesses. The 2010 diary results indicate that cash is used for over 80 per cent of the number of payments for take-away and fast-food stores, pubs/bars, small food stores and restaurants. By contrast, only around 20 per cent of payments for household bills and holiday travel are made using cash.
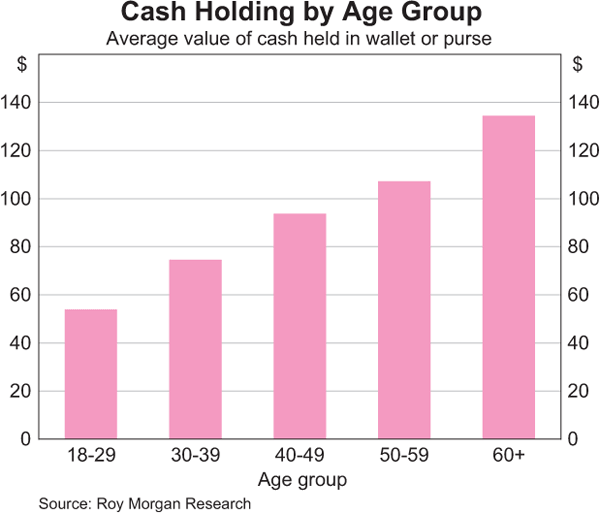
On average, consumers carry $93 in cash in their purse or wallet, with the amount increasing with age; consumers aged between 18 and 29 hold $54, on average, compared with $134 for consumers aged 60 years and over (Graph 10). This possibly reflects the fact that younger consumers are more comfortable relying on electronic forms of payment for their everyday transactions; in contrast to cash, the use of cards relative to other payment methods broadly declines with age.
Credit Card Payments
As noted above, there has been a clear shift towards consumers using debit cards in preference to credit cards between 2007 and 2010. A number of factors may have contributed to this slowdown in the use of credit cards. First is the increased prevalence of surcharging on credit card transactions since the first study was undertaken. In December 2010, almost 30 per cent of merchants surcharged at least one of the credit cards they accepted, compared with just over 8 per cent in June 2007.[12] However, consumers appear to have become more sensitive to surcharges, or better at avoiding them; the proportion of credit card transactions where a surcharge was actually paid by the consumer was virtually unchanged between 2007 and 2010, at around 5 per cent. Consumer responses to surcharging are discussed in more detail in Section 6.
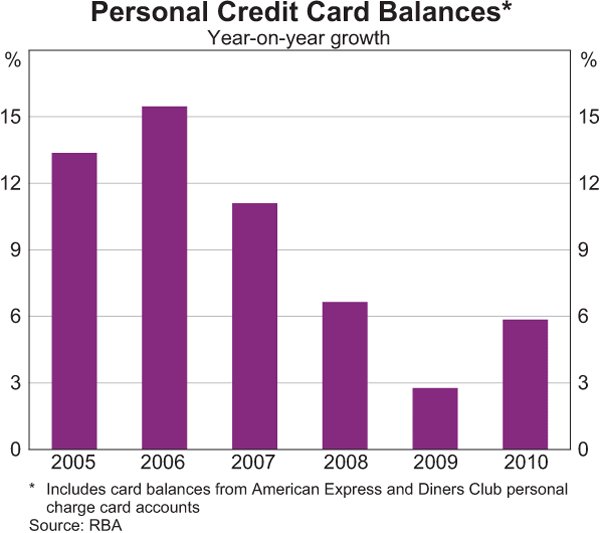
A second factor that may have contributed to the relative decline in credit card use is consumers' more cautious attitudes towards personal debt. The Reserve Bank's regular data collection from financial institutions indicates that consumers have cut back on the use of credit since the global financial crisis, as shown by slower growth in balances on personal credit cards (Graph 11). Because debit cards allow consumers to use their own funds, these changes in attitude are likely to increase debit card use at the expense of credit cards.
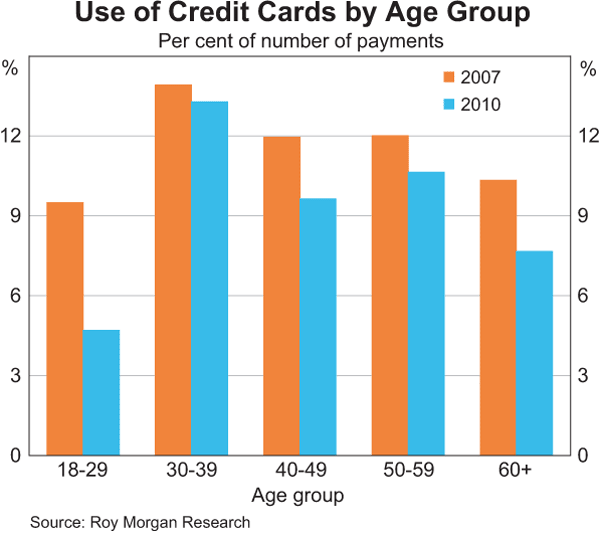
A third factor is the active issuance and promotion of scheme debit cards by the card schemes and some issuers in the years between the 2007 and 2010 studies. Like credit cards, scheme debit cards allow consumers to make payments remotely (that is, via the internet or phone, or through the mail). The four major banks began to issue scheme debit cards much more widely in the years following the first study, which contributed to scheme debit card ownership increasing from 22 per cent to 38 per cent of respondents. Conversely, the proportion of people owning a credit card declined slightly from 50 per cent in 2007 to 47 per cent in 2010.[13] In addition, while the use of credit cards declined across all age groups between 2007 and 2010, the decline was most marked for the youngest age group (Graph 12). Payments on credit cards as a proportion of total payments for consumers aged between 18 and 29 fell from just under 10 per cent of all payments in 2007 to less than 5 per cent in 2010. This age group makes substantially more of their payments via the internet than most other age groups (discussed in more detail in Section 5).
Within credit card payments, the use of American Express and Diners Club cards across industries appears to have changed significantly between 2007 and 2010, although these data should be interpreted with some caution because of small sample sizes within merchant categories (Graph 13). The majority of purchases made on American Express and Diners Club cards in 2010 occurred at supermarkets (42 per cent), ‘other retailers’ (which include electrical/furniture stores and department stores, 25 per cent) and petrol stations (12 per cent). The increase in use at supermarkets is notable; in 2007, supermarket purchases made up only 8 per cent of American Express and Diners Club credit card transactions.
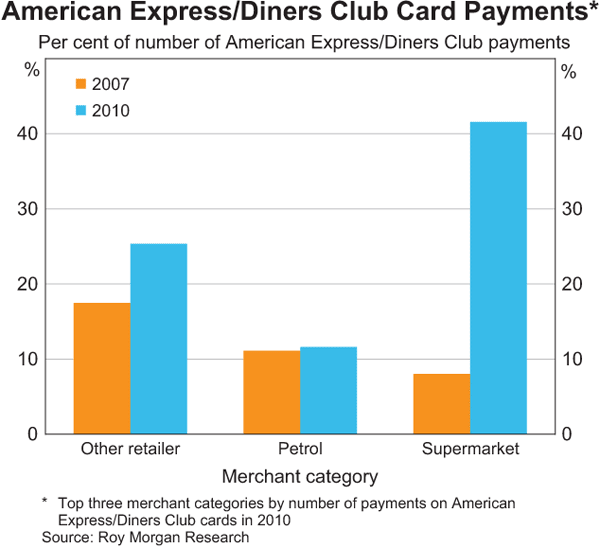
There are a number of explanations for this change in the use of American Express and Diners Club cards. First, the characteristics of American Express cardholders may have changed as a result of significant growth in the issuance of ‘companion’ American Express cards by the four major banks. This may have shifted spending patterns away from the markets where American Express was traditionally strong, such as travel, towards more general spending categories such as supermarkets. Second, as the number of merchants that surcharge has increased over recent years, the use of American Express and Diners Club cards is likely to have become more heavily influenced by patterns of surcharging across industries. This may explain at least part of the increased spending at supermarkets and department stores, which do not tend to surcharge at present.
Debit Card Payments
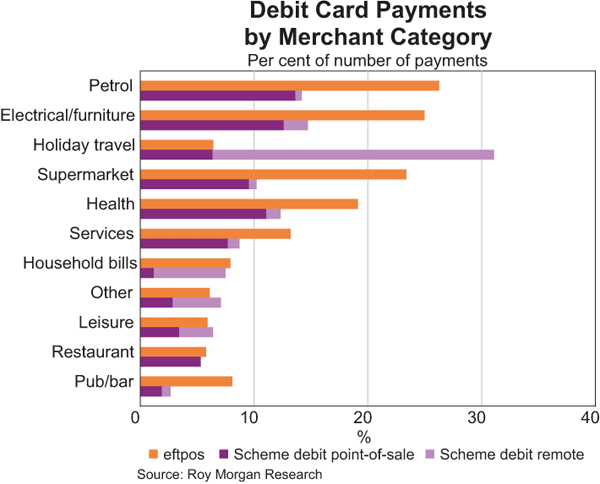
The strong growth of debit card payments has been driven by an increase in the use of scheme debit cards, although the use of eftpos has also increased. The increased availability of scheme debit cards is likely to be an important factor driving this strong growth. In the period following the 2007 Study, the major banks began to issue multi-function debit cards, which have access to both scheme debit and eftpos, in lieu of proprietary debit cards with access to only the ATM and eftpos networks. Furthermore, the major banks have at times actively encouraged cardholders to use scheme debit by pressing ‘credit’ rather than ‘cheque’ or ‘savings’ at the point of sale.
While eftpos accounts for a greater proportion of payments overall, scheme debit is used more frequently in industries where a high proportion of payments are made online due to its ability to be used for remote payments. For example, scheme debit cards are the dominant debit card option for holiday travel and leisure payments (Graph 14).
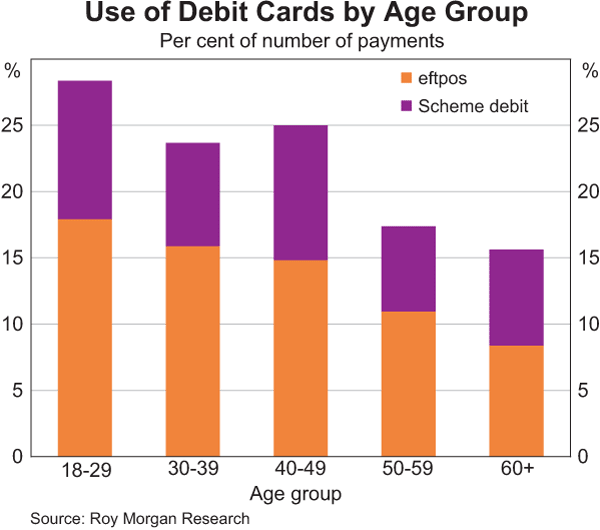
As in 2007, the use of eftpos is highest among the youngest age group and declines with age (Graph 15). Somewhat surprisingly, though, age appears to have less impact on scheme debit card use. In 2010, scheme debit accounted for 10 per cent of payments for people aged 18–29, compared to 7 per cent for people aged 60 and over.
Bill Payments
In order to examine methods of making bill payments, we are able to combine data on direct debits from the end-of-study questionnaire with the diary study data. The end-of-study questionnaire asked respondents to record the date and amount of all direct debits made in the month prior to the study. This covered all payments initiated by a third party, including direct debits through the direct entry system as well as automatic payments initiated on credit and scheme debit cards. The vast majority of these payments are likely to be for household bills.
The majority of bill payments are made by direct debit and BPAY, which together accounted for 55 per cent of the number of bill payments in 2010 (Graph 16). Other important payment options for bills are internet/telephone banking transfers and cash and card payments. Although bill payments are one of the main uses of personal cheques, only around 2 per cent of all bill payments were made by personal cheque in 2010.
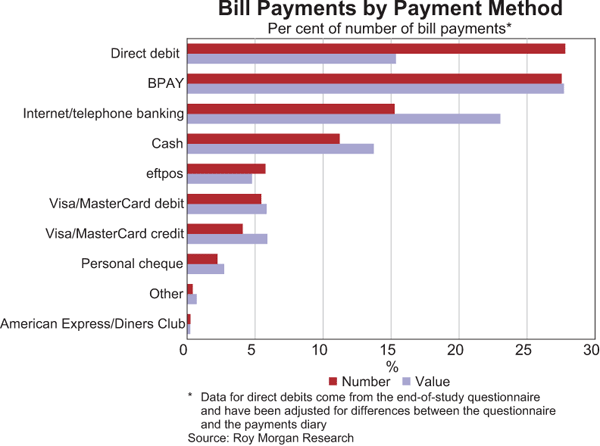
The above data point to widespread use of the internet to make bill payments, with around 40 per cent of bills being paid online. It is notable that credit and scheme debit cards make up around 11 per cent of internet bill payments – significantly less than their 25 per cent share of all internet payments across all merchant categories. This likely reflects the wider range of payment alternatives for paying household bills online than is generally available for the purchase of goods and services. The common practice of applying surcharges to cards may also contribute to the lower use of credit and scheme debit cards for online bill payments.
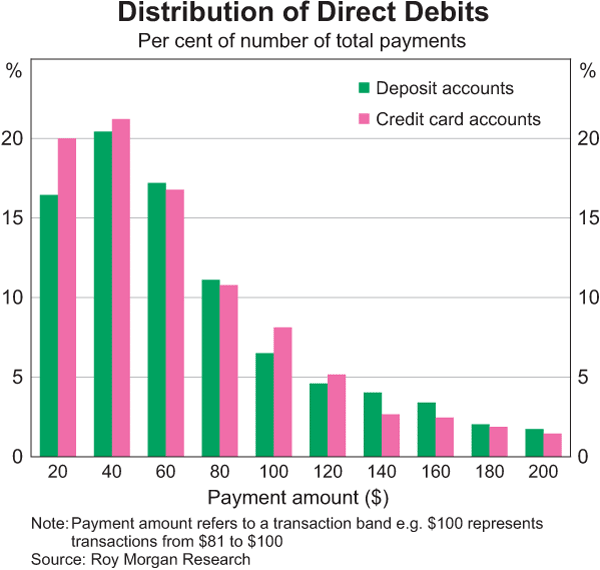
Direct debits are widely used by consumers, with over 70 per cent of respondents having made at least one direct debit in the month prior to the study period. The median value of direct debits from bank accounts was $57, compared with $50 for those from credit card accounts. The distribution indicates that a fairly high proportion of low-value payments are made via direct debit, with payment amounts of $40 and below representing around 40 per cent of total direct debits in 2010 (Graph 17). Interestingly, a small proportion (around 1 per cent) of direct debits were for micropayments of $1 to $5. This likely reflects the increasing use of direct debits by online payment facilities, such as iTunes accounts and PayPal, whereby payments are made for digital goods from a credit card or bank account linked to the facility.
Cheque Use
Consistent with long-term trends evident from other data sources, the diary data show a decline in cheque use. This is reflected in the change in the proportion of study participants using cheques, down from 12 per cent in 2007 to 7 per cent in 2010 (based on the first week of the 2007 Study). There has been a corresponding decline in the average number of cheque payments per person, down from 0.2 payments per week in 2007 to 0.1 payments per week in 2010.
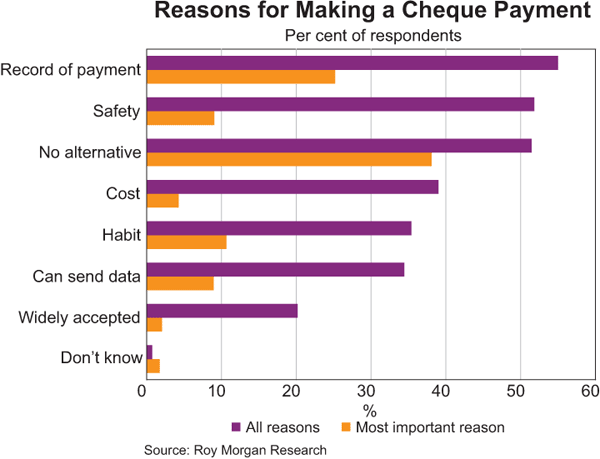
Less than 40 per cent of participants indicated in the end-of-study questionnaire that they had made a payment by cheque in the past year. The most important reason people gave for having used a cheque was that they believed there was no alternative for the type of payment they were making (38 per cent, Graph 18). This was followed by respondents who said that they value the record of payments that cheques provide (25 per cent). Other important factors in the use of cheques included habit, the ability to send information with cheques and cost, but these tended not to feature when people were asked for ‘the single most important’ reason for using cheques.
One of the main uses for personal cheques is for the payment of household bills. The diary results suggest that around 30 per cent of personal cheques were used to pay bills in 2010, although they represented only around 2 per cent of bill payments (including payments by direct debit). The ‘other’ merchant category accounted for around 25 per cent of the number of cheques and 45 per cent of the value, suggesting that cheques tend to be used for special purpose high-value payments. Cheques are the most common form of payment method used for payments made by mail, making up around 57 per cent of payments by that channel.
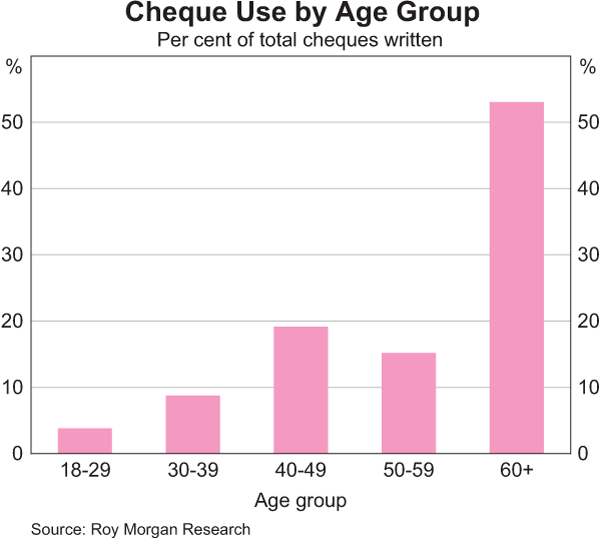
Consistent with the 2007 results, cheque use is heavily influenced by the age of individuals. In 2010, respondents 60 years and older accounted for more than 50 per cent of the number of cheques written, while cheque use by people under the age of 30 was negligible (Graph 19). People over 60 gave similar reasons for using cheques to the broader population, with the most important reasons being that there was no alternative to cheques (39 per cent) and that cheques provide a good record of payment (34 per cent). Older people also accounted for the majority of transactions made by mail, which, as noted above, are commonly made by cheque.
Footnotes
Figures are based on payment methods included in both the 2007 and 2010 studies (excludes internet/telephone banking and payments using the online payment schemes, prepaid cards, store cards and petrol cards). [11]
East & Partners (2010), Australian Merchant Aquiring and Cards Markets: Special Question Placement Report prepared for the Reserve Bank of Australia, December. [12]
The credit card ownership figures are sourced from Roy Morgan Research's Single Source re-contact database. [13]