RDP 2005-10: Housing and the Household Wealth Portfolio: The Role of Location 3. Property Holdings in the Household Asset Portfolio
December 2005
- Download the Paper 626KB
Before we estimate a full model of the effects of urbanisation on the housing share of assets in Section 4, we examine the asset shares based on our HILDA Survey sample, without controlling for other factors. We restrict our analysis to those households that own their home. With home ownership rates around 70 per cent for both rural and urban regions, we capture a suitably large and equal share of the population in all regions.
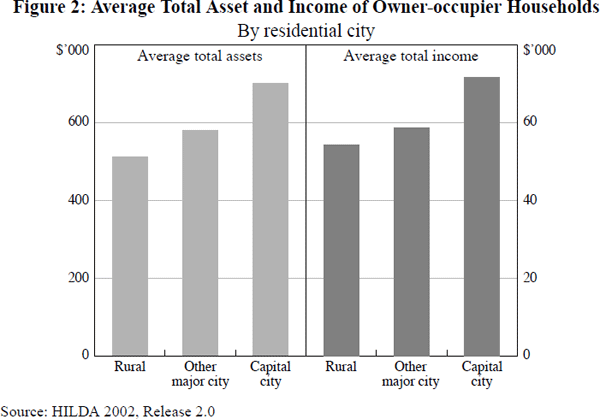
Figure 2, which is based on the 2002 HILDA Survey, confirms that for owner-occupier households, average assets and income rise with urbanisation.[6] There are also notable differences in the composition of both financial and non-financial assets across different regions (Table 1 and Figure 3). Overall, the average portfolio of urban households appears to be less diversified than that of rural households. A key source of concentration in the urban portfolio is the larger share of property in total assets: for owner-occupiers, the average share of the own home is up to 11 percentage points higher in capital cities, and for households that own more than one property, the share of total property is up to 13 percentage points higher (Figure 3). Working in the other direction, urban households hold a smaller share of their assets in the form of business assets, vehicles, bank accounts and life insurance. For business assets and life insurance this may reflect the larger share of self-employed workers in rural areas (14 per cent) compared with capital cities (6 per cent).
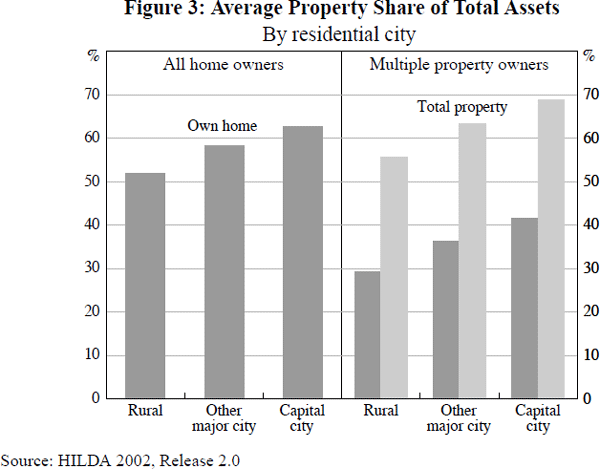
| Own home | Other property | Business assets | Vehicles and collectibles | Superannuation and life insurances | Cash investments and equities | |
|---|---|---|---|---|---|---|
| Rural area | 51.9 | 5.3 | 7.6 | 8.1 | 15.4 | 11.8 |
| Major city | 58.3 | 5.2 | 4.2 | 6.2 | 14.6 | 11.5 |
| Capital city | 62.6 | 5.8 | 2.6 | 4.5 | 14.8 | 9.8 |
|
Source: HILDA 2002, Release 2.0 |
||||||
There is clearly a premium paid on owner-occupied property by households living in more densely populated locations. One explanation for this premium could be a higher quality of housing in urban areas. However, Table 2, which compares some housing quality indicators between urban and rural locations, suggests that this is not the case. We find that the average number of persons per bedroom is similar between capital cities and rural areas. Similarly, there is no appreciable difference in the condition of the home. The only difference that arises relates to the type of dwelling. In capital cities we find a lower share of the population living in separate houses, with semi-detached houses and apartments being more common. If anything, this suggests that the quality of housing in capital cities is lower than in rural areas because smaller semi-detached houses or apartments generally provide lower ‘housing services’ than free-standing houses. Yet, we find the typical value of the home for those living in capital cities is almost $150,000 more than for those living in rural areas. Hence, with little appreciable difference in housing quality, the difference in home values between urban and rural areas must be attributable to the wage premium and/or the (non-pecuniary) urban premium paid for living in more populous cities.
| Persons per bedroom | External condition of the home(a) | Proportion of households with separate house (per cent) | |
|---|---|---|---|
| Rural area | 1.6 | 1.9 | 92.2 |
| Major city | 1.6 | 1.9 | 91.9 |
| Capital city | 1.5 | 1.8 | 84.2 |
|
Note: (a) Observed by the interviewer. Ranked on a scale from 1 = very good/excellent to 5 = very poor/almost derelict. Source: HILDA 2002, Release 2.0 |
|||
A number of other household characteristics might also explain why city households choose to hold a higher share of assets in property, such as marital status or household size. If these characteristics are unevenly distributed across rural and urban locations, they could also lead to differences in housing shares in total assets. We will therefore proceed with the estimation of a model that controls for differences in these other factors.
Footnote
For this initial investigation, location is divided into three broad regions: capital cities, other major cities and rural areas. Capital cities are based on Sydney, Melbourne, Brisbane, Adelaide and Perth Statistical Divisions. Other major cities and rural areas are derived from the Accessibility/Remoteness Index of Australia scores from the 2001 Census (see the Appendix). [6]