Bonds and the Yield Curve
Download the complete Explainer 173KBThe yield curve for government bonds is an important indicator in financial markets. It helps to determine how actual and expected changes in the policy interest rate (the cash rate in Australia), along with changes in other monetary policy tools, feed through to a broad range of interest rates in the economy. This Explainer has two parts:
- The first part outlines the concept of a bond and a bond yield. It also discusses the relationship between a bond's yield and its price.
- The second part explains how the yield curve is formed from a series of bond yields, and the different shapes the yield curve can take. It then discusses why the yield curve is an important indicator in financial markets and factors that can cause the yield curve to change.
Bonds
What is a bond?
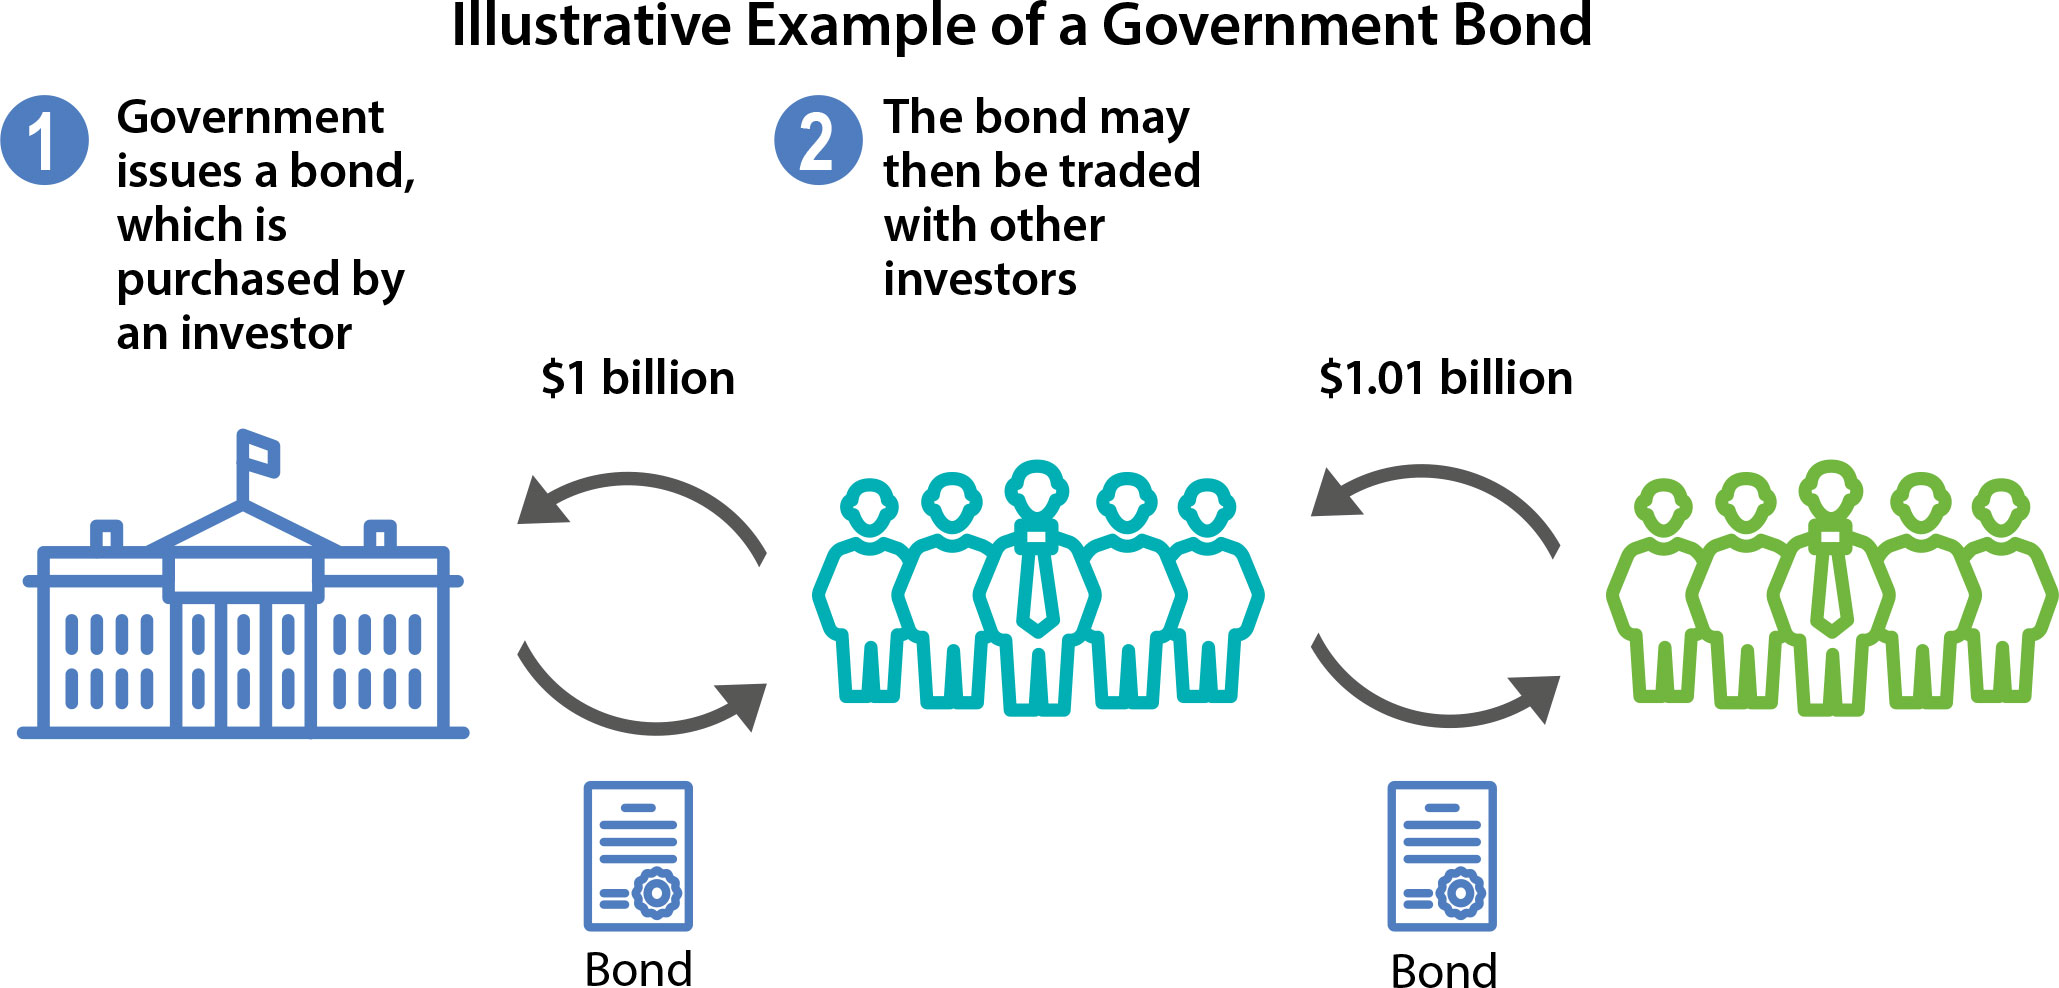
A bond is a loan made by an investor to a borrower for a set period of time in return for regular interest payments. The time from when the bond is issued to when the borrower has agreed to pay the loan back is called its ‘term to maturity’. There are government bonds (where a government is the borrower) and corporate bonds (where a business or a bank is the borrower). The main difference between a bond and a regular loan is that, once issued, a bond can be traded with other investors in a financial market. As a result, a bond has a market price.
For example, in the diagram below the Government has issued a bond to the value of $1 billion, which was purchased by an investor. The bond may then be traded with other investors in financial markets, at which point its market price can change (in this instance, it has become $1.01 billion).
What is a bond yield?
A bond's yield is the return an investor expects to receive each year over its term to maturity. For the investor who has purchased the bond, the bond yield is a summary of the overall return that accounts for the remaining interest payments and principal they will receive, relative to the price of the bond. For an issuer of a bond, the bond yield reflects the annual cost of borrowing by issuing a new bond. For example, if the yield on three-year Australian government bonds is 0.25 per cent, this means that it would cost the Australian government 0.25 per cent each year for the next three years to borrow in the bond market by issuing a new three-year bond.
When a bond is issued, an investor has purchased the bond for the first time in a marketplace called the ‘primary market’. The initial price the investor pays for the bond depends on a number of factors, including the size of the interest payments promised, the term of the bond and the price of similar bonds already issued into the market. This information (including the price paid) is used to calculate the initial yield on the bond. Once a bond is issued, the investor is then able to trade that bond with other investors in the ‘secondary market’ and its price and yield may change with market conditions.
What is the relationship between the price of a bond and its yield?
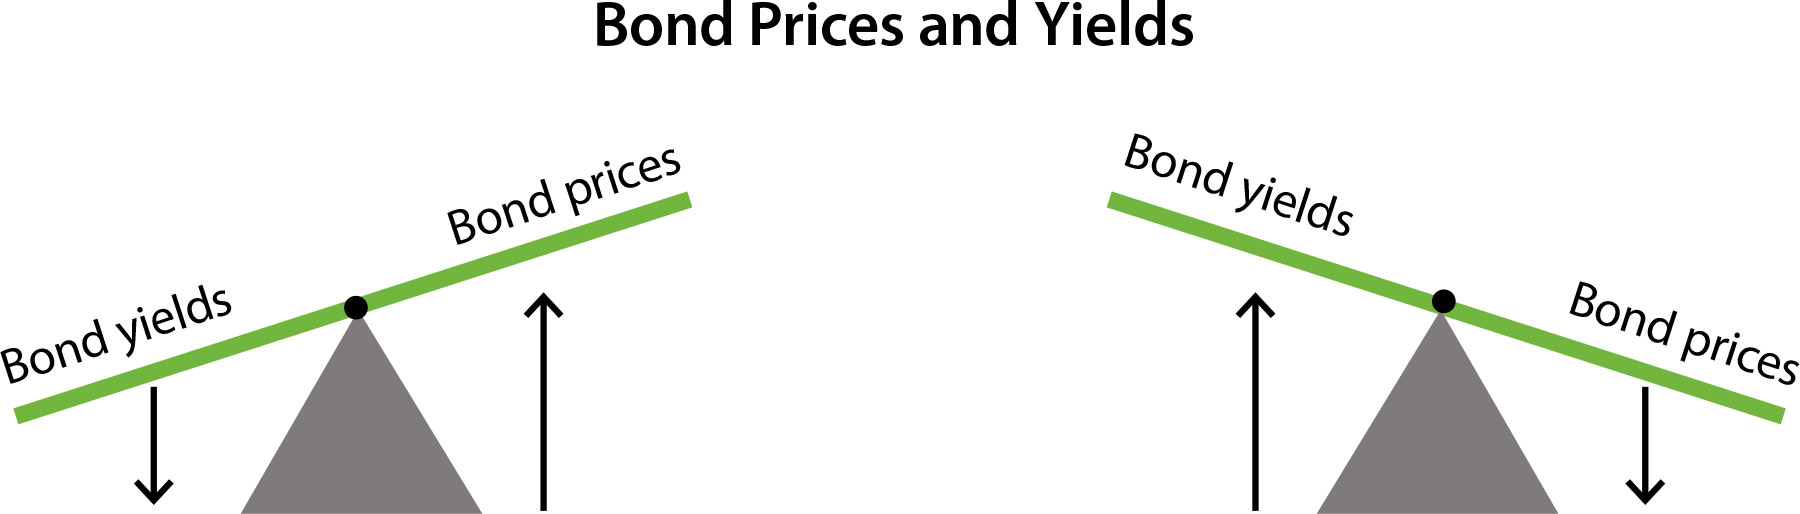
The prices at which investors buy and sell bonds in the secondary market move in the opposite direction to the yields they expect to receive (see Box below on ‘Bond Prices and Yields – An Example’). Once a bond is issued, it offers fixed interest payments to its owner over its term to maturity, which does not change. However, interest rates in financial markets change all the time and, as a result, new bonds that are issued will offer different interest payments to investors than existing bonds.
For example, suppose interest rates fall. New bonds that are issued will now offer lower interest payments. This makes existing bonds that were issued before the fall in interest rates more valuable to investors, because they offer higher interest payments compared to new bonds. As a result, the price of existing bonds will increase. However, if a bond's price increases it is now more expensive for a potential new investor to buy. The bond's yield will then fall because the return an investor expects from purchasing this bond is now lower.
Box: Bond Prices and Yields – An Example
To illustrate the relationship between bond prices and yields we can use an example. In this example, consider a government bond issued on 30 June 2019 with a 10 year term. The principal of the bond is $100, which means that on 30 June 2029 the government must repay $100 dollars to the bond's owner. The bond has an annual interest payment of 2 per cent of the principal (i.e. $2 each year). If the yield on all 10 year government bonds trading in the secondary market is 2 per cent (the same as the interest payments in our bond), then the price of our bond will be $100 and the yield on our bond will also be 2 per cent.
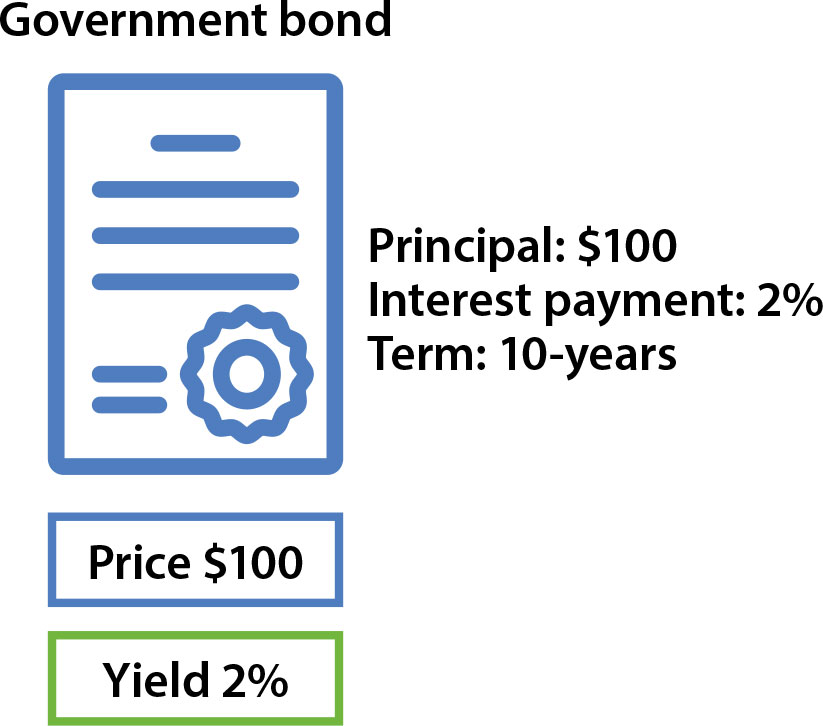
Imagine that investors require a yield of 2 per cent to invest in a government bond. They will be willing to pay $100 to invest in a government bond that offers an annual interest payment of $2, because this will provide them with their required yield. Imagine now that the yield investors require to invest in a government bond falls from 2 per cent to 1 per cent. This would mean that investors now only require a $1 annual interest payment to invest in a bond worth $100. However, our bond still offers a $2 annual interest payment, $1 in excess of what they now require. As a result, they will be willing to pay more than $100 to purchase our bond. The price of our bond will therefore increase up until the point where it provides investors with their required yield of 1 per cent. This occurs when the price of our bond is $109.50.

The Yield Curve
What is the yield curve?
The yield curve – also called the term structure of interest rates – shows the yield on bonds over different terms to maturity. The ‘yield curve’ is often used as a shorthand expression for the yield curve for government bonds.
To graph the yield curve, the yield is calculated for all government bonds at each term to maturity remaining. For example, the yield on all government bonds with one year remaining until maturity is calculated. This value is then plotted on the y-axis against the one year term on the x-axis. Similarly, the yield on government bonds with three years remaining until maturity is calculated and plotted on the y-axis, against three years on the x-axis, and so on. The policy interest rate (the cash rate in Australia) forms the beginning of the government yield curve, because it is the interest rate with the shortest term in the economy (overnight).
The yield curve for government bonds is also called the ‘risk free yield curve’. The expression ‘risk free’ is used because governments are not expected to fail to pay back the borrowing they have done by issuing bonds in their own currency.

Other issuers of bonds, such as corporations, generally issue bonds at a higher yield than the government, as they are more risky for an investor. This is because the loan or interest payments in the bond may not be paid by the corporation to its owner at the agreed time. When this occurs, it is called a ‘default’.
What are the different shapes of the yield curve?
Two main aspects of the yield curve determine its shape: the level and the slope.
The level of the yield curve measures the general level of interest rates in the economy and is heavily influenced by the cash rate (see Explainer: Transmission of Monetary Policy). For this reason, the cash rate is often referred to as the ‘anchor’ for the yield curve. Changes in the cash rate tend to shift the whole yield curve up and down, because the expected level of the cash rate in the future influences the yield investors expect from a bond at all terms.
The slope of the yield curve reflects the difference between yields on short-term bonds (e.g. 1 year) and long-term bonds (e.g. 10 year). The yields on short and long-term bonds can be different because investors have expectations – which are uncertain – that the cash rate in the future might differ from the cash rate today. For example, the yield on a five year bond reflects investors' expectations for the cash rate over the next five years, along with the uncertainty associated with this.

Normal yield curve
A so-called ‘normal’ shape for the yield curve is where short-term yields are lower than long-term yields, so the yield curve slopes upward. This is considered a normal shape for the yield curve because bonds that have a longer term are more exposed to the uncertainty that interest rates or inflation could rise at some point in the future (if this occurs, the price of a long-term bond will fall); this means investors usually demand a higher yield to own longer-term bonds. A normal yield curve is often observed in times of economic expansion, when economic growth and inflation are increasing. In an expansion there is a greater likelihood that future interest rates will be higher than current interest rates, because investors will expect the central bank to raise its policy interest rate in response to higher inflation (see Explainer: What is Monetary Policy?).
Inverted yield curve
An ‘inverted’ shape for the yield curve is where short-term yields are higher than long-term yields, so the yield curve slopes downward. An inverted yield curve might be observed when investors think it is more likely that the future policy interest rate will be lower than the current policy interest rate. In some countries, such as the United States, an inverted yield curve has historically been associated with preceding an economic contraction. This is because central banks reduce policy rates in response to lower economic growth and inflation, which investors may correctly anticipate will happen.
Flat yield curve
A ‘flat’ shape for the yield curve occurs when short-term yields are similar to long-term yields. A flat curve is often observed when the yield curve is transitioning between a normal and inverted shape, or vice versa. A flat yield curve has also been observed at low levels of interest rates or as a result of some types of unconventional monetary policy.

Why is the Yield Curve Important?
The yield curve receives a lot of attention from those who analyse the economy and financial markets. The yield curve is an important economic indicator because it is:
- central to the transmission of monetary policy
- a source of information about investors' expectations for future interest rates, economic growth and inflation
- a determinant of the profitability of banks.
Monetary policy transmission
The yield curve is involved in the transmission of changes in monetary policy to a broad range of interest rates in the economy. When households, firms or governments borrow from a bank or from the market (by issuing a bond), their cost of borrowing will depend on the level and slope of the yield curve. For example, a household taking out a mortgage might decide to fix the interest rate on their loan for three years. The bank would calculate the interest rate on this mortgage by taking the relevant term on the risk-free yield curve – in this case the three-year term – and then add an amount to cover costs and to compensate for the risk that the borrower might not repay the loan (credit risk). The yield curve similarly influences the interest rate on savings products with a fixed term, such as term deposits.
Different terms of the yield curve are important for different sectors of the economy. For example, Australian households that borrow using fixed-rate mortgages usually only lock in their interest rate for 2–3 years, so this part of the yield curve is important for fixed mortgage rates. Many Australian households have mortgages with variable interest rates, so the cash rate is important for them. On the other hand, firms and governments often wish to borrow for a much longer term, say 5 or 10 years, so this part of the yield curve is important for them.
Investors' expectations
In financial markets, the slope of the yield curve (e.g. normal, inverted, flat) provides an important signal of investors' expectations for future interest rates, and by extension their expectations for future economic growth and inflation. The slope of the yield curve is considered to be a ‘leading indicator’ of future economic growth and inflation because financial market data is more forward-looking than many other sources of information.
Bank profitability
The level and slope of the yield curve can also influence the profits of the banking sector, although its importance varies across economies. Profitable and stable banks support the growth of credit in the economy, which is an important factor for economic growth and in particular for investment. Profitable and stable banks also help to reduce the risk of financial market disruptions in a crisis (see Explainer: The Global Financial Crisis). Banks earn profit from lending funds at a higher interest rate than they pay to borrow funds from depositors and other sources. Banks usually lend for longer terms than they borrow so part of this profit comes from the difference between long-term and short-term interest rates (i.e. the slope of the yield curve). If the yield curve is normal, all else equal, a steeper slope will mean a larger margin and higher profits for the banking system.
The slope of the yield curve is particularly important for bank profitability in countries where bank loans tend to be based on very long-term interest rates, such as in the United States. In Australia, the interest rate on many loans is based on the shorter-term end of the yield curve (e.g. variable rate mortgages) and so the slope of the yield curve has less of an effect on bank profitability.
What Can Cause the Yield Curve to Change?
There are many factors that could lead to changes in the yield curve. Some of them include:
Changes in monetary policy
Different monetary policy tools (conventional and unconventional) influence the economy in part through their effect on particular segments of the yield curve. Understanding the effect of different monetary policies on the yield curve is important because of the yield curve's role in the transmission of monetary policy to other interest rates in the economy.
Conventional monetary policy
Changes in the cash rate tend to shift the level of the yield curve up and down, particularly at the short end.
Unconventional monetary policies
Some unconventional monetary policies influence interest rates through their effect on the yield curve. Changes in unconventional monetary policies can either work by changing the level of the yield curve (e.g. through negative interest rates that lower the entire yield curve) or by changing its slope (e.g. through forward guidance, asset purchases). (See Explainer: Unconventional Monetary Policy.)


If the central bank provides forward guidance about its future monetary policy, this influences the yield curve by shaping investors' expectations about future policy interest rates. Forward guidance has tended to involve a commitment by central banks to keep policy interest rates low for a time or until the central bank has achieved a measurable goal (such as an increase in inflation and/or fall in unemployment). In response to forward guidance that policy interest rates are expected to remain low, the yield curve could be expected to flatten between the short end and the term of the yield curve that matches the term of the guidance, and lower the yield curve further out.
Asset purchases involve the outright purchase of assets by the central bank in the secondary market, including government bonds. By purchasing assets the central bank adds to demand for them, so their price increases and their yield falls. As a result, asset purchases can change the slope of the yield curve, usually by lowering the additional yield investors require to compensate for the uncertainty that interest rates or inflation could rise in the future (term risk). If the central bank targets a quantity of assets to purchase, then its goal is often to lower yields across the whole yield curve.[1] On the other hand the central bank may target a yield on a specific segment of the curve, purchasing whatever quantity of assets is necessary to achieve that target.
Changes in investors' perceptions of risks
Over time investors may change how they perceive the risks of owning bonds. This includes:
- Credit risk. If investors think that the issuer of a bond is less likely to pay the interest or amount borrowed in the bond at the agreed time, then they will demand a higher yield to own the bond. Government bonds are typically perceived as having very low credit risk.
- Liquidity risk. Bonds that investors think will be difficult to sell to other investors in the market will have a higher yield. Government bond markets are often the most liquid in a country and only face significant liquidity risks in times of financial distress.
- Term risk. Investors require a higher return for loaning funds at a fixed rate of interest, because doing so exposes them to the risk that interest rates might rise. If interest rates do rise, including because inflation is higher than expected, then the return from lending one time at a fixed interest rate will be lower than the return the investor could have received from lending for a shorter term, multiple times (for example, lending once for five years as opposed to lending five times for one year each). Term risk is measured by an indicator called the term premium (learn more in the Statement on Monetary Policy Box on Why are Long-term Bond Yields So Low?).
Investors' assessment of these risks may change over time as they receive new information or change their perceptions of existing information. The yield curve may respond differently to changes in risk – shifting up or down or changing slope – depending on the type of risk and how persistent investors expect risks to be.
Changes in the demand for or supply of bonds
A related way to analyse bond prices and yields is by using a demand and supply framework. Like any market, the price (and yield) of bonds is influenced by the amount of bonds investors demand and the amount of bonds that the borrowers of funds decide to supply.
Investors' demand for bonds will reflect their preferences for owning bonds as opposed to other types of assets (shares, physical property, commodities, cash, etc.), which are influenced by their expectations of future monetary policy and their perceptions of risks. When the demand for a particular bond increases, all else equal, its price will rise and its yield will fall. The supply of a bond depends on how much the issuer of a bond needs to borrow from the market, such as a government financing its expenditure. If the supply of a particular bond increases, all else equal its price will fall and its yield will increase.
The response of the yield curve to changes in the demand for, or supply of, bonds will depend on the nature of the change. Changes that affect the whole yield curve will cause it to shift up or down, while changes that only affect a particular segment of the yield curve will influence its slope. For instance, the government might decide to increase its issuance of 10 year bonds, keeping the supply of all other bonds the same. All else equal, this increase in the supply of 10 year bonds would cause their yield to increase relative to other terms, and so steepen the yield curve.

Endnotes
Except for the cash rate at the very front of the yield curve, which may have reached its lowest practical level. [1]