Reserve Bank of Australia Annual Report – 1992 The Economy and Monetary Policy
International Environment
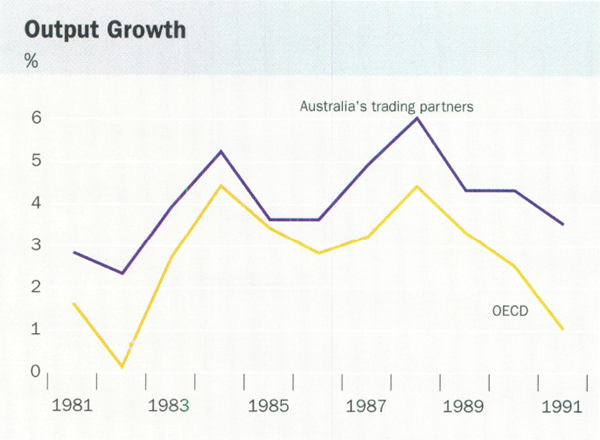
The international economy over the past year or so was weaker than it has been for nearly a decade, and a good deal weaker than had been expected. A year ago, the prospects looked reasonably positive. The US economy had been through a short and relatively mild recession but recovery was under way. The Japanese economy was expected to slow but only to “cruising speed.” The US recovery and continued growth in Japan were forecast to outweigh the slowing in Germany associated with policy tightening in response to pressures on resources and prices. Overall, growth in industrial countries was forecast to be about 2¾ per cent in 1992, up from a little over 1 per cent in 1991.
These expectations proved to be too optimistic. The US recovery slowed in the second half of 1991 and, although positive, has continued to be disappointingly slow. Employment growth in the year to mid 1992 was negligible. The Japanese economy slowed further, and by May 1992, industrial production was nearly 9 per cent lower than a year earlier. Both economies have suffered from the lingering effects on confidence of weak financial positions among the banks, businesses and, in the United States, households. The latter was a significant factor also in the United Kingdom's slowdown. Financial instability and uncertainty have contributed to recessions in Norway, Sweden and Finland.
| Average Rates of Growth |
Peak to trough movement in GDP |
||
|---|---|---|---|
| 1985 – 89 | 1990 – Latest | ||
| Finland | 4.0 | −4.4 | −8.9 |
| United Kingdom | 3.6 | −1.3 | −4.3 |
| New Zealand | 0.9 | −0.6 | −4.2 |
| Canada | 3.5 | −0.7 | −3.7 |
| Sweden | 2.3 | −0.9 | −2.9 |
| Australia | 3.9 | 0.1 | −2.4 |
| United States | 3.0 | 0.3 | −2.2 |
| Norway | 2.3 | 1.5 | −1.4 |
| Switzerland | 3.0 | 0.2 | −1.1 |
| Germany | 2.5 | 3.5 | −0.9 |
| Austria | 2.7 | 3.5 | – |
| France | 3.1 | 1.9 | – |
| Italy | 3.2 | 1.7 | – |
| Japan | 4.6 | 4.0 | – |
| Netherlands | 2.7 | 3.1 | – |
By mid 1992 about half of the OECD countries had experienced a recession as conventionally defined. Weakness in activity contributed towards lower rates of inflation in most OECD countries but the results were uneven. For many their reductions in inflation did little more than bring them back to the average rates they had experienced during the second half of the 1980s. This was the case for the US, Japan and most European countries. The countries which appear to have reduced their core rates of inflation are Canada, Australia, New Zealand and the Scandinavian countries.
Most countries responded to evidence of sluggish economic activity and an improved outlook for inflation with monetary policy easings. In the United States, the key indicator rate, the “Federal funds” rate, fell on eight occasions to 3¼ per cent in early July 1992, its lowest level for nearly 30 years. Short-term rates in Japan declined from around 8 per cent to about 4 per cent. Short-term interest rates were also lowered in Canada and New Zealand. The United Kingdom lowered base rates in July, September and May, but the flexibility for monetary policy action appears to have been limited by pressures on sterling in the Exchange Rate Mechanism.
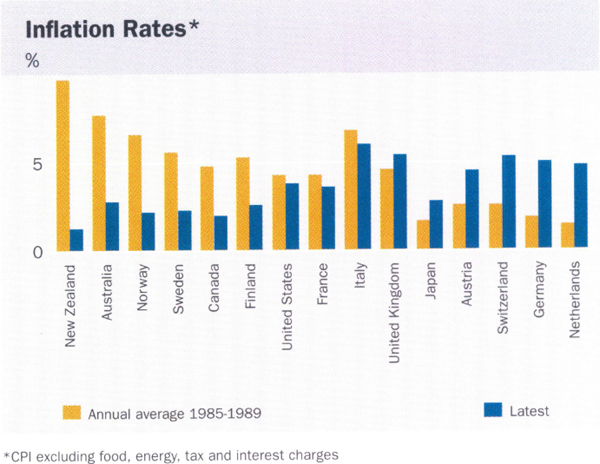
In Europe generally, the picture was dominated by Germany. Output in western Germany has declined from its peak in the early part of 1991, but upward pressure on prices has continued. By the end of 1991, the rate of consumer price inflation in Germany was above 4 per cent for the first time since the second OPEC oil shock in the late 1970s. In response, the Bundesbank tightened policy, pushing short-term interest rates to their highest level since the Second World War. This put further pressure on other European economies through the European Monetary System, contributing to weaker activity in most of those economies.
Current estimates for growth in industrial countries in 1992 have been revised down sharply, and now look only slightly stronger than in 1991. Economic growth is, however, forecast to pick up in 1993. This pick-up is contingent to some extent on inflation in Germany slowing and permitting an easing of policy not only in Germany but also in other European countries. Considerable uncertainty also surrounds the outlook for the Japanese economy where asset price falls could have profound effects on the capital positions of banks and other businesses.
While the lack of synchronisation of cyclical movements in the major economies helped to moderate the downturn in the world economy, it runs the risk of retarding the recovery. Given the outlook for the German and Japanese economies, the performance of the US economy – which accounts for 40 per cent of OECD-area GDP – is more critical than usual. With policies reasonably accommodating, the outlook for growth is better than a year ago but the recovery to date has been patchy and weak overall.
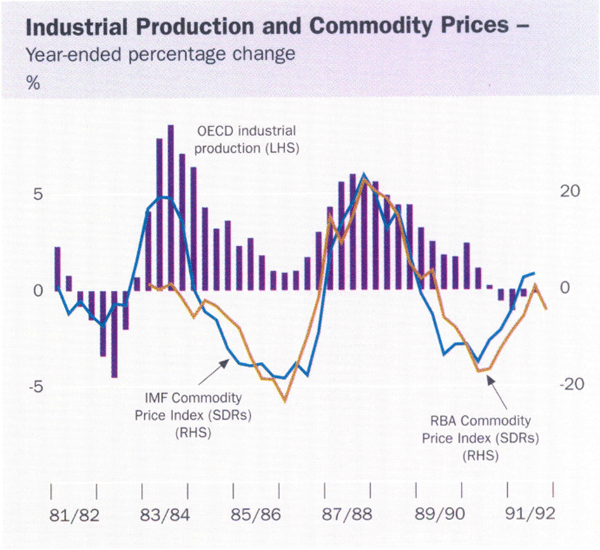
This weakness in economic activity in the major industrialised countries has held down prices for most of Australia's key commodity exports. In SDR terms, the Bank's index of commodity prices has fallen back, after a pick-up in the first half of 1991, and in June 1992 was 7 per cent lower than a year earlier. The weakness was concentrated most heavily in non-rural commodities, particularly gold, iron ore and steaming coal.
This weakness in prices has been partly offset by the strong growth in merchandise export volumes over recent years. Trade with Asia, in particular, has expanded sharply; over half of Australia's exports now go to East Asia and Japan, compared with around two-fifths a decade ago. The faster than average growth of these economies has provided good opportunities for Australia, including for manufactured exports; over the past five years manufactured exports to this region have grown at an average annual rate of 27 per cent.
The Australian Economy
Australia has been slow to emerge from recession. Activity fell to its lowest point around the middle of 1991; by then, real domestic expenditure had fallen by about 7 per cent from its peak in early 1990, with sharp contractions in residential construction and business investment. The impact on production of the downturn was absorbed in part by a fall in imports. Output was sustained by solid growth in exports so that, at its lowest point, the average measure of real GDP was some 2½ per cent below the peak. This was a smaller contraction overall than had occurred in the previous major recession in the early 1980s, which had been exacerbated by the effect of drought on rural output. The contraction in the non-farm economy, on the other hand, appears to have been larger than in 1982/83. The fall in aggregate employment was similar in the two episodes, with employment declining by 2¾ per cent between mid 1990 and the end of 1991, but the latest cycle has been more protracted and full-time employment noticeably weaker.
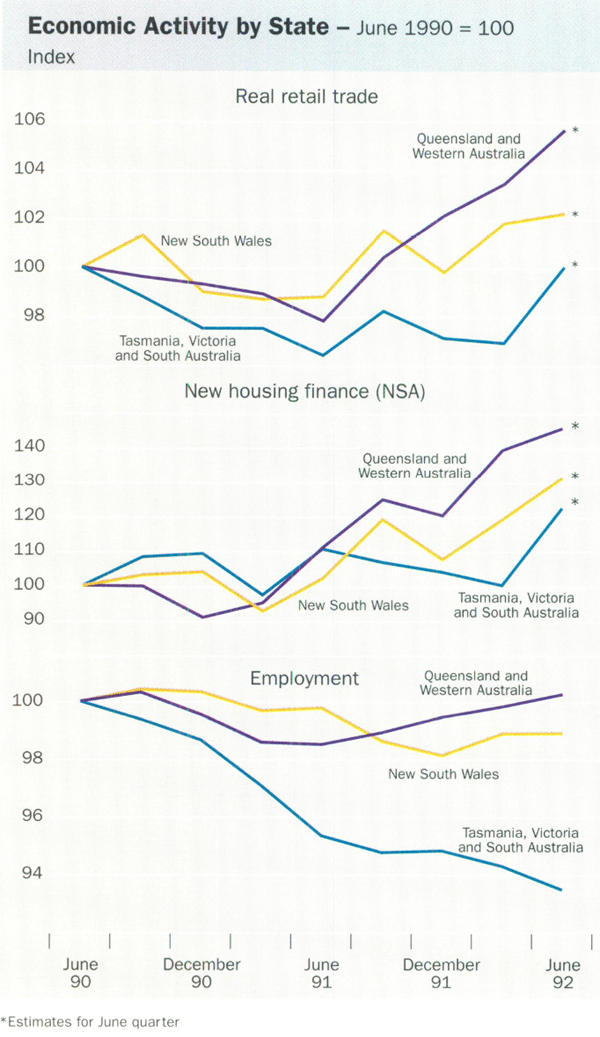
The recession was characterised by greater than normal dispersion in performance among different parts of the country. Victoria and South Australia have been particularly hard-hit by the effects on confidence of the difficulties of some financial institutions and falling property prices, which have flowed across a range of industries. On most indicators, the downturn in those States has been much more severe than elsewhere. Aggregate employment in Victoria, for example, has fallen by 7 per cent, compared with about 2 per cent for the rest of Australia.
Some initial signs of recovery appeared around mid 1991. Consumer spending began to strengthen, with a sharply higher trend in retail sales in the September quarter. Confidence had picked up, and lending for housing, spurred on by lower interest rates, accelerated. For a time it appeared that housing lending was building up a head of steam but it moderated towards the end of 1991. Private housing commencements were clearly on an upward trend by the September quarter.
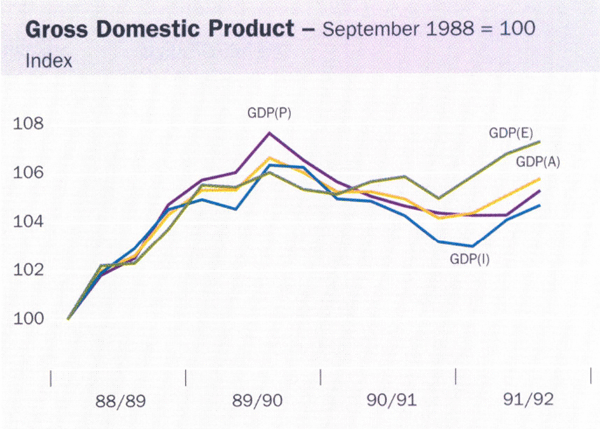
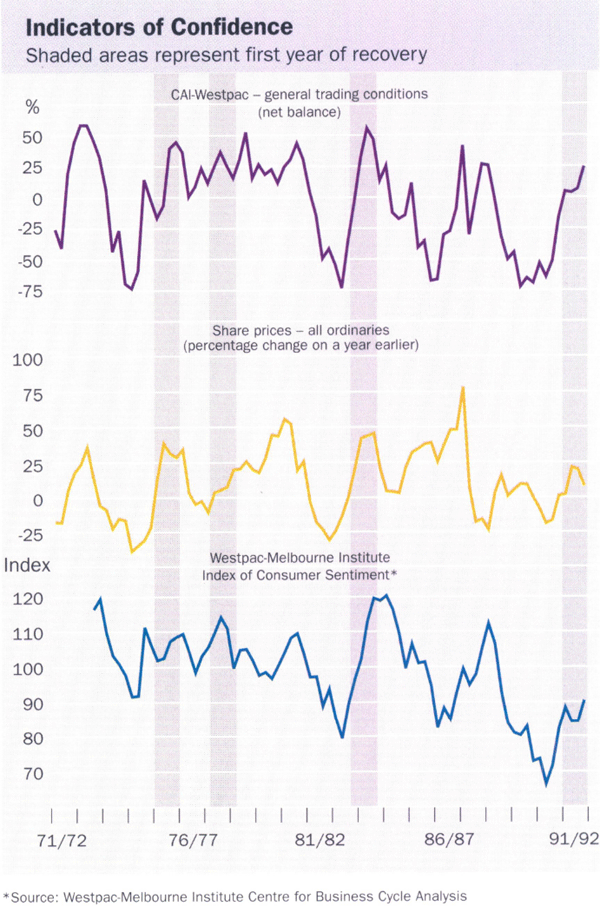
Business investment, on the other hand, continued to fall. There was good reason to expect that construction activity in major business districts would weaken further, and remain low for some time, given the surplus of commercial property space in most of those areas. Even for plant and equipment, it will take some time for a pick-up to occur. Nevertheless, an improvement in business sentiment was evident in mid 1991 in both survey-based measures of confidence and in higher share prices. In the labour market, employment and job vacancies stopped falling. There were, therefore, some grounds for believing that a moderate recovery was beginning.
This was the situation around the time of last year's Budget, when official forecasts pointed to a return to moderate growth in 1991/92. A modest rise in domestic expenditure was expected, augmented by a pick-up in net exports. Real GDP was forecast to grow by around 3¾ per cent between June 1991 and June 1992, somewhat slower than most recoveries, and to be associated with a continuing high level of unemployment and low inflation.
As for several other economies, however, even these relatively modest expectations of recovery proved to be optimistic. While demand and output showed some increase in the second half of 1991, the pace was slower than had been expected. Drought affected significant parts of the rural economy. Consumer confidence fell away, and the robust pace of growth in consumption spending was not maintained in the December quarter. Business confidence, although up from its low point, stalled at levels well short of those seen in other recoveries. Apparent demand for credit by business was subdued, with credit outstanding falling, and no sign of any pick-up in the rate of new lending commitments for commercial purposes. A period of political instability around the turn of the year added to general uncertainty about both short-term economic prospects and the stance of policy.
The labour market stagnated with employment changing little over the second half of 1991, and with part-time jobs continuing to replace full-time jobs. There was little sign of any upward trend in job vacancies, which has traditionally heralded a return to growth in employment. In these circumstances, the rate of unemployment continued to drift higher, reaching 10½ per cent by December.
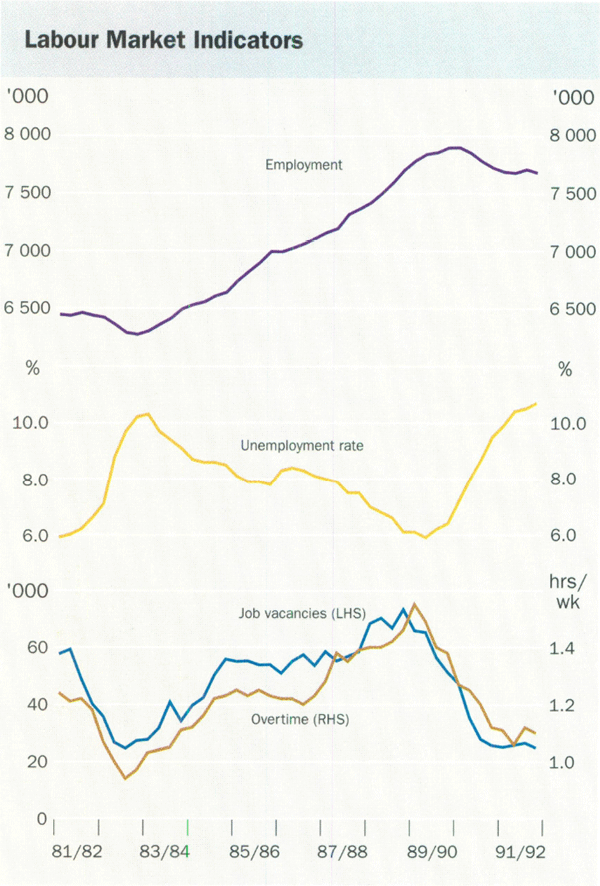
The weakness of employment has persisted despite the absence of major increases in real wages like those which had characterised the 1982 and 1974 downturns. Moreover, a distinctive feature of the present episode has been the extent of the fallout in the service sector (including the public sector) of the economy. Employment has fallen sharply in parts of the public sector, financial services, and transport and communication; this is in contrast to the 1982/83 recession, when employment in these areas kept growing or declined only slightly.
The patchy recovery continued in the first half of 1992. Consumer demand for retail goods strengthened in the March quarter, after the weak December quarter outcome, and rose further in the June quarter, helped by the one-off supplementary payment to families in April. Sales of motor vehicles rose in March, aided by the reduction in sales tax, but fell back during the June quarter.
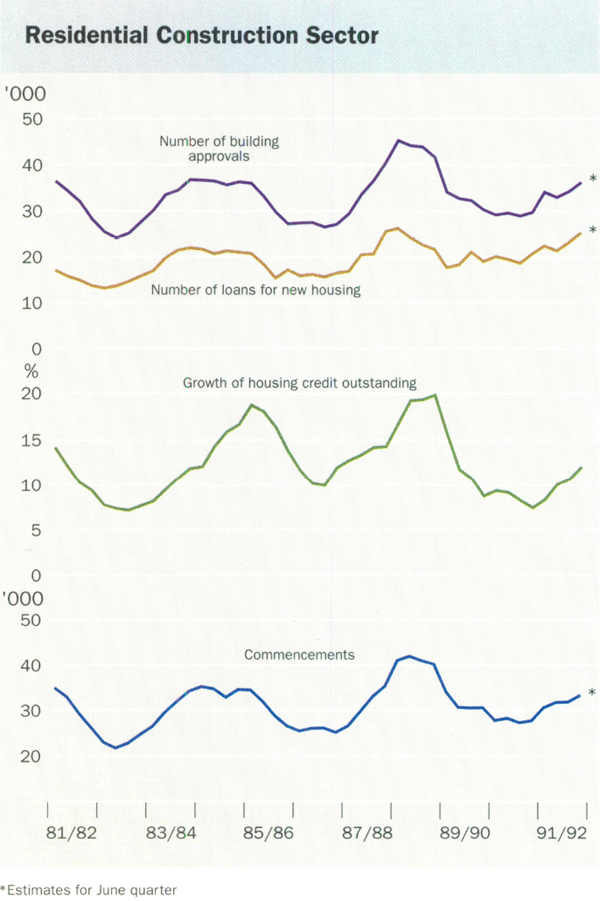
Lending for housing, which had paused towards the end of 1991, began to rise strongly again early in the new year, on the back of lower interest rates and strong competition amongst lenders. For some months, lending for established housing ran well ahead of lending for the purchase or construction of new homes. This again raised the possibility that a rapid expansion in borrowing for the purchase of the existing stock of housing might drive up house prices relatively early in the cycle, while the rest of the economy lagged way behind. To date, however, the evidence suggests there has been little pick-up in established house prices, except in Queensland where prices have continued to rise, partly reflecting that State's strong population growth.
Overall, the pace of recovery during 1991/92 has been much more subdued than in the rebound from the 1982/83 recession, and slower than was envisaged a year ago. Despite the rises in consumption and housing investment, growth was not sufficient to make any inroads into unemployment, especially with business confidence remaining weak. In June the rate of unemployment reached 11 per cent.
In part, this weakness reflects the hangover of imbalances which developed during the upswing of the cycle, particularly the expansion of commercial property space and the high indebtedness in parts of the corporate sector. The regional data are consistent with this view, with Queensland leading the recovery and Victoria lagging on most indicators.
The sluggish recovery also reflects the adjustment to lower inflation and the other structural changes occurring in the economy. Periods of weak activity often provide the catalyst for change, which takes time to run its course. Businesses, for example, needed to alter their strategies, and have been doing so; they have been concentrating on reducing costs, raising productivity and lowering their gearing. All these have slowed the recovery but they will help to sustain a robust expansion through the years ahead.
Balance of Payments
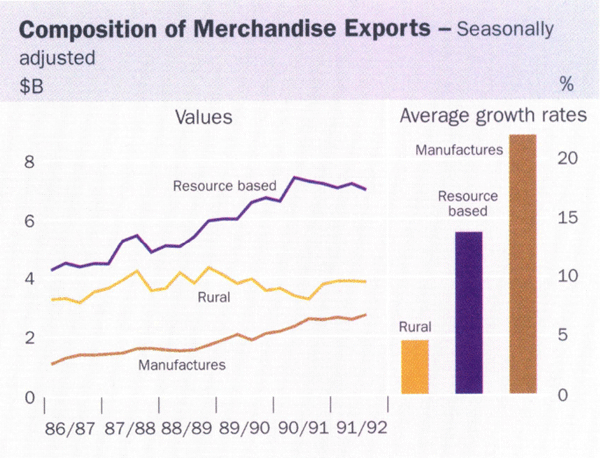
Australia's balance of payments improved in 1991/92, despite a rise in imports. The value of merchandise imports was around 3½ per cent higher than in 1990/91. Exports were also stronger, maintaining a high level after a sharp rise in the middle of 1991; lower rural export volumes, largely as a result of drought-reduced wheat shipments, were offset by higher prices, mainly for cereals. Resource-based exports declined, reflecting lower prices. Manufactured exports continued to grow, although less strongly than in the previous few years. The merchandise trade surplus, combined with an expansion of tourism receipts, lifted the balance on goods and services into surplus, the first since 1979/80.
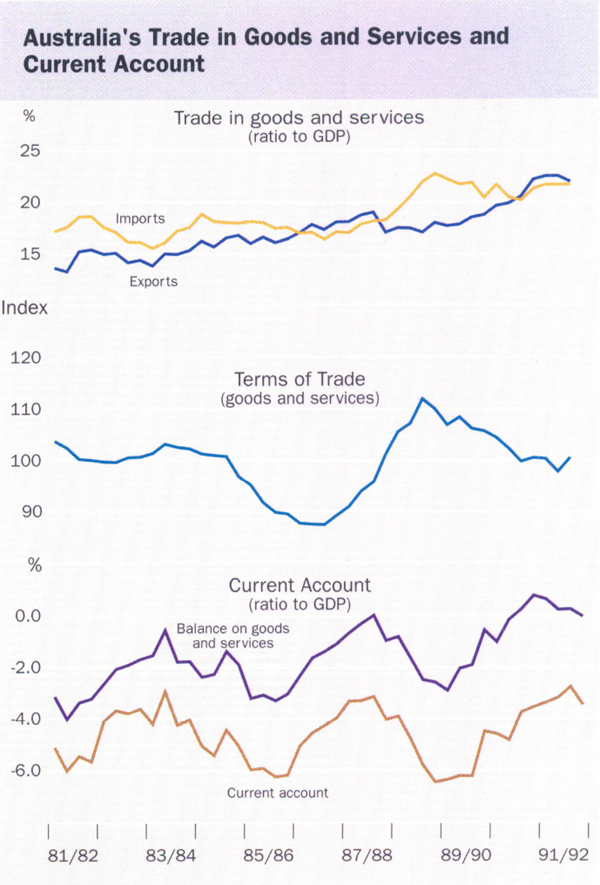
The net income deficit declined to $15.7 billion, from $18 billion in 1990/91. This reflected a decline in the cost of servicing foreign liabilities, mainly as a result of lower interest rates on foreign debt. For the year to March 1992, the annual interest burden represented around 17 per cent of the value of exports of goods and services, around 3 percentage points lower than two years earlier.
The current account deficit fell to $11.8 billion, equivalent to around 3 per cent of GDP and the smallest deficit on this basis for over a decade. Even with the modest deficit, some rise in net foreign liabilities was to be expected, particularly as the decline in the exchange rate added to the value of foreign-currency-denominated debt measured in $A terms. Total net foreign liabilities rose to be around 53 per cent of GDP (at end March), 5 percentage points higher than a year earlier. Net foreign debt rose to 39 per cent of GDP, from 36½ per cent a year earlier.
Inflation and Monetary Policy
The rate of inflation declined further last year with most “headline” measures of prices – such as the Consumer Price Index (CPI) – recording their lowest increases since the 1960s. The CPI rose by 1.2 per cent in the year to June 1992, compared with 3.4 per cent in the preceding year. The CPI was again affected by factors which are best excluded when estimating an “underlying” rate. These include falls in mortgage interest and consumer credit charges, which reduced the recorded CPI rise by about 1.3 percentage points, and rises in government taxes and charges, which impacted in the other direction. A measure of prices of goods and services supplied predominantly by the private sector, and therefore a reasonable guide to inflation in that part of the economy over which monetary policy can be expected to have most direct influence, rose by 2.1 per cent over the year to June 1992, compared with 4.1 per cent in the year to June 1991. All other price indicators recorded low rates of increase.
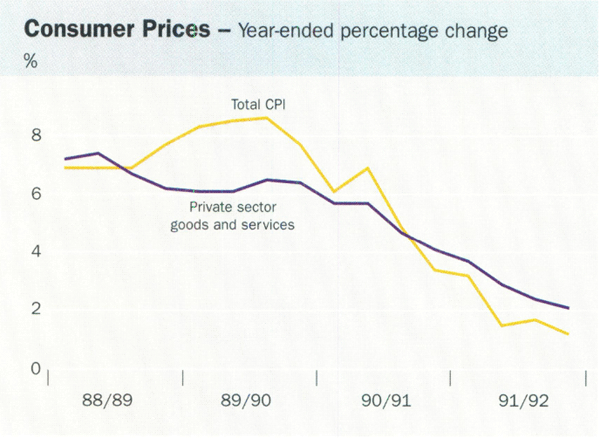
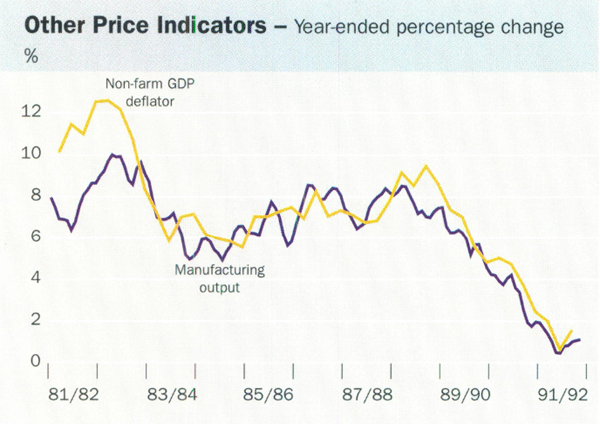
This decline in the rate of inflation occurred notwithstanding a decline in the exchange rate. In the year to June 1992 the Trade-weighted Index fell by 7½ per cent. While there were, at times, concerns that a sharp fall might prejudice continued improvement in inflation, the fall has had little apparent effect on retail prices of imported goods to this time; prices of items in the CPI deemed to be “wholly or predominantly imported” rose by 0.4 per cent in the year to June 1992.
With the flat demand for labour, the high rate of unemployment and lower inflation, the pace of general wage increases also slowed. No centralised wage increase occurred during 1991/92. The shift in focus to enterprise bargaining continued, although the coverage of such agreements appears limited at this time: enterprise bargains ratified by the Industrial Relations Commission cover around 2–3 per cent of the work force, although many other agreements are thought to be close to ratification or already in force privately. Where details of agreements are available, they tend to relate to genuine improvements in productivity.
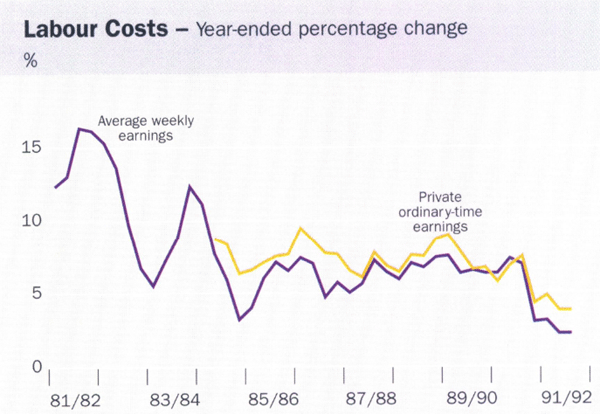
Award wages rose by 2.9 per cent in the year to May, down from 3.2 per cent in the preceding 12 months. The bulk of this increase reflected the flowthrough from the April 1991 National Wage decision; it was influenced also by the continuing adjustments of some awards to reflect increases from National Wage Cases as far back as 1989, and other technical adjustments to awards. Figures for average weekly earnings similarly show a slowing. Private sector ordinary-time earnings rose by 3.8 per cent in the year to February, compared with 7.5 per cent in the year to February 1991. The data are affected by compositional changes, which make for a volatile quarter-to-quarter pattern, but the overall rise in average earnings of 2.2 per cent in the year to February was the lowest increase since the early 1960s. The modest rises in unit labour costs over the past year have helped to underwrite the low price rises.
| June 1990 | June 1991 | Latest | |
|---|---|---|---|
| Consumer prices | |||
| CPI | 7.7 | 3.4 | 1.2(1) |
| Prices for privately provided goods and services* |
6.4 | 4.1 | 2.1(1) |
| Private consumption deflator | 6.0 | 3.7 | 2.2(2) |
| Producer prices | |||
| Manufacturing output prices (excluding petroleum) |
5.1 | 1.9 | 1.1(3) |
| House building materials prices | 6.4 | 3.2 | −0.8(3) |
| Other building materials prices | 7.4 | 3.5 | −1.1(3) |
| Broader measures | |||
| Domestic final demand deflator | 5.3 | 2.9 | 1.6(2) |
| Gross non-farm product deflator | 4.8 | 2.4 | 1.6(2) |
| Nominal labour costs | |||
| Award wage index | 6.4 | 2.4 | 2.9(3) |
| Private sector ordinary-time earnings | 6.7 | 4.3 | 3.8(4) |
| Unit labour costs† | 10.4 | 1.0 | 1.2(2) |
|
(1) June (2) March (3) May (4) February * Total CPI less fresh fruit and vegetables, fuel, mortgage interest charges, consumer credit charges, public dwelling rents, local government rates and charges, household fuel and light, postal and telephone services, motoring charges, urban transport fares, health services, pharmaceuticals, and education and child care. † Treasury series. |
|||
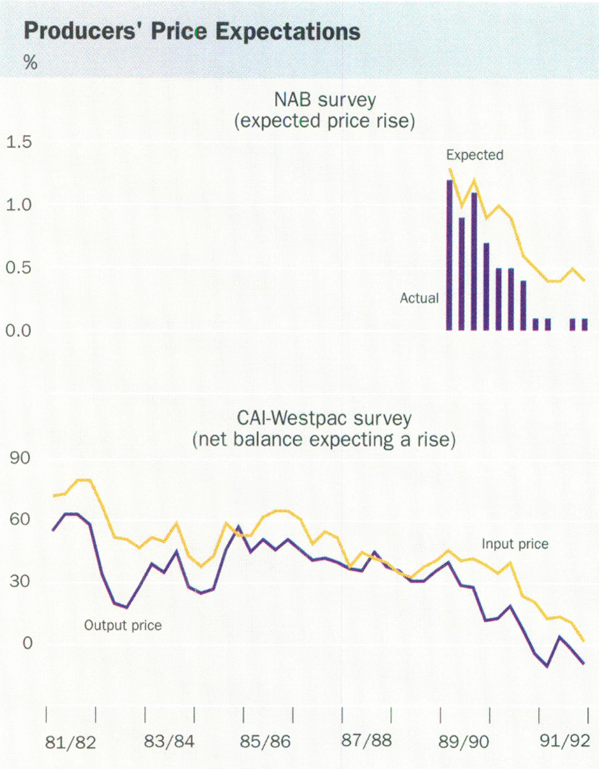
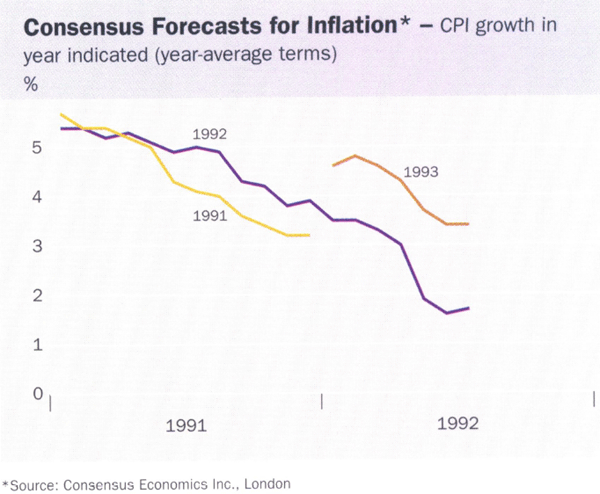
Measures of inflationary expectations showed a further downward adjustment. The Melbourne Institute's median price expectation series (which typically overestimates actual inflation) has fallen to around 4 per cent, less than half of the average recorded during the 1980s. Responses in business surveys to questions about costs and expected selling prices point to low expectations, and forecasts for CPI inflation in 1992 and 1993 by surveyed economists have been revised down sharply. The latter forecasts for 1993 incorporate some pick-up in CPI inflation from the low rates in 1992, in large part reflecting the dropping-out of the effects of reductions in mortgage interest rates, which are reducing the headline inflation rate in 1992. The reduction in inflationary expectations was reflected also in long-term security yields, which fell from around 11 per cent in June 1991 to a little over 8½ per cent by mid 1992.
As evidence emerged that the economy was recovering only gradually, and that inflation and inflationary expectations were falling further, steps were taken to reduce interest rates. Cash rates, which in June 1991 were 10½ per cent, were lowered in five steps – in September, November, January, May and July. This brought to thirteen the number of occasions that cash rates had been reduced since January 1990, and the total size of the decline to a little over 12 percentage points.
| Percentage points | |
|---|---|
| 23 January 1990 | ½ – 1 |
| 15 February 1990 | ½ |
| 4 April 1990 | 1 – 1½ |
| 2 August 1990 | 1 |
| 15 October 1990 | 1 |
| 18 December 1990 | 1 |
| 4 April 1991 | ½ |
| 16 May 1991 | 1 |
| 3 September 1991 | 1 |
| 6 November 1991 | 1 |
| 8 January 1992 | 1 |
| 6 May 1992 | 1 |
| 8 July 1992 | ¾ |
On each occasion, the Bank continued its policy of announcing the intended changes on the day they were implemented. The announcements explicitly linked the falls in interest rates to evidence both that economic activity was weak, and that inflation – past and prospective – was falling. With the exception of some of the early reductions, these linkages were generally acknowledged by market participants and public commentators.
The concern about economic activity was a legitimate concern in its own right, and did not imply any lessening of resolve on reducing inflation. The weakness in activity aside, in an environment where inflation and inflationary expectations were falling, not to reduce nominal interest rates would have been tantamount to an unwarranted tightening of policy.
In coming to judgments about possible changes in interest rates, the Bank continued to draw upon a wide range of data. These included, in addition to information on the rate of inflation itself and the state of the real economy, the range of financial aggregates. Although by no means reliable indicators these days, the aggregates tended to support judgments that policy was quite firm, economic growth slow, and potential inflationary pressure minimal.
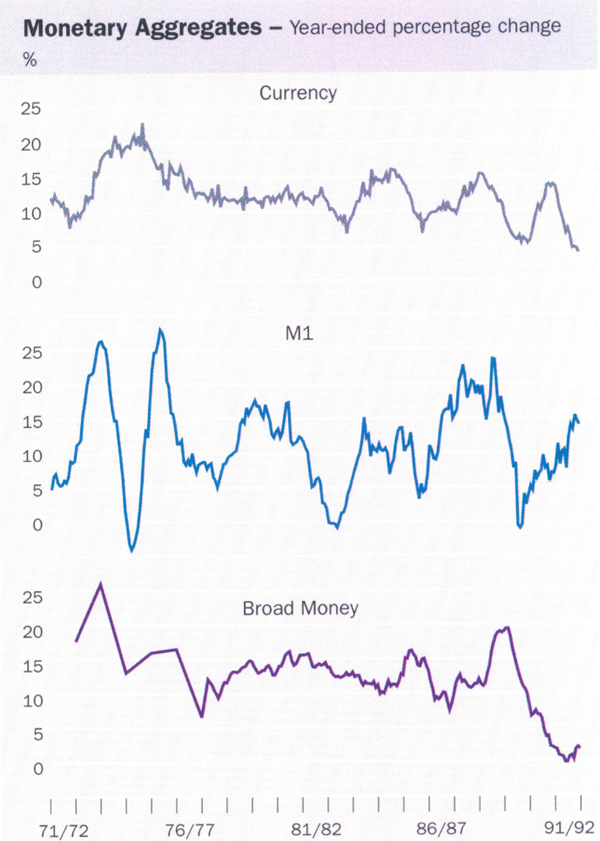
The broader monetary aggregates rose very slowly, reflecting a reduced need for intermediaries to fund credit growth. Both M3 and broad money rose at low single-digit rates. The narrow aggregates showed a more uneven performance. M1 growth varied, but on the whole was quite fast. This was mainly the result of interest-rate changes (to which it is highly sensitive), and also some restructuring of products by banks in mid 1991, which widened the range of accounts with chequing facilities. Currency had grown quite quickly in 1990/91, partly in response to new laws which discouraged the opening of false bank accounts and dealings in large sums of cash with financial institutions. These adjustments were largely completed in the early part of 1991/92 and currency growth slowed noticeably.
Total credit outstanding to the private sector from financial intermediaries fell by around 2 per cent in the year to June, compared with a rise of 2 per cent through the preceding year. Credit for housing rose by about 12 per cent, in line with the emerging recovery in that sector. Credit extended to business, which accounts for about two-thirds of total credit, fell by 6 per cent in the year to June. Even when allowance is made for provisions for bad debts by banks and write-offs by non-bank intermediaries, business credit outstanding fell a little over the year.
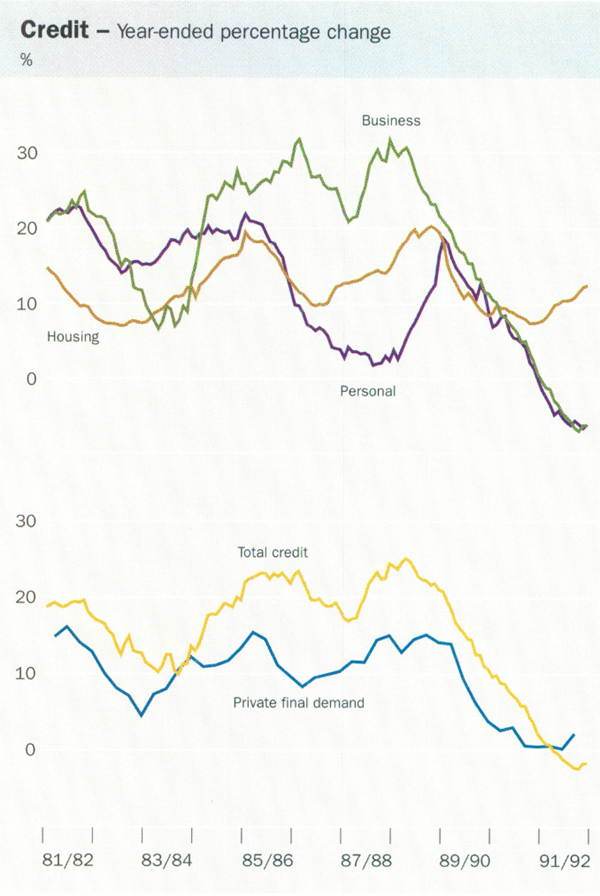
Actions by businesses to reduce debt burdens were reflected in new equity raisings by non-financial corporations of over $9 billion during 1991/92, about 65 per cent higher than in the preceding year. This restructuring of balance sheets, which may affect observed credit growth for some time, is an understandable adjustment after the growth in debt/equity ratios in the 1980s. At the same time, borrowing rates for business have remained relatively high in real terms. This is a more serious problem for small businesses, which do not have the same direct access to capital markets as large firms. The Bank placed some importance on this factor in its decisions to lower interest rates.
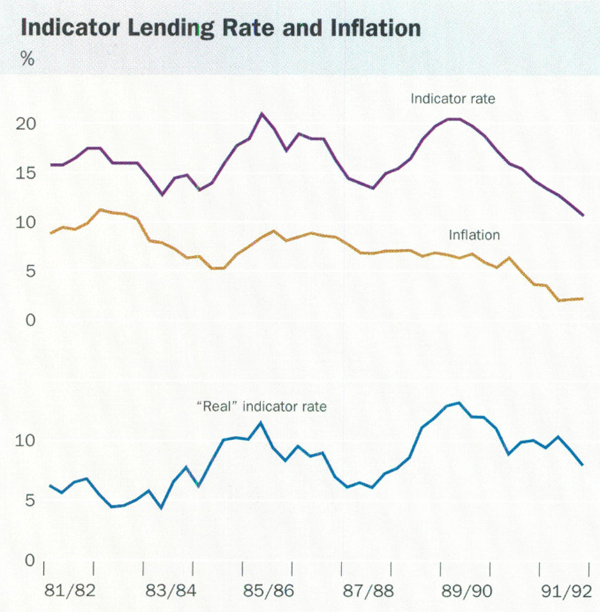
Computations of real interest rates are inevitably imprecise, since the expected rate of inflation is not directly observable, nor is it the same for each borrower. Considerations of the tax deductibility of interest are also involved. On most simple measures using past rates of inflation, however, real interest rates are relatively high compared with historical experience, especially having regard to the state of demand and output. Even if the rate of inflation expected for the medium term is somewhat higher than recent actual rates, real interest rates for most borrowers remain relatively high. With inflation falling, demand for credit weak and business investment falling, these considerations suggested that there was room for falls in nominal interest rates, and a modest reduction in real interest rates, over the year.
The term structure of nominal interest rates is another source of potential information. Cash rates fell substantially below long-term interest rates during the year for the first time since 1987/88. At face value, an upward-sloping yield curve is usually taken as suggesting that markets believe that short-term rates will not remain at present levels, but rise to higher levels in future. The message about inflation from this is somewhat ambiguous, however, since it cannot be separated from expectations about future real interest rates and premia built into longer-term rates reflecting uncertainty. While observing carefully the reaction of securities markets to economic events and changes in policy, the Bank was not inclined to see any particular degree of slope of the yield curve as offering a hard and fast rule for the operation of monetary policy.
Looking Ahead
A year or so after the economy reached its lowest ebb, it is apparent that recovery so far has been patchy, and weak overall. Over the next twelve months, subject as always to developments abroad and policies at home, the prospects are for a faster pace of growth.
The decisive reduction in inflation over the past two years has permitted lower interest rates, and a more accommodative attitude on the part of monetary policy to growth. Policy settings will continue to be adjusted in the light of information about the economy, with a view to keeping inflation low during the recovery. As the adjustment to lower inflation progresses, there will be increased scope for the productive sectors to move ahead. This will be helped by the fiscal expansion in train from the February Economic Statement and the Budget.
Looking further ahead, the economy still faces a considerable adjustment task over the next several years. Some progress has been made in the balance of payments area, and the lower inflation environment can only be good for overall savings performance, and for the process of allocation of those savings. On both counts potential growth, and therefore capacity to service foreign obligations should, in time, be higher. This progress will need to be consolidated, and furthered, in the years ahead.
To recover from the recession without a permanently higher level of unemployment, but with the external accounts structurally improving and inflation low, is a considerable challenge. Minimising the fallout of the recession on the labour market will require balanced macro-economic policies, acting on the demand side of the economy. It will also require further micro-economic policies aimed at increasing flexibility on the supply side. In particular, successful competition in the international market place ultimately requires a highly skilled and adaptable labour force.
The Public Sector Borrowing Requirement (PSBR) has turned around sharply over the past three years, from a surplus approaching 2 per cent of GDP in 1988/89 to a deficit of about 5 per cent of GDP in 1991/92. Much of the rise in public borrowing is driven by weak output growth and sluggish employment. To this extent it will be reversed as recovery proceeds. Given that, and the fact that Australia's public debt is not especially large by world standards, temporarily large deficits do not of themselves pose a serious problem. On the other hand, the pace of recovery is likely to be slower than in the 1980s. In addition, the fall in inflation has reduced the automatic growth in revenues associated with a taxation system which is not indexed for rises in prices and wages. State Governments also will find their own-source revenues growing more slowly. These factors will make it more difficult to wind back the PSBR than in the 1980s, as well as limiting the scope for further discretionary increases in spending or cuts in taxes.