Reserve Bank of Australia Annual Report – 1992 Financial Markets and the Bank's Operations
Developments in Financial Markets
The primary influences on domestic financial markets over the past year have been falling inflation and inflationary expectations, and associated changes in monetary policy. The five easings of monetary policy were implemented, in the usual way, by operations in the short-term money market to lower overnight cash rates. The easings were broadly anticipated in money markets, where short-term yields had declined prior to the Bank's operations. This is hardly surprising, given that market participants focus on the same basic data and are generally aware of the Bank's broad objectives.
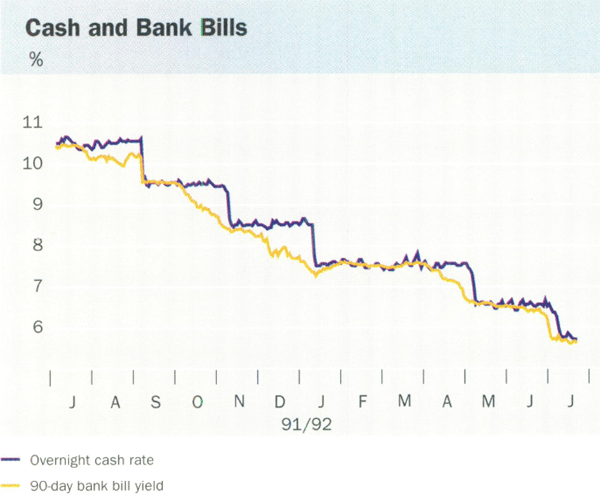
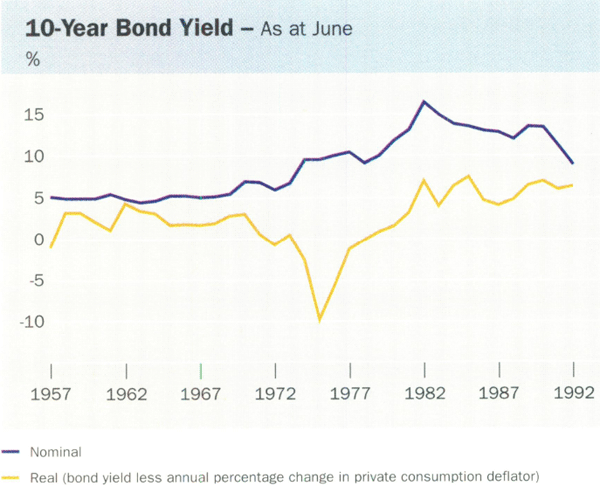
Yields on longer-term securities also fell significantly during 1991/92 in response to the decline in the rate of inflation and, more importantly, to growing confidence that low inflation could be sustained. There were some temporary setbacks, most notably in January when concerns about possible fiscal expansion led to a sharp rise in bond yields. Yields on 10-year bonds, which had fallen by close to 2 percentage points between July 1991 and early January 1992, reversed about half that movement over the subsequent few weeks.
Those concerns subsided after the Government's Economic Statement was released in February and the markets' focus returned to trends in inflation and activity. With the March quarter CPI figure confirming low rates of inflation, the bullish trend in yields re-emerged. By mid year long bond yields had fallen to a little over 8½ per cent, a reduction of around 2½ percentage points from mid 1991, and their lowest levels since 1974. (In real terms, however, yields are a good deal higher than they were in the 1970s.)
The substantial fall in long-term security yields occurred notwithstanding an increase in the stock of bonds on issue, reflecting the increased public sector deficit. Ten Treasury bond tenders were held during the year, totalling around $13 billion. Almost half of the bonds issued were in new long benchmark lines, maturing in October 2002 and August 2003.
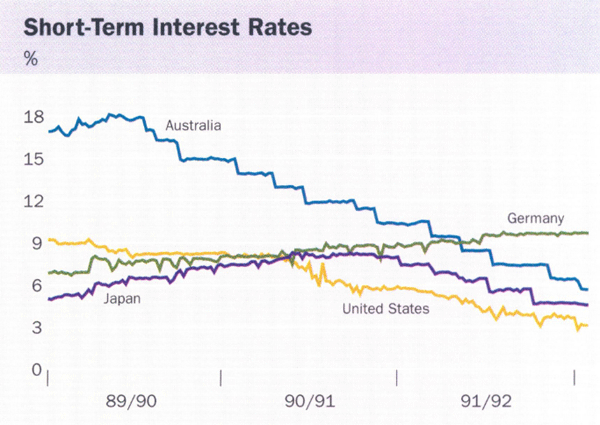
The fall in Australian interest rates in 1991/92 further eroded the large interest differentials previously in favour of Australian dollar assets. This was most marked against European countries, where interest rates rose with the tightening of German monetary policy, but was evident also against the US and Japan, notwithstanding reductions in interest rates in those countries during the year. Differentials for long-term yields also fell, although by a smaller degree.
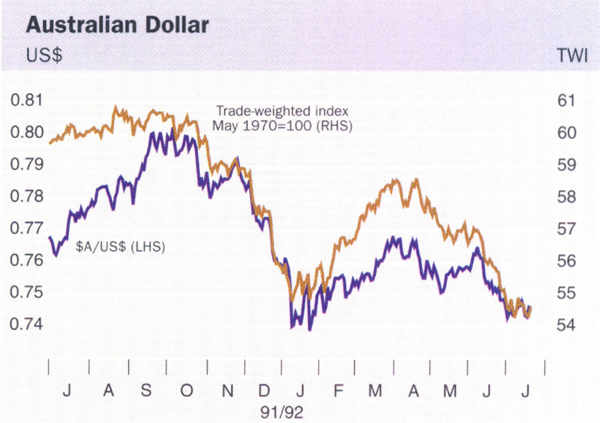
Some decline in the Australian dollar was to be expected in light of these trends in interest rates. Indeed, given the decline in interest rates since early 1990 it was surprising that the exchange rate had not declined earlier, especially against the background of weakening terms of trade. Until September, however, the Australian dollar tended to rise, buoyed in part by strong overseas demand for Australian bonds, which offered the prospect of significant capital gains as yields fell in line with inflationary expectations. With this strong inflow of funds into longer-term securities, the easing in short-term interest rates in September had little effect on the exchange rate.
By late October, with bond yields having fallen substantially, that source of demand for Australian dollars started to wane. At the same time, anticipation of a further easing in short-term interest rates was building and, in contrast to earlier episodes, this seemed to be affecting the exchange rate as the narrowing of interest differentials between Australia and overseas came into sharper focus. The November easing in Australia was followed soon after by rises in European rates and this combination of interest-rate changes saw Australian short-term interest rates fall below German rates for the first time since the early 1970s. Selling pressure on the currency increased in December, on the back of uncertainty about changes in the political leadership.
To this point the Bank's operations in the foreign exchange market had been modest and directed towards maintaining orderly market conditions. Australian dollars were sold during the September quarter but repurchased in the December quarter in line with movements in the exchange rate. The market, however, became very unsettled early in 1992 in the lead-up to the Government's Economic Statement. This period was peppered with rumours of an impending fiscal expansion and perceptions of the Government favouring a lower exchange rate.
The Bank believed the market was reacting over this period to fears about future policy directions that were not well based. It was also concerned that unwarranted falls in the exchange rate would limit the scope to lower interest rates in support of the recovery. In trade-weighted terms, the dollar already had fallen 8 per cent from its September peak and, while that could be absorbed, any further sharp falls would weaken confidence and threaten a resurgence of upward pressure on prices.
To help steady the market the Bank became a heavy buyer of Australian dollars throughout January; for the month as a whole purchases amounted to $4.3 billion. This intervention was successful in calming the market. After the Economic Statement was released at the end of February, the exchange rate recovered its December quarter levels. The rate drifted lower in April and again in June in anticipation of further interest rate easings, but these movements occurred in an orderly way and with little further intervention. The Australian dollar ended the year 2½ per cent lower against the US dollar and 7½ per cent lower in trade-weighted terms (the latter reflecting falls of the US dollar against some other major currencies).
There have been other occasions when the Bank has intervened heavily to influence the exchange rate but these have been limited to particular conjunctions of circumstances such as existed last January. In normal circumstances, the Bank sees the foreign exchange market as the appropriate mechanism for reflecting changes in interest rates and other relevant factors, notwithstanding its tendency to overshoot (in both directions) from time to time.
Over the course of 1991/92, the Bank's market purchases of foreign exchange amounted to $1.7 billion and its sales to $6.1 billion, the latter concentrated in January. All foreign exchange operations are “sterilised” in the sense that any addition to or withdrawal of Australian dollars from the market is fully offset by domestic market operations so that it does not change domestic financial conditions.
Intermediaries' Interest Rates
Banks' and other intermediaries' lending and borrowing rates have fallen roughly in line with the decline in market rates.
Since mid 1991, rates on banks' fixed deposits and cash management accounts have fallen by 4½ percentage points, about the same as the fall in money market rates (including those on banks' certificates of deposit); rates on statement and investment accounts have declined by about 3 percentage points; there have been smaller changes in rates for certain other transaction-type balances at banks. On average, banks' deposit interest costs have fallen by about 3 percentage points over the past year or so.
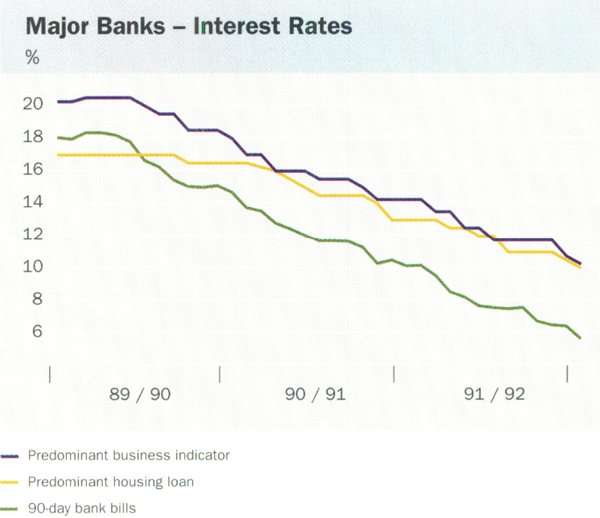
This fall has been matched by the average fall in loan rates. Banks' business loan indicator rates have fallen by about 4 percentage points. In early August 1992, the major banks' indicator rates for larger customers ranged from 9.75 to 10 per cent; for small to medium-sized firms they ranged from 10 to 10.5 per cent. Most borrowers pay a margin for risk on top of the indicator rates but, in the great majority of cases, actual borrowing rates have declined in step with the indicator rates.
Bank interest rates on standard variable-rate housing loans to owner-occupiers are at least 3 percentage points lower than a year ago. Competition in this market has seen the major housing lenders offer special terms to new customers, including those who switch from other intermediaries. Interest rates on these offers (which are capped or fixed for terms of up to 12 months) range from 7.75 to 8.95 per cent, compared with rates of about 10 per cent on loans approved prior to the introduction of the special offers. Competition also has resulted in some reductions in housing loan-related fees.
Several banks have turned their attention towards being more competitive in the business area over the past year. Some large banks have introduced special offers on loans to small to medium-sized businesses for expansion purposes (they are not available for the refinancing of existing loans). Rates on these loans are around 2 percentage points below those that would normally apply.
Interest rates on bank credit cards were reduced by 1 to 2 percentage points in December 1991, and by a further 2½ to 3¼ percentage points in total after the monetary easings in May and July. These were the first reductions in rates on cards offering a substantial period of interest-free credit since the introduction of Bankcard in 1974.
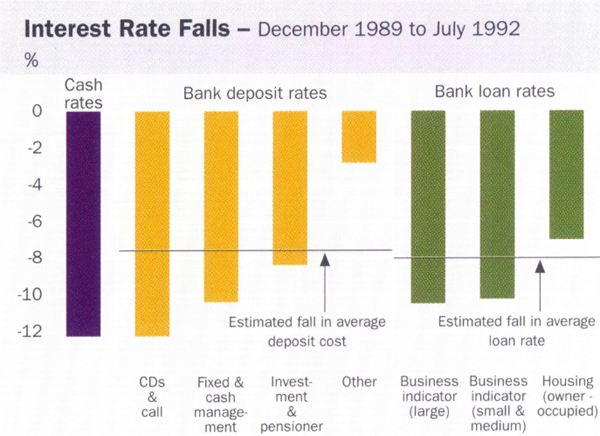
Looking over the period since January 1990, when the easing in cash rates commenced, it is fair to say that banks overall have responded broadly in line with the reductions in official rates.
Movements in banks' average deposit rates and their average loan rates over this period have been broadly similar. Rates on call deposits and certificates of deposit have declined by 12 percentage points – as much as cash rates – but they account for only about 15 per cent of deposits; cheque and passbook accounts, which represent 30 per cent of deposits, have fallen by only 3 per cent. The average deposit rate has fallen by about 8 per cent. Against that, business indicator rates have been reduced by over 10 per cent and standard housing loan rates by about 7 per cent.
This is another way of saying that there is no evidence of any general widening of average interest margins; taking one year with another, average interest margins appear to have changed little over the past decade. It is not, however, to endorse the present level of margins, nor to imply that they should remain at present levels. The ongoing efficiency gains from competition could be expected, in time, to narrow the interest spread.
Some commentators have suggested that banks have sought to improve their profitability by increasing fees. Non-interest income (fees and income from trading and other activities) is an important part of banks' total earnings, although interest margins make up the bulk of revenues. Banks' non-interest income has risen a little in the past two years, mainly in the form of increased profits from securities trading. Even so, as a ratio to assets, non-interest income appears to be much the same as it was five years ago. The data available to the Bank do not suggest that banks generally have been increasing their lending fees to offset the fall in bank profitability caused by bad debts and other non-performing loans.
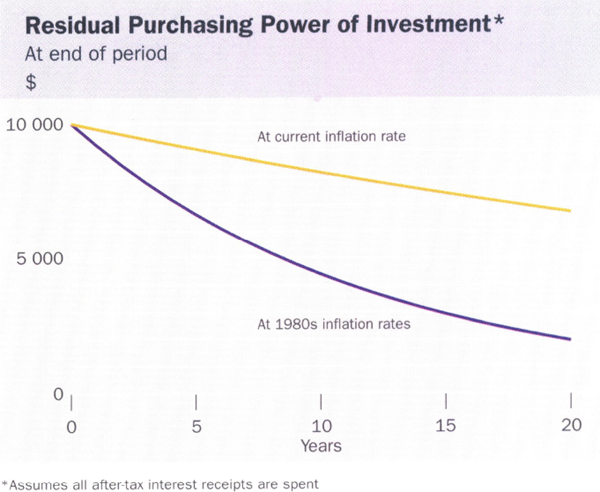
As interest rates have come down, depositors, particularly retirees, have expressed concerns about the effects of those falls on their incomes. It is true that deposit interest rates have fallen a long way over the past two and half years, to levels last seen about two decades ago. It would have been unrealistic, however, to have expected anything like the exceptionally high interest rates in 1989 to persist; they coincided with a period of very tight monetary policy and were bound to fall once the need for such tight policy had passed. Another general point to remember is that high nominal interest rates embody a premium to compensate depositors for the effect which inflation has in eroding the real value of their savings; in other words, part of high interest receipts is not really income but compensation for the erosion of capital.
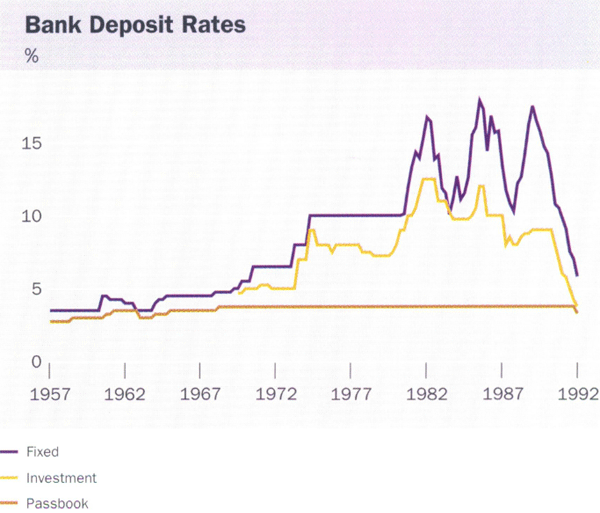
The partly illusory effects of high interest rates in periods of high inflation can be illustrated in a numerical example. In the 1980s interest rates on bank fixed deposits averaged around 13½ per cent. Over the same period, inflation averaged around 8½ per cent. On a $10,000 deposit the figuring would be as follows:
| $p.a. | |
|---|---|
| Interest received at 13½% | 1,350 |
| Interest after tax at 20%* | 1,080 |
| Amount to compensate for inflation | 850 |
| Remaining income (“real” return) | 230 (2.3 per cent). |
| * Illustrative; the “real” return would vary from about minus 2 per cent (at 50 per cent marginal tax rate) to about 5 per cent (if no tax were paid). | |
Deposit interest rates have fallen sharply so far in the 1990s but so has inflation. Currently, bank fixed deposit rates are around 5½ per cent and inflation is around 2 per cent, generating the following figures:
| $p.a. | |
|---|---|
| Interest received at 5½% | 550 |
| Interest after tax at 20%* | 440 |
| Amount to compensate for inflation | 200 |
| Remaining income (“real” return) | 240 (2.4 per cent). |
| * Illustrative; the “real” return would vary from under 1 per cent (at 50 per cent marginal tax rate) to 3½ per cent (no tax). | |
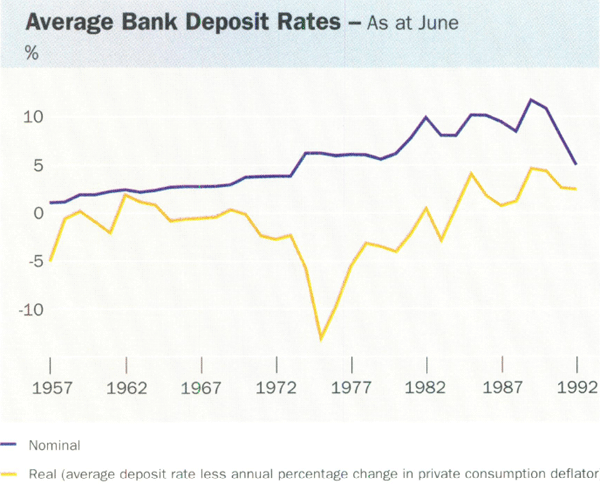
Precise outcomes depend, of course, on individual circumstances but the main point
is clear enough:
the benefits of high interest receipts are at least partly illusory because of the
effects which high inflation has on capital. In the 1980s, depositors who were
concerned to protect the purchasing power of their capital needed to retain
a high proportion of their after-tax interest income. If instead of doing this
they spent all their interest income they were, in effect, eating into their
capital. Today the same depositors could supplement their reduced interest
income stream by drawing down their capital. The main difference is that, in
a low inflationary environment, that decision is a deliberate one whereas,
in periods of high inflation, capital is eroded surreptitiously.
