Bulletin – August 2004 Asian Capital Flows[1]
- Download 67KB
Introduction
The Asian region has returned to experiencing net inflows of private capital over the past couple of years, after several years of outflows following the Asian crisis.[2] At the same time, the large current account surpluses which emerged after the crisis have persisted (Graph 1). With both the current account and capital account of the balance of payments in surplus, the authorities in these countries have resorted to heavy intervention in foreign exchange markets in order to limit upward pressure on exchange rates. In doing so they have accumulated very large amounts of foreign exchange reserves; during 2002 and 2003, their reserve holdings rose by about US$380 billion.
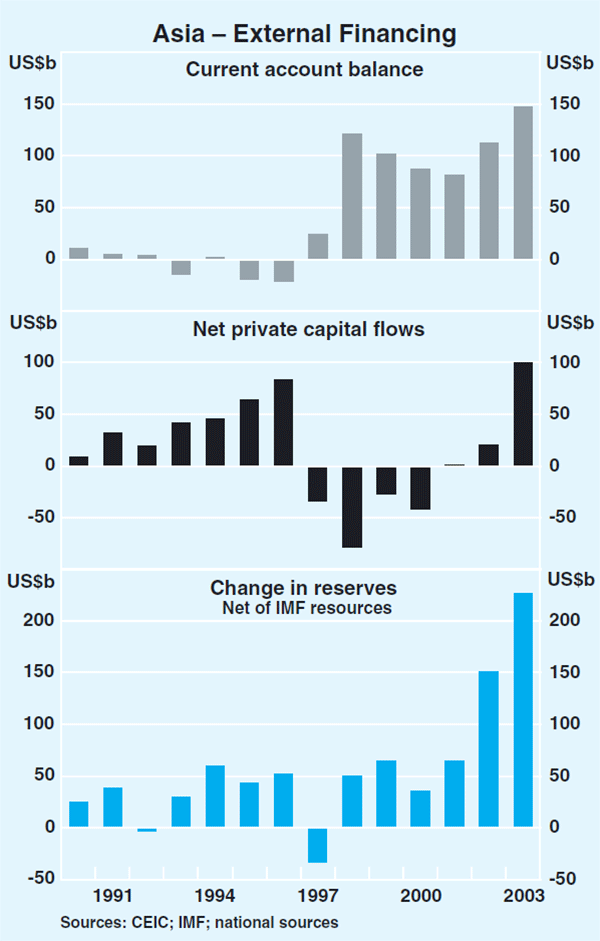
This article examines net private capital flows to the region over the past decade. It focuses on recent trends in the composition of flows, which have seen capital directed predominantly towards the rapidly expanding Chinese economy.
Trends in Net Private Capital Flows
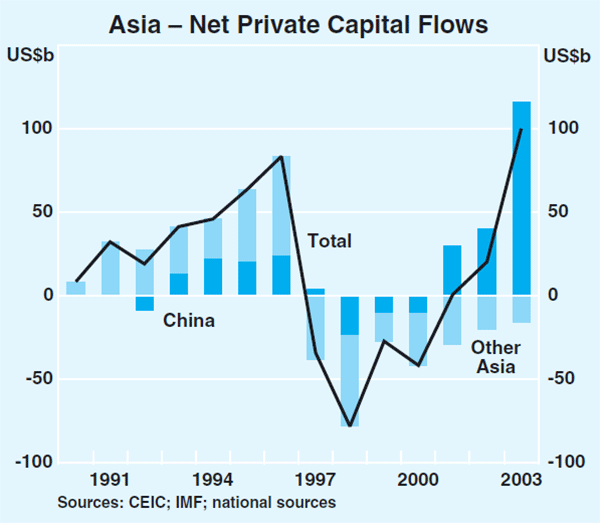
From a relatively modest level of US$9 billion (3 per cent of regional GDP) in 1990, net private capital flows into Asia built steadily over the first half of the 1990s, to peak at more than US$80 billion (14 per cent of regional GDP) by 1996 (Graph 2). This build-up reversed sharply as the Asian financial crisis unfolded, with net outflows also peaking at around US$80 billion (12 per cent of regional GDP) in 1998 – a US$160 billion turnaround from two years earlier.
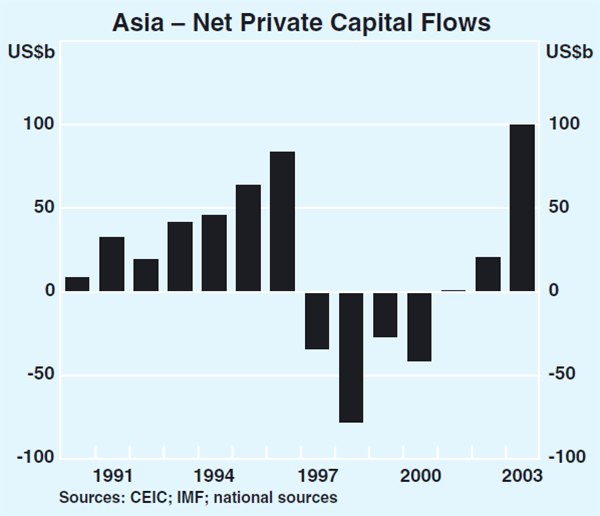
Net outflows persisted through to 2000, with significant net private capital inflows resuming in 2002. In 2003 they reached around US$100 billion, exceeding their pre-crisis peak (though as a share of GDP, inflows in 2003 were still below their 1996 high).[3]
Within these aggregate figures, there has been a marked divergence in the composition of net flows (Graph 3).[4] Net foreign direct investment inflows, typically the most stable form of private capital flows reflecting their long-term nature, slowed only modestly following the crisis, from a peak of around US$55 billion to US$40 billion in 2001. Since then annual net inflows have returned to around US$50 billion. In contrast portfolio investment – largely investment in debt securities and shares – has been subject to large swings. Net portfolio inflows increased significantly over the first half of the 1990s, as strong growth in gross portfolio investment in the region from the rest of the world outpaced growth in gross Asian portfolio investment abroad – by 1996 net inflows of US$15 billion were recorded. Over 1997 and 1998, however, the Asian crisis saw a US$35 billion turnaround in net portfolio flows, with net outflows of US$20 billion occurring in 1998. The reversal was driven by a collapse in gross investment in the region from abroad, which fell from around US$40 billion in 1996 to nearly zero in 1998. Over 1997 and 1998, somewhat surprisingly, Asian gross portfolio investment abroad was relatively stable, falling from around US$25 billion in 1996 to US$20 billion in 1998.
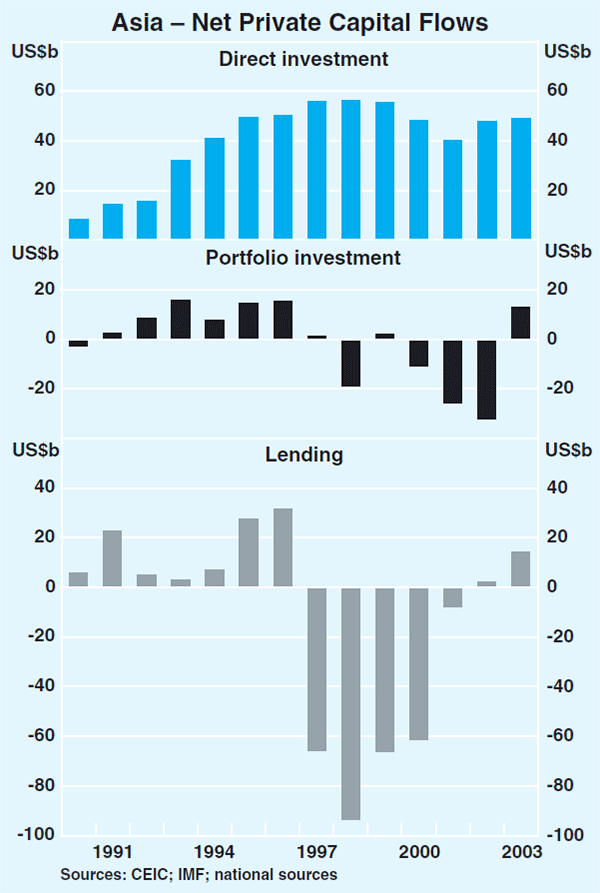
In 1999 the region saw the return of a small net portfolio inflow, as gross investment to the region from abroad recovered to around US$30 billion while gross portfolio investment to the rest of the world remained unchanged. However, over the following three years net outflows resumed, peaking at US$32 billion in 2002. In contrast to the initial reversal in 1997 and 1998, the outflow of net portfolio investment between 2000 and 2002 was driven by both an increase in gross Asian portfolio investment abroad and a slowdown in gross investment in the Asian region by foreigners. Gross portfolio investment abroad by the Asian region increased from around US$25 billion in 1999 to nearly US$45 billion in 2002, while gross foreign portfolio investment in Asia fell from around US$30 billion in 1999 to around US$15 billion in 2002.
In 2003, net portfolio flows reversed again, with outflows of US$32 billion in 2002 giving way to inflows of US$13 billion. In this most recent episode, the reversal looks to have been driven primarily by a surge in gross portfolio investment in the Asian region from abroad. Gross investment by the Asian region in the rest of the world in 2003 was down only marginally from the relatively high level seen in 2002.
The remaining categories of capital flows have been even more volatile, and have been largely responsible for the pattern of aggregate flows since the crisis. Consisting mainly of loans, deposits and trade credit, they are referred to here as ‘lending flows’. Unlike direct and portfolio flows, net lending flows only began to make a significant contribution to net capital inflows to Asia in 1995 and 1996. However, the crisis saw net lending inflows of US$30 billion in 1996 give way to large net outflows, peaking at over US$90 billion in 1998. The fact that post-crisis net outflows were far in excess of net inflows immediately prior to the crisis suggests significant capital flight on the part of residents, in addition to the withdrawal of lending by non-residents.
Net lending outflows peaked in 1998, with inflows again recorded in the past two years. However, at around US$15 billion in 2003, net inflows remain below their pre-crisis level and represent a small fraction of the net outflows that occurred between 1997 and 2001.
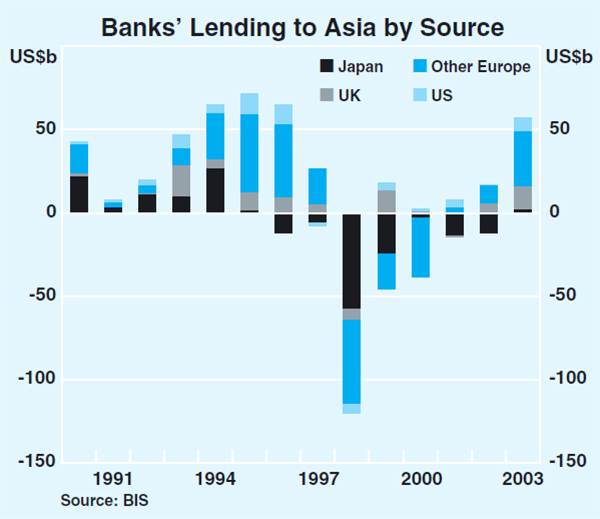
The net lending inflows seen over the first half of the 1990s in part reflected the eagerness of global commercial banks to provide finance to the rapidly growing region. However, as the crisis began to unfold in 1997, commercial banks reassessed the risk associated with lending to Asia, resulting in a large retrenchment of commercial bank lending to the region.
Data from the Bank for International Settlements (BIS) help to illustrate this by providing bank lending flows from the perspective of foreign banks, allowing bank lending to Asia to be split by source country (Graph 4).[5] The data show that Japanese banks were significant lenders to Asia before the crisis but started to withdraw lending in 1996 – before the Asian crisis hit. This suggests that distress in the Japanese banking system was a partial cause of the outflows, which was compounded by the subsequent impact of the crisis itself. The largest lenders to the region immediately prior to the crisis were the European banks. While lending from all regions was withdrawn following the crisis, lending by UK banks returned reasonably quickly with more recent inflows reflecting the return of lending from other European countries.
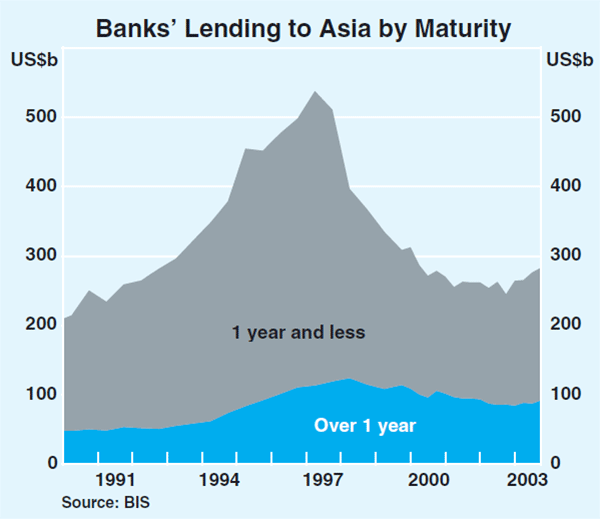
BIS data also provide other insights into trends in lending to Asia by foreign banks. Firstly, the share of outstanding foreign loans to Asia that are short-term has declined moderately since the Asian crisis, falling from around 80 per cent of the total in 1996 to 70 per cent now (Graph 5). In contrast, the share of outstanding short-term loans to China has increased from just over 50 per cent at the end of 1996 to around 60 per cent in December 2003.
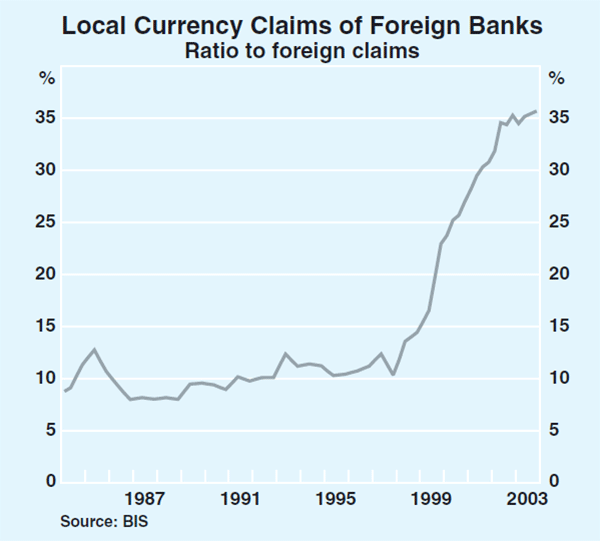
Secondly, foreign banks' lending to Asian countries is occurring to a far greater degree via local affiliates, and is taking place in local currency. In December 2003, such loans made up 35 per cent of total lending to Asia by foreign banks, up from 10 per cent in 1996 (Graph 6). In part this probably reflects a response to the difficulties experienced with foreign currency loans as regional currencies depreciated during the crisis. It also reflects the acquisition of distressed local banks by foreign banks in the aftermath of the crisis and the general trend to consolidation in banking sectors.
Country Composition
A breakdown of capital flows by recipient country indicates that the return of net flows to the region has been uneven. Capital has been directed very heavily towards China over recent years, while in net terms it has continued to flow out of the other Asian countries in aggregate; apart from China, only Korea and Taiwan saw net inflows in 2003 (Graph 7, Table 1). In gross terms, both investment abroad by the non-China Asian economies, and foreign investment to non-China Asia have slowed over recent years.
| 2003 | |
|---|---|
| China | 97.8 |
| Indonesia | −1.0 |
| Korea | 14.5 |
| Malaysia | −3.8 |
| Philippines | −5.3 |
| Singapore | −25.1 |
| Taiwan | 6.7 |
| Thailand | −8.1 |
|
(a) Does not include errors and omissions Sources: CEIC; IMF; national sources |
|
Reflecting relatively strict capital controls, net capital flows to China have been heavily skewed to foreign direct investment – one form of capital inflow that is generally encouraged (Graph 8). After making up only 30 per cent of all net foreign direct investment in the Asian region in 1990, China accounted for 97 per cent of regional net foreign direct investment in 2003.
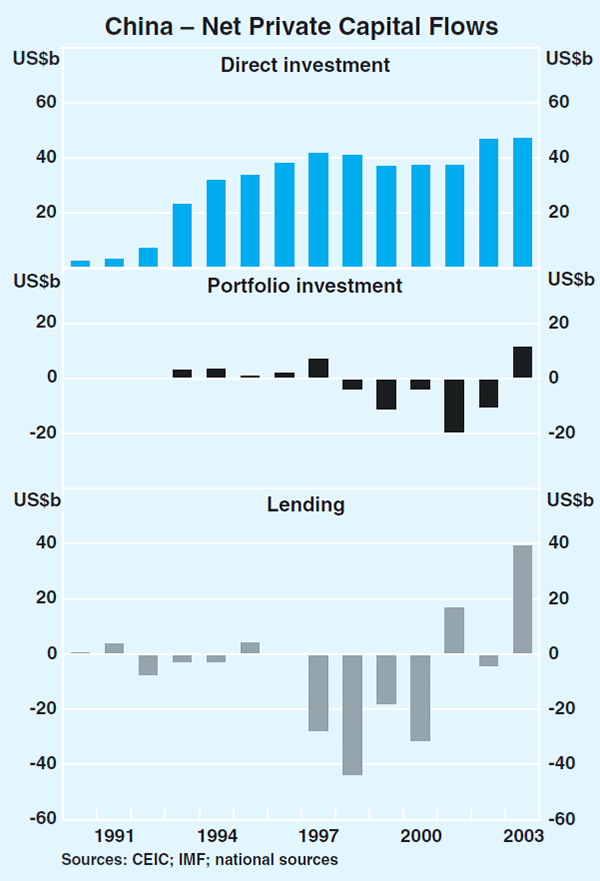
Although capital controls limit lending and portfolio flows to China, the pattern of such flows following the crisis was broadly similar to that observed for Asia as a whole, though on a smaller scale. Net lending and portfolio outflows over 1997 to 2000 might in part have reflected domestic entities shifting funds offshore to the extent possible in expectation of a currency devaluation or in response to concerns about the stability of the banking system. Sentiment has subsequently shifted sharply, with expectations in 2003 focusing on the possibility that the Chinese exchange rate would be revalued, encouraging net lending and portfolio inflows totalling US$50 billion. While this appears to have been a factor behind the sharp rise in total net capital flows to China last year, more recently non-deliverable forward rates have suggested that expectations of a revaluation have diminished, as the US dollar has appreciated.
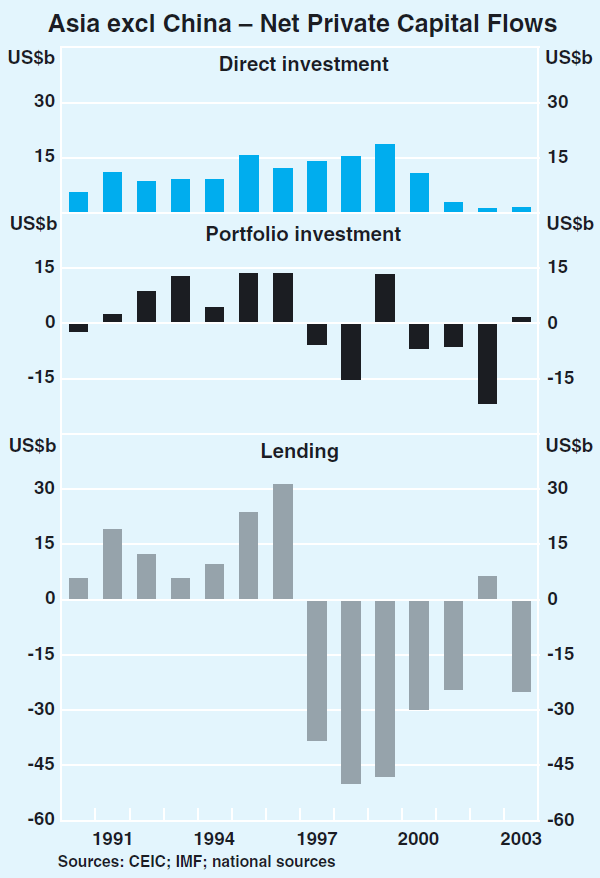
Net portfolio and lending flows to the rest of the region have generally been negative since the crisis and have more than offset direct investment inflows which themselves have become quite small (Graph 9). The result has been ongoing net outflows in aggregate from these countries. The weakness in portfolio flows to non-China Asia largely reflects developments in the ASEAN countries and Taiwan, with portfolio inflows to Korea continuing at healthy levels in most years.
Footnotes
This article was prepared by David Wakeling, Lamorna Rogers and Darren Flood of International Department. The focus is non-Japan Asia, covering China, Indonesia, South Korea, Malaysia, the Philippines, Singapore, Taiwan and Thailand. Hong Kong is excluded due to an insufficiently long run of data. For the sake of simplicity the article refers to non-Japan Asia simply as ‘Asia’. [1]
The regional data presented in this article are aggregated from individual country data, sourced from the IMF and national sources. Note that these data include intra-regional flows. To the extent that these flows have changed as a proportion of the total, the data may misrepresent trends in external flows to the region. Errors and omissions of the balance of payments have been allocated to capital flows in the aggregate data. Data are adjusted for the transfer of US$45 billion from Chinese foreign exchange reserves to two Chinese state commercial banks in 2003. [2]
As a share of regional GDP, the net inflow was 11 per cent in 2003, still below the 14 per cent seen in 1996. [3]
Components do not sum to the total seen in Graph 2, as the latter includes errors and omissions. [4]
The data in Graphs 4 to 6 are sourced from the BIS Consolidated Banking Statistics. This collection is not intended to conform to balance of payments principles and hence is not directly comparable with the data presented up to this point. Among other things, the data presented in the graphs record only claims, without netting off liabilities, and location is determined on the basis of headquartering, rather than the place of residence of the lender (e.g. lending by UK-owned banks and all their offshore subsidiaries is classed as UK-sourced lending). BIS data include banks' security holdings and hence are broader than the ‘lending’ category used elsewhere in this article, but do not include derivatives exposures. [5]