Bulletin – March 2014 Australian Economy Employment Outcomes of the Economically Disadvantaged
- Download the article 1007KB
Abstract
As part of its liaison program, the Bank meets with community organisations to discuss the labour market and other opportunities and challenges faced by economically disadvantaged persons in Australia. The data available suggest that economic conditions faced by the disadvantaged generally improved over the years leading up to the global financial crisis, though they have deteriorated somewhat since then. Nonetheless, around half of those who were economically disadvantaged in 2005–06 had moved out of this category by 2011–12. Finding employment was an important pathway out of economic disadvantage, although this outcome depended in part on a person's skills and the type of job obtained. The majority of people who remained economically disadvantaged over this period were not in employment, and community organisations note that many of them face a range of structural barriers to finding employment.
Introduction
Through its liaison program, the Bank meets regularly with community organisations in order to understand in more depth the economic conditions faced by economically disadvantaged members of society. These organisations include agencies providing job assistance, disability, welfare, housing and financial counselling services. The employment opportunities and outcomes of disadvantaged groups have been a prominent theme in these discussions. This article presents the insights that the Bank has gained from this liaison, as well as information on the nature of economic disadvantage gathered from the HILDA Survey, which provides a longitudinal annual snapshot of household income, wealth, employment and other characteristics.[1]
Measuring Economic Disadvantage
Economic disadvantage can be defined and measured in different ways, both quantitatively and qualitatively. In discussions with the Bank, community organisations generally define a disadvantaged person qualitatively as someone who genuinely needs their services. Typically, they struggle to find employment, experience financial hardship and/or face significant housing instability. In this article, disadvantage is defined quantitatively as households in the bottom quintiles of both the income and wealth distributions in the HILDA Survey.[2] This quantitative measure enables an examination of the dynamics of disadvantage, tracking the characteristics of households that were able to move out of disadvantage over time. While disadvantage also encompasses an array of factors not related to income and wealth – such as education, health standards, social exclusion and the ability to access services and infrastructure – low income and wealth are common symptoms of disadvantage.
Based on this definition, the HILDA data indicate that around 9 per cent of Australian households headed by a person no older than 70 years of age were experiencing economic disadvantage in 2011–12 (Table 1). Median household income for this group was around $19,600, which was less than half the HILDA sample median of $43,800.[3] The difference in wealth was significantly larger: median wealth for disadvantaged households was $6,200, less than 2 per cent of the sample median ($386,000), primarily reflecting differences in the degree of home ownership. Persons within economically disadvantaged households also had significantly lower levels of employment than the full HILDA sample. These income, wealth and labour market characteristics were broadly similar to households that reported in the HILDA Survey that they had asked a community organisation for help, suggesting that the key messages gathered from the Bank's liaison with community organisations are likely to be representative of the economically disadvantaged group as defined in this article.
| Household | Share of people | |||||
|---|---|---|---|---|---|---|
| Share of households | Median equivalised income(a) | Median wealth(a) | Not in the labour force |
|||
| Per cent | $ | $, 2010 | Employed | Unemployed | ||
| Economically disadvantaged | 9 | 19,600 | 6,200 | 29 | 10 | 61 |
| Asked a community group for help | 3 | 22,900 | 17,000 | 43 | 12 | 45 |
| HILDA – full sample | 100 | 43,800 | 386,000 | 72 | 3 | 25 |
|
(a) Measured in 2011/12 dollars; see footnote 3 for definition of ‘equivalised’ income Source: HILDA Release 12.0 |
||||||
Recent Trends
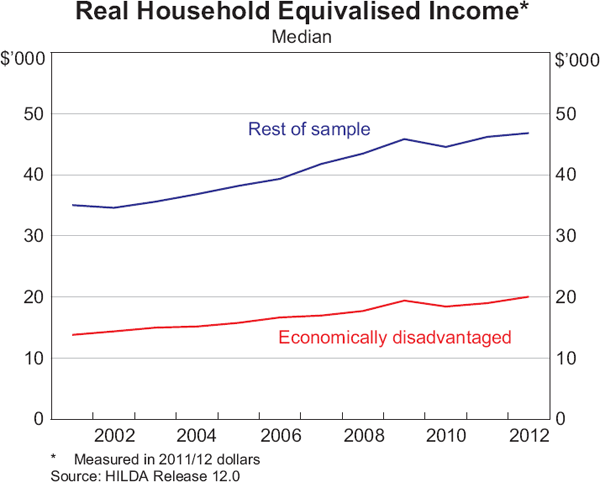
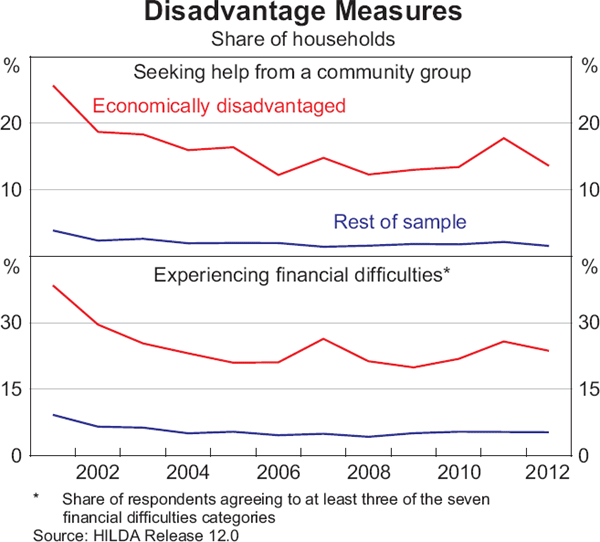
The median, or typical, financial status of the economically disadvantaged group – and the gap between this group and the rest of the population – varies over time. Overall, economically disadvantaged households benefited from the relatively strong economic conditions in Australia between 2001 and 2008, with real incomes rising, on average, by 3½ per cent a year (Graph 1). In line with this improvement, the HILDA Survey shows that the share of these households reporting that they sought assistance from a community organisation declined by half over this period (to around 12 per cent) while the share reporting that they were experiencing financial difficulties fell by over one-third (to around 20 per cent; Graph 2).
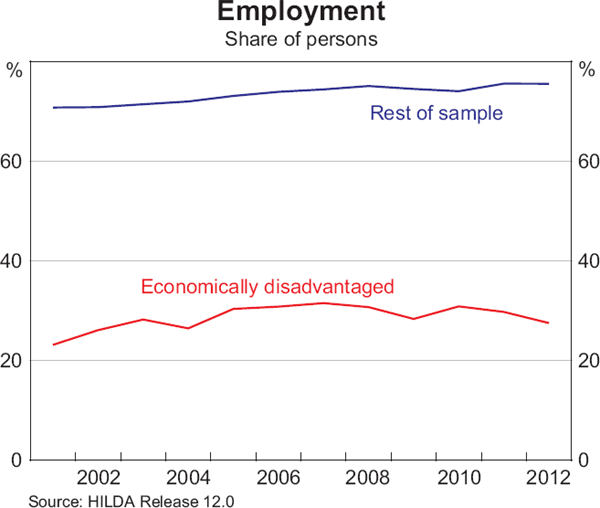
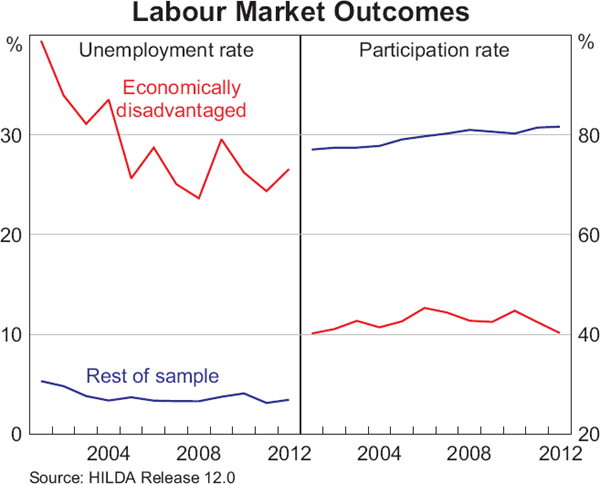
This improvement in conditions occurred alongside an improvement in labour market outcomes for the disadvantaged and the general decline in the national unemployment rate over this period, which fell from 6.8 per cent in 2001 to 4.2 per cent by 2008. The share of persons from economically disadvantaged households that were in employment increased significantly, and the large employment gap between the economically disadvantaged and the rest of the sample narrowed somewhat (Graph 3). Reflecting this, the unemployment rate for economically disadvantaged Australians fell by over one-third (to around 24 per cent) and there was a gradual rise in their participation rate (Graph 4). Since the onset of the global financial crisis, however, conditions for the economically disadvantaged have not continued to improve, and community organisations have reported an increase in the demand for their services, including for financial assistance and financial counselling.
Dynamics within the Economically Disadvantaged Group
The HILDA data can also be used to examine the characteristics of people who tend to move out of – or remain in – economic disadvantage over time.[4] Around half (49 per cent) of those who were economically disadvantaged in 2005–06 were no longer in that category by 2011–12 as their income had increased above the lowest quintile threshold (Table 2).[5]
| Labour force status in 2011–12 | Remained disadvantaged | Moved out of disadvantage |
|---|---|---|
| Probability Per cent |
Probability Per cent |
|
| For those disadvantaged in 2005 or 2006 (total sample) | ||
| All | 51 | 49 |
| – Employed | 12 | 35 |
| – Unemployed | 4 | 2 |
| – Not in the labour force | 35 | 12 |
| For those disadvantaged and employed in 2005 or 2006 (31 per cent of total) | ||
| All | 33 | 67 |
| – Employed | 15 | 58 |
| – Unemployed | 4 | 1 |
| – Not in the labour force | 14 | 7 |
| For those disadvantaged and not employed in 2005 or 2006 (69 per cent of total) | ||
| All | 62 | 38 |
| – Employed | 11 | 22 |
| – Unemployed | 5 | 2 |
| – Not in the labour force | 47 | 14 |
|
Source: HILDA Release 12.0; subcategories do not necessarily add to the total due to rounding |
||
Community organisations report that employment status is an important, though not always sufficient, factor in determining whether a person remains economically disadvantaged over time. In line with this, the HILDA data indicate that three-quarters of those who moved out of disadvantage (35 percentage points of the overall 49 per cent) had either obtained or retained a job over this period. There is also some evidence that the longer someone has a job, the more likely he or she is to move out of economic disadvantage over time. Of those disadvantaged people who were employed in 2005–06, 80 per cent who still had a job in 2011–12 had moved out of disadvantage. The corresponding share for those who did not have a job in 2005–06 but had obtained employment by 2011–12 was smaller, at 65 per cent. Conversely, the biggest determinant of whether a person remained in economic disadvantage over the period was employment status, with 75 per cent of those not employed in either 2005–06 or 2011–12 remaining economically disadvantaged. The rest of this section examines the typical characteristics of persons who found employment and those who did not become employed over this period.
Characteristics of persons in employment
While employment is a key means of providing a path out of disadvantage, community organisations note that the type of job obtained is an important determinant of success in this regard. People who obtained a full-time job were more likely to move out of disadvantage than those who worked casual or part-time hours (Table 3).
| Employment status in 2011–12 | Remained disadvantaged | Moved out of disadvantage |
|---|---|---|
| Probability Per cent |
Probability Per cent |
|
| Employed | 11 | 22 |
| – Full-time | 2 | 13 |
| – Part-time/casual | 8 | 9 |
| Of which: available to work more hours | 4 | 3 |
| Not employed | 51 | 16 |
|
Source: HILDA Release 12.0; subcategories do not necessarily add to the total due to rounding |
||
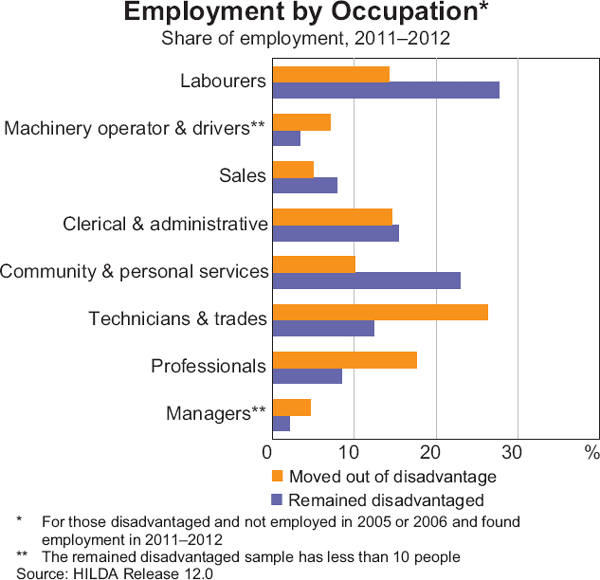
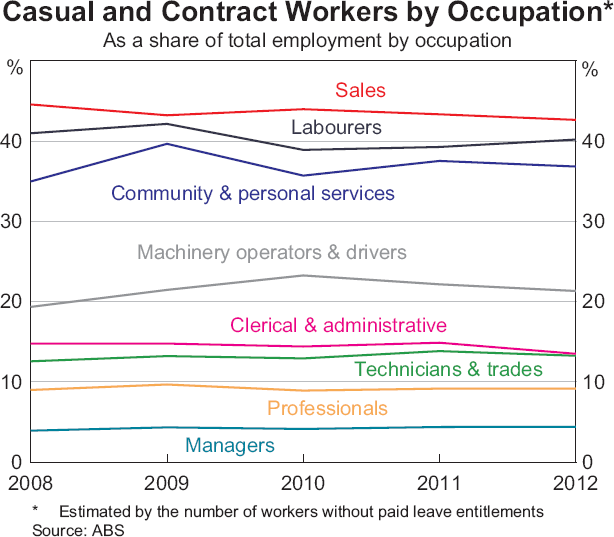
Differences in the likelihood of moving out of disadvantage relative to remaining disadvantaged exist across industries. Those who found a job as a machinery operator, technician & tradesperson or as a professional were more likely to have moved out of disadvantage; many of them were students in 2005–06 (Graph 5). The opposite was true for those who found employment as labourers or community & personal service workers, which are industries that have a high proportion of casual and contract workers (Graph 6). The HILDA data show that around half of those who worked casual or part-time hours were available to work longer hours.
There is, however, some evidence that people who start in casual and part-time employment generally move to full-time employment and out of disadvantage over time. The HILDA data indicate that 70 per cent of those who had a casual or part-time job in 2005–06 were still employed in 2011–12, and over 80 per cent that found full-time employment were no longer disadvantaged (Table 4). While 70 per cent of those who retained casual or part-time employment also moved out of disadvantage, obtaining a full-time job appears to have been more effective in this regard. Community organisations note that casual jobs tend to be concentrated in particular industries, suggesting that these employees are more likely to find non-casual employment if they change industries.
| Employment status in 2011–12 | Remained disadvantaged | Moved out of disadvantage |
|---|---|---|
| Probability Per cent |
Probability Per cent |
|
| Employed | 18 | 53 |
| – Full-time | 5 | 26 |
| – Part-time/casual | 12 | 27 |
| Not Employed | 21 | 9 |
|
Source: HILDA Release 12.0; subcategories do not necessarily add to the total due to rounding |
||
A person's job options depend in part on their skills and experience, with those having low skills and limited experience less likely to obtain higher-paying jobs that often require specialised skills and/or substantial experience. The economically disadvantaged tend to have low skills on some measures compared with the general population. In 2011–12, around 50 per cent of the economically disadvantaged did not complete high school, compared with around 25 per cent for the full HILDA sample. Furthermore, comparing the education and experience of the economically disadvantaged who found a job and those who did not highlights the importance of a person's skills. Those who had moved out of economic disadvantage by 2011–12 typically had more education and more experience, having spent a greater share of their working-age life in employment (Table 5). Community organisations note that low skills are especially problematic for older workers.
| Labour force status in 2011–12 | Remained disadvantaged | Moved out of disadvantage | ||
|---|---|---|---|---|
|
Education index |
Experience index |
Education index |
Experience index |
|
| Employed | 2.3 | 0.4 | 2.4 | 0.5 |
| – Full-time | 2.3 | 0.5 | 2.6 | 0.5 |
| – Part-time/casual | 2.3 | 0.4 | 2.1 | 0.5 |
| Unemployed | 2.0 | 0.3 | 2.3 | 0.4 |
| Not in the labour force | 1.8 | 0.3 | 1.8 | 0.4 |
|
(a) Education: 1 – did not finish year 12; 2 – finished year 12; 3 – certificate (equivalent to TAFE); 4 – bachelor or diploma; 5 – PhD or master's degree; experience: proportion of working life (15 years+) spent in paid work; data are averages Source: HILDA Release 12.0 |
||||
Characteristics of persons not in employment
The persistence of economic disadvantage is especially pronounced for those not in employment. Community organisations report three interrelated factors that can explain why people tend to remain unemployed or economically inactive over time: unavoidable job turnover, especially for those in casual employment; limited job opportunities for low-skilled workers to enter or re-enter employment; and structural barriers that reinforce the cycle of economic disadvantage.
Higher risk of unemployment and limited employment opportunities
Community organisations note that the economically disadvantaged have a higher level of job turnover than the rest of the employed population. The HILDA data show that while the probability of being retrenched or laid off for the economically disadvantaged was broadly similar to that for the rest of the sample, the disadvantaged were around five times more likely to leave a job for personal reasons such as illness or to care for someone (Table 6). In addition, nobody from an economically disadvantaged household reported in the HILDA survey that they ended their employment to obtain a better job, highlighting their concerns regarding employment prospects.
| Main reason for stopping work | Economically disadvantaged | Rest of sample |
|---|---|---|
| Retrenched or laid off | 27 | 31 |
| Own illness/looking after others | 19 | 4 |
| Obtain a better job | 0 | 4 |
|
Source: HILDA Release 12.0 |
||
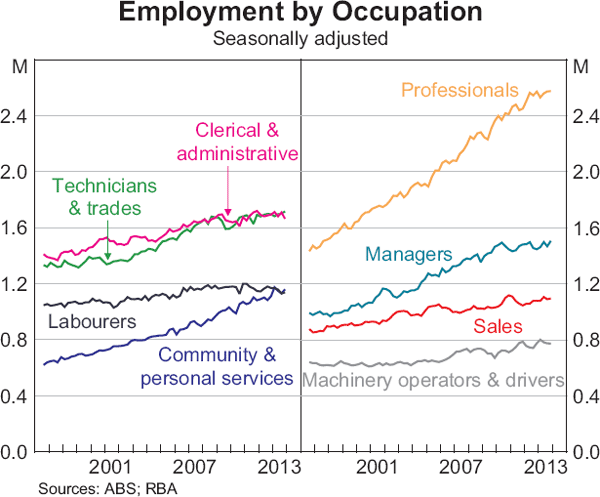
Faced with a high level of job turnover, community organisations report that the ongoing structural change within the Australian economy – combined with the recent below-trend growth of activity – has reduced the demand for relatively low-skilled jobs. Since 2008, there has been little growth in employment in occupations where economically disadvantaged persons are typically employed – such as labourers, technicians & trades workers and clerical & administrative roles – although there has been a rise in community services employment (Graph 7). Furthermore, community organisations report a decline in the number of apprenticeships and trainee programs, making it more difficult for younger disadvantaged persons to acquire skills that could improve their employment prospects.
According to the HILDA Survey, one-third of the disadvantaged who were unemployed in 2011–12 were long-term unemployed. It is also likely that others who had been unemployed for a long time had become discouraged and were no longer actively seeking employment. Research suggests that long-term unemployment leads to a depreciation of skills (Sen 2000), reduces social networks (Horn, Scutella and Wilkins 2011), and has adverse consequences in terms of health outcomes and life satisfaction (McLachlan, Gilfillan and Gordon 2013), all of which impede the task of finding employment.
In addition, the deterioration in labour market conditions since the global financial crisis, particularly for lower-skilled occupations, has resulted in a greater proportion of the resources available for employment services being absorbed by short-term unemployed clients, leaving fewer resources to assist those requiring more intensive services. Many community organisations provide employment programs in partnership with Job Services Australia. Within these programs, a client is categorised into one of four ‘streams’ based on their skill level, work experience and the level of support they require.[6] In a weaker labour market, it is relatively easier for those in the higher streams (streams one or two) to find employment compared with those in streams three or four who generally require services in addition to employment support. Community organisations note that the lower category streams (three or four) have a higher proportion of long-term unemployed, young people and Indigenous Australians.
Structural barriers to employment
In addition to fewer employment opportunities, community organisations identify a range of entrenched structural barriers to labour force participation that are prevalent among the economically disadvantaged. These include:
- Housing instability. In 2011–12, spending on housing and utilities accounted for close to 40 per cent of total disposable income for the economically disadvantaged, almost double the share of total disposable income spent on housing and utilities by the rest of the HILDA sample. Low levels of disposable income reduce the ability to pay housing costs and to build a financial safety net against adverse outcomes. As a consequence, those economically disadvantaged who need to find alternative housing find it more difficult to sustain employment while searching for affordable housing, especially given the limited supply of social housing.
- Large geographical distance between affordable housing and job markets. Many low-skilled roles (such as carer and hospitality roles) are located close to city centres, some distance from affordable housing locations. Disadvantaged people reliant on public transport are therefore often limited by the type and location of jobs available to them, especially in rural and remote communities.
- Limited access to technology. Limited access to technology can make it harder to search for employment. The HILDA Survey shows that this is particularly the case for the economically disadvantaged; around half of those not in the labour force did not have internet access at home.
- Intergenerational unemployment. According to community organisations, children who grow up in jobless households typically understand less about how to participate in the labour market and how to find and apply for jobs. The HILDA data suggest that, if a parent was unemployed for a period of six months or more when their child was growing up, the child's likelihood of being employed in adulthood is reduced (Hèrault and Kalb 2009).
- Disability. Community organisations note that, historically, employers have been reluctant to hire workers with a disability, perceiving that they could pose a risk to other workers or that the business would incur additional costs. Even so, a growing number of employers are now including people with a disability in their recruitment and graduate programs. Another barrier arises because some people with a disability cannot afford the medical devices they require to be able to enter the workforce. This can result in a situation where they need a job to pay for the required equipment, but cannot obtain a job without it.
- Health issues. Many economically disadvantaged persons find it more difficult to participate in employment due to mental health issues and/or a range of other long-term health and personal issues. Community groups note that providing support to overcome these issues can be a costly and time-intensive process.
- Marginal financial benefit to working. Given the additional financial costs associated with after-school and dependent adult care if the main caregiver takes up employment, and the high marginal effective rates of taxation on labour income they face as welfare assistance tailors off, several community organisations note that the net financial gain for economically disadvantaged persons finding employment in low-income, casual jobs can be limited. Similar issues are raised in the Productivity Commission's report into disadvantaged persons (McLachlan et al 2013).
Conclusion
The conditions faced by Australians experiencing economic disadvantage improved in the years leading up to the global financial crisis, aided by generally strong economic conditions, though conditions have deteriorated somewhat since then. Nonetheless, taking the period as a whole, there has been an increase in full- and part-time employment for some people in this group, which community organisations and the HILDA data indicate can be an important pathway out of disadvantage. However, low initial skill levels, a lack of experience, declining low-skilled employment opportunities within the economy and a range of other structural barriers pose significant impediments to obtaining and retaining employment for many economically disadvantaged people. Addressing these challenging issues remains a central focus for many of the community organisations that the Bank is in contact with via its liaison program.
Footnotes
The authors are from the Economic Analysis Department. [*]
For a longitudinal study, unit record data are gathered for the same subjects over a period of time. This article uses longitudinal data from the Household, Income and Labour Dynamics in Australia (HILDA) Survey. The HILDA project was initiated and is funded by the Australian Government Department of Social Services (DSS) and is managed by the Melbourne Institute of Economic and Social Research (Melbourne Institute). The findings and views in this article, however, are those of the authors and should not be attributed to either DSS or the Melbourne Institute. [1]
Specifically, a household is defined as economically disadvantaged if the household was in the lowest quintile of income in a given year and in the lowest quintile of wealth in any of the years when the wealth components were surveyed in HILDA (2002, 2006 or 2010). The sample used in this article excludes households headed by a person over 70 years of age as well as all persons over 70 years of age since they are generally retired from the workforce. [2]
These data are presented in ‘equivalised’ form, which adjusts actual household income for its size and age composition, with the first adult receiving a weight of one, subsequent adults and children over 14 years a weight of 0.5 and children under 14 years a weight of 0.3. The lowest equivalised income quintile thresholds in 2011 and 2012 were $27,100 and $27,700, respectively; the lowest wealth quintile thresholds in 2002, 2006 and 2010 were $32,500, $43,000 and $53,200, respectively (2011/12 dollars). As a relative concept, the lowest income quintile threshold can in principle vary with the economic cycle but, in practice, there was little change in this threshold in Australia between 2009 and 2012. [3]
Persons who move into economic disadvantage are not discussed in this article. [4]
Around one-quarter of the 49 per cent who moved out of economic disadvantage were students who completed their studies and moved into employment. [5]
For example, someone categorised into stream one will be assisted in putting together a resume, searching for a job, assessing skills and mentoring, while someone categorised into stream four will be allocated a caseworker and receive more intensive support. [6]
References
Hèrault N and G Kalb (2009), ‘Intergenerational Correlation of Labour Market Outcomes’, Melbourne Institute Working Paper No 14/09, Melbourne Institute of Applied Economic and Social Research, June.
Horn M, R Scutella and R Wilkins (2011), ‘Social Exclusion Monitor Bulletin’, Brotherhood of St Laurence and Melbourne Institute of Applied Economic and Social Research, September.
McLachlan R, G Gilfillan and J Gordon (2013), ‘Deep and Persistent Disadvantage in Australia’, Productivity Commission Staff Working Paper, Canberra.
Sen A (2000), ‘Social Exclusion: Concept, Application and Scrutiny’, Social Development Papers No 1, Asian Development Bank.