Bulletin – December 2015 Global Economy Chinese Capital Flows and Capital Account Liberalisation
- Download the article 255KB
Abstract
Chinese private capital flows are dominated by foreign direct investment and banking-related flows, with portfolio flows remaining relatively small (as a share of GDP). Of these components, banking-related flows account for the majority of the cyclical variation in total flows and seem to be driven by expected changes in the exchange rate. Both the composition of capital flows and the factors that drive their variation are likely to change as the Chinese authorities gradually open the capital account in line with their stated intention. Given the size of China's economy, the implications of a continued opening of its capital account and a significant increase in capital flows are potentially very large. They include a greater influence of global financial conditions on China (and vice versa), a change in the composition of China's net foreign assets, and a change in the nature of the economic and financial risks facing China.
Introduction
The Chinese authorities have been liberalising China's financial system since the 1980s. A significant aspect of these reforms has been a gradual opening of the capital account (alongside an opening of the current account). The Chinese authorities have stated their intention to continue this process alongside a more flexible exchange rate.
Given the size of China's economy, a more open Chinese capital account could have considerable implications for the global financial system. In particular, there is the potential for significant increases in portfolio investment by Chinese residents abroad and by foreign residents in China. While these flows could provide significant diversification benefits to China and the rest of the world, they could also expose economies to various risks associated with more volatile capital flows. The history of economies that have opened their capital accounts indicates the importance of managing and sequencing these reforms carefully.
This article discusses the progression of China's capital account opening to date, focusing on the different types of private capital flows – direct, portfolio and banking-related investment.[1] The outlook for future reforms is then discussed, along with the implications for China's financial system and global capital flows.
China's Capital Account Opening to Date
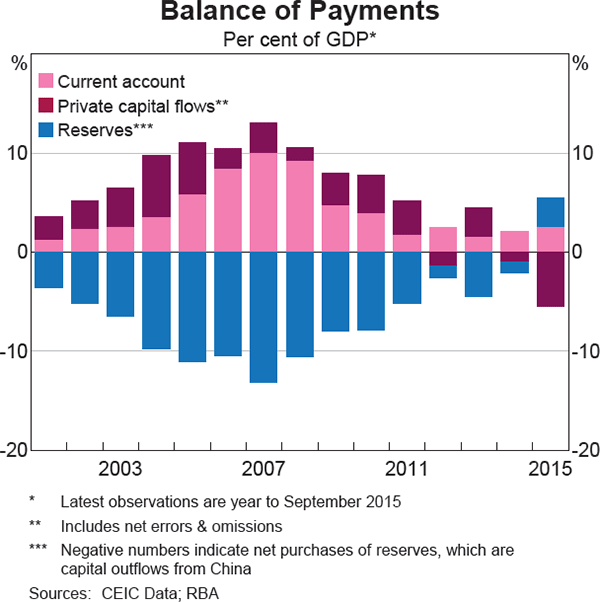
China has recorded persistent current account surpluses over the past two decades, with the size of these particularly large in the years following China's accession to the World Trade Organization (WTO) in 2001 (Graph 1). Such current account surpluses need to be matched by a net outflow of capital (that is, Chinese investment abroad). However, in net terms, private capital has tended to flow in to China rather than out. As a result, the public sector has generally been sending capital offshore, matching the sum of the current account surplus and net private capital inflow. These public sector capital outflows have mainly occurred through the People's Bank of China's (PBC's) accumulation of foreign reserves, which allowed it to maintain its desired level of the renminbi (RMB) against the US dollar. The stock of foreign currency reserves held by the PBC peaked at US$4 trillion in June 2014, compared with less than US$500 billion a decade earlier.
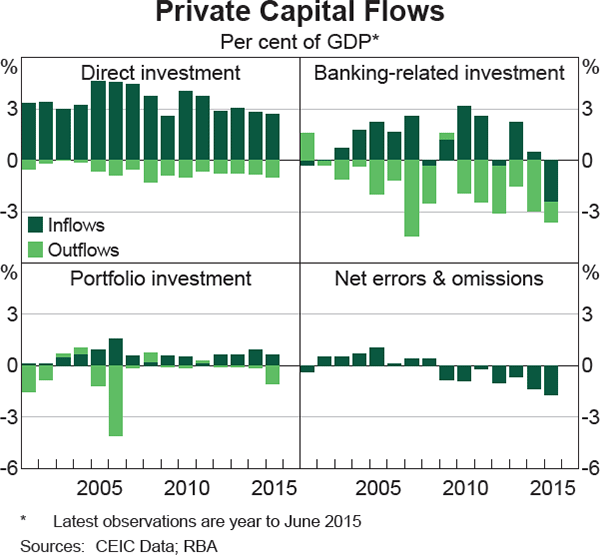
Foreign direct investment (FDI) flows have been the largest contributor to Chinese private capital flows over the past two decades, but banking-related flows have increased over this time and in recent years have accounted for most of the cyclical variation (Graph 2). In contrast, portfolio flows have remained modest.
Direct investment
The persistent inflow of private foreign capital to China over the past 15 years has been in large part due to sizeable FDI inflows, which have averaged 3½ per cent of GDP since 2001.[2] One reason why FDI has been so large has been expectations of high rates of return on investment in China (given its rapid productivity growth). In addition, FDI inflows are less restricted than other forms of capital inflows, particularly in the manufacturing industry. This followed an acceleration of FDI reforms in the early 1990s and China's accession to the WTO in 2001 (Walmsley, Hertel and Ianchovichina 2006). Nevertheless, China's FDI regulations remain somewhat more restrictive than those in other countries (OECD 2014). For example, China still prohibits foreign investment in a number of industries and requires some projects to have majority shareholding by Chinese parties.[3]
Chinese outward direct investment has been considerably smaller than FDI in China, amounting on average to only ½ per cent of GDP over the past 15 years. However, it has been increasing more recently, largely reflecting outward investment by state-owned enterprises (Wang, Qi and Zhang 2015). Data from China's National Bureau of Statistics (NBS) suggest that around two-thirds of this outward investment has been directed to economies in the Asia region, particularly Hong Kong, Singapore and Indonesia, although Australia and the United States have also been large recipients (NBS 2014). By industry, Chinese direct investment tends to be in resources, finance and services such as wholesale & retail trade. For example, 65 per cent of China's outwards direct investment in Australia is directed to the resources sector (ABS 2015).
Banking-related flows
Banking-related flows – mostly loans, currency & deposits and trade credit & advances – have become an increasingly important component of the capital account over recent years, reflecting both an expansion in the absolute size of such flows (in and out) and their greater volatility compared with other forms of capital flows. Indeed, banking-related flows have been the primary channel through which around US$660 billion of private capital has flowed out of China (in net terms) since early 2014.[4] The increasing importance of such flows in to and out of China has been in contrast to global trends since the global financial crisis (see James, McLoughlin and Rankin 2014), and partly reflects an easing of restrictions on Chinese enterprises' use of foreign currency deposits since 2007. Prior to this, firms were required to sell the vast majority of foreign currency receipts from trade to their banks.
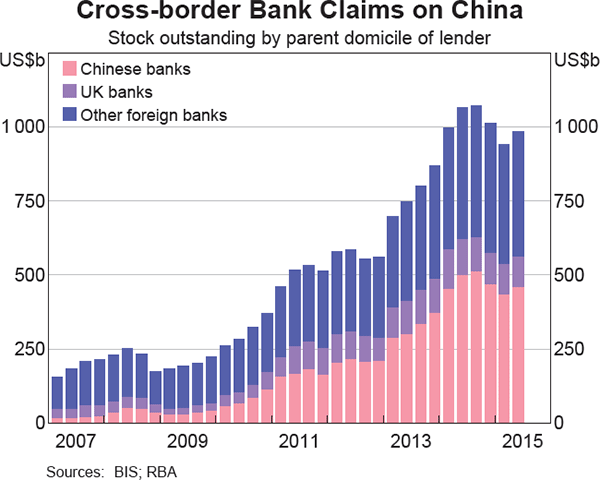
Loans have been the largest component of banking-related capital flows over recent years (Graph 3). Banks located in China have increasingly lent money to foreign borrowers, including to Australian entities, though lending by banks located outside of mainland China to borrowers in mainland China has tended to be much larger. Data from the Bank for International Settlements (BIS) suggest that around half of claims on China have come from banks that are located in Hong Kong. However, data based on the ultimate nationality of banks show that almost all of this is attributable to foreign-owned banks operating in Hong Kong. In particular, foreign subsidiaries of mainland China-owned banks account for a large share of the cross-border lending to China (Graph 4). Indeed, most of the cross-border lending by such banks' Hong Kong subsidiaries is to mainland China, mainly to banks (often their parent entity), and is typically denominated in currencies other than US or Hong Kong dollars (most likely RMB). It is likely that much of this activity reflects lending of RMB deposits that have accumulated offshore back to mainland China, where returns have typically been higher.[5]
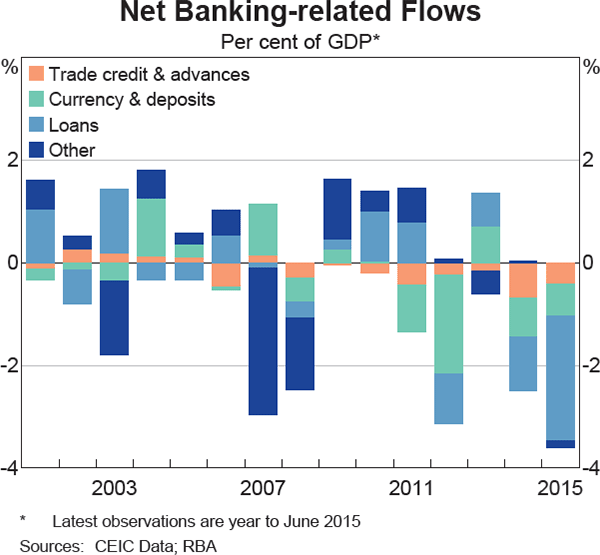
Currency & deposits have also been a large component of banking-related flows. The primary way in which currency & deposits flow out of China appears to be when Chinese entities acquire foreign currency deposits offshore. This is most easily done by Chinese firms that export retaining their revenue in foreign currency rather than converting this revenue into RMB. Since 2011, the authorities have also allowed Chinese firms to settle their trade using RMB, which has led to growth in offshore RMB deposits, which are counted as a capital inflow in the balance of payments.[6] Other transfers of currency across borders remain restricted, most notably as a result of a US$50,000 limit on the amount that Chinese residents can convert into foreign currency each year (without an underlying purpose such as trade).
A third component of banking-related flows is trade credit & advances, such as when foreign firms extend trade credit to Chinese firms (or vice versa). Trade advances can also be recorded in the balance of payments (without banking sector involvement) when a firm pays for goods and services either before or after the invoice date, which is typically when trade is recorded in the current account. For example, if a Chinese firm pays for its imports before the imports are recorded, the associated flow of money is counted as a private capital outflow (that is, the firm has a claim on its supplier).
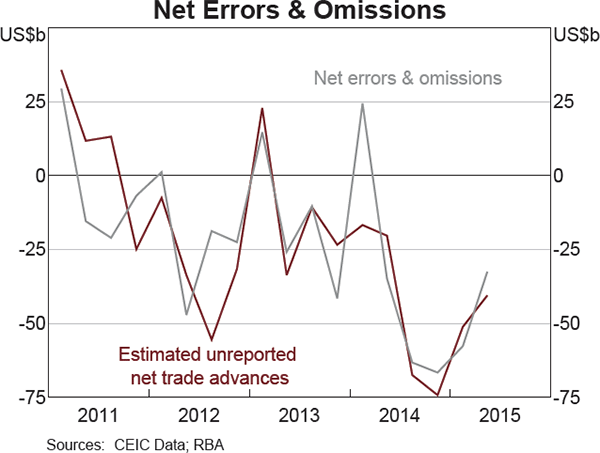
While trade credit & advances have been an important component of China's banking-related flows, there is evidence to suggest that a majority of advances are recorded in net errors & omissions (the difference between the capital and current accounts in the balance of payments). Indeed, evidence suggests that unrecorded trade credit & advances are the main driver of net errors & omissions, not – as is often assumed – illicit capital flows arising from (among other things) ‘fake trade’ and the underground movement of capital out of mainland China.[7] Evidence that unrecorded trade credit & advances are driving net errors & omissions can be gained by comparing two sources of trade data from the State Administration of Foreign Exchange (SAFE), one of which records merchandise trade as it is invoiced (the balance of payments convention) and another that records trade as it is settled. The difference between these two series – which should correspond to net trade advances – is much larger than the trade credit & advances component in the balance of payments. In turn, the excess of this estimate of trade credit & advances over the balance of payments equivalent closely matches China's net errors & omissions (Graph 5).
Portfolio flows
To date, portfolio flows have been a much smaller component of China's capital account than direct investment and banking-related flows, reflecting various controls on both debt and equity flows. In particular, portfolio investors moving money both in to and out of China must generally use various schemes that are all subject to quotas.[8]
The oldest of these schemes began in 2003 and enables authorised foreign institutions to invest in China's onshore financial markets subject to an allocated quota (known as the Qualified Foreign Institutional Investor (QFII) program). This program was broadened in 2011 when authorities launched a related scheme that allows authorised foreign institutions to invest in mainland China using RMB obtained in the offshore market. Quotas for this broadened program (known as the RMB Qualified Foreign Institutional Investor (RQFII) program) are set as country-specific limits and the Chinese authorities have authorised a total of around CNY1.1 trillion (US$175 billion) to be assigned to numerous countries (including US$8 billion for Australia), although the take-up in jurisdictions outside of Hong Kong has been relatively low so far (as discussed below).[9]
The outward portfolio investment counterpart to these inward investment programs is the Qualified Domestic Institutional Investor (QDII) program, which began in late 2004. The program enables authorised onshore asset managers to offer foreign equities and fixed income products to mainland investors using foreign currency, although heavy restrictions on the composition of investments remain in place.[10]
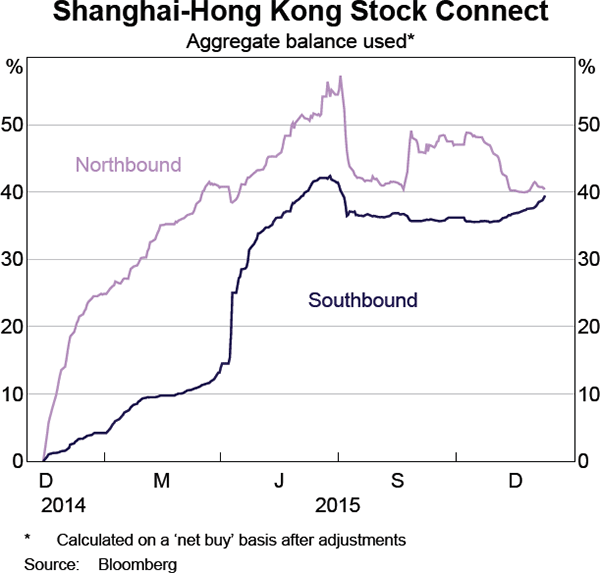
More recently, Chinese authorities have introduced two-way portfolio investment channels. One of these is the Shanghai-Hong Kong Stock Connect, which was launched in November 2014 and enables certain Chinese residents to invest in approved stocks listed on the Hong Kong Stock Exchange (‘southbound’ trading) and foreign investors to trade in approved equities listed on the Shanghai Stock Exchange (‘northbound’ trading). The scheme is subject to quotas on both total and daily usage, but these are granted on an aggregate basis such that individual investors do not need approval from the authorities to participate. In July 2015, the authorities also announced the Mutual Recognition of Funds (MRF) agreement between mainland China and Hong Kong, which allows investment funds domiciled in Hong Kong to be sold to retail investors in mainland China (once registered in the mainland) and vice versa. The MRF is the first program enabling offshore funds to be directly sold to Chinese investors.[11]
Drivers of Chinese capital flows
Given that direct investment flows are relatively liberalised, such flows appear to be driven by similar factors to those that drive these flows worldwide; namely, investors' assessments of the returns on investment in various economies. In contrast, the highly restricted nature of portfolio flows means that such flows are more likely driven by changes in quotas and the regulations of various programs (see below).
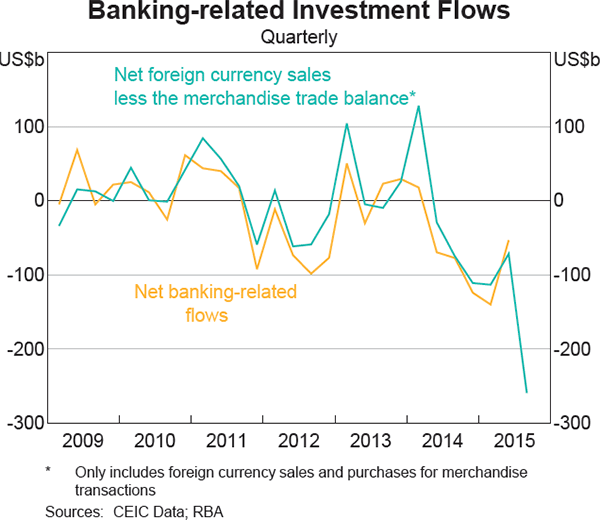
For banking-related flows, the primary driver seems to be firms' management of their foreign currency receipts and payments. This can be seen from the difference between firms' net sales of foreign currency to banks and the merchandise trade balance; this should measure the extent to which firms choose to convert their net foreign currency revenue into RMB and accounts for a very large proportion of net banking flows (Graph 6). For example, the recent net private capital outflow can be linked to firms' choice to hold on to their foreign currency receipts and repay foreign currency loans. Trade credit & advances are another method available to Chinese firms wanting to manage their export receipts and import payments (although these seem to mostly be recorded in the category of net errors & omissions).
For banking-related flows and net errors & omissions, the underlying driver of decisions by firms seems to be expectations for a change in the value of the RMB exchange rate against the US dollar. This can be seen from the correlation between both banking-related flows and net errors & omissions with the offshore RMB premium, which measures the difference in the value of RMB against the US dollar in the offshore market (mostly Hong Kong) and the onshore market, and tends to be positive when firms expect the RMB to appreciate (Graph 7). This relationship could arise because firms want to hedge against adverse movements in the exchange rate (by matching a US dollar revenue stream or cost with a US dollar loan or deposit, respectively, or by paying for goods in advance at the prevailing exchange rate).
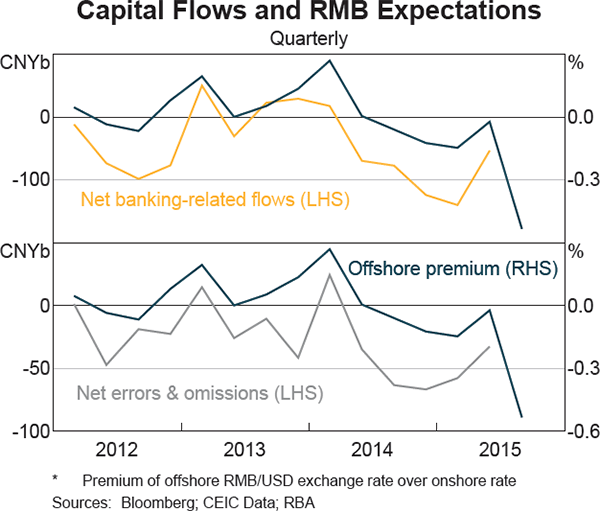
The correlation of the offshore premium with banking-related flows and net errors & omissions suggests that exporters and importers are actively managing their balance sheets amid expected fluctuations in the RMB's exchange rate. For example, when the RMB has been expected to depreciate against the US dollar (that is, the offshore RMB premium has been negative), firms have tended to hold onto their foreign currency receipts rather than sell them to their banks, repay foreign currency loans and prepay for imports. This process was particularly pronounced following the August announcement of a change to the way China's central bank sets the fixing rate for the RMB against the US dollar, which led to an initial depreciation of the RMB and heightened expectations of further depreciation.[12]
Further Capital Account Liberalisation
Continued capital account liberalisation in China is likely to involve reforms within all the main components of the capital account. Chinese authorities have indicated that they will continue to gradually ease direct investment restrictions over time and recent reforms in China's free trade zones (FTZs) provide a preview of how such liberalisation may occur.[13] In particular, direct investment in these zones is permitted unless the investment is on a ‘negative list’ and the Chinese authorities have indicated they will progressively roll out this model to other regions as a trial, before implementing it nationwide in 2018 (State Council 2015). The Shanghai FTZ also provides an indication of how the restrictions on banking-related flows may be relaxed, with the authorities announcing their intention to increase the US$50,000 limit on the amount that Chinese residents in the Zone can convert into foreign currency.
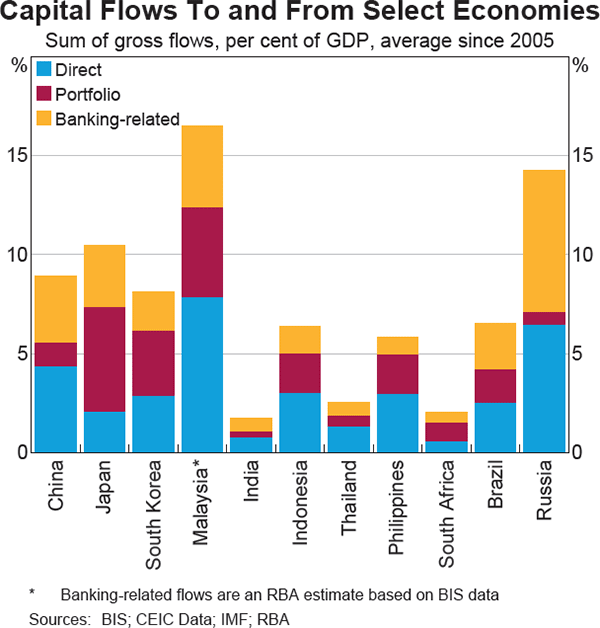
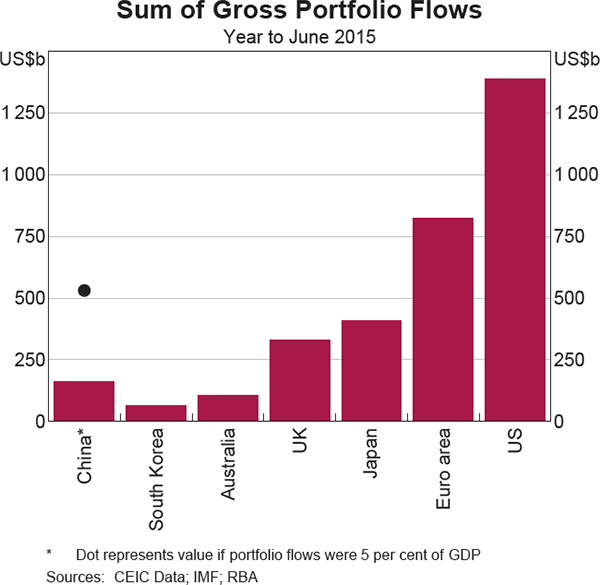
There seems to be greater scope for future reforms to focus on further opening up portfolio investment, which is the most restricted component of the capital account. These restrictions result in China's gross portfolio flows being much smaller (relative to GDP) than those of many other developing economies (and lower still than advanced economies), while direct investment and banking-related flows have been of a similar magnitude (Graph 8). In total, the various portfolio investment schemes allow for only around US$345 billion (3.2 per cent of GDP) and US$175 billion (1.6 per cent of GDP) to be invested in to and out of China, respectively.[14]
In practice, foreign and domestic residents do not fully use the quotas of the different schemes. For example, only around half of the overall quota under the RQFII program has been allocated to date, and usage of both the northbound and southbound quotas under the Stock Connect program has typically been lower (Graph 9). As a result, foreigners held only around US$200 billion (1.9 per cent of GDP) of domestic portfolio RMB-denominated assets at September 2015. This limited usage is likely to reflect a number of structural factors, such as unfamiliarity with the Chinese legal system, the application process for some schemes and repatriation restrictions.[15] Indeed such factors were cited by MSCI in its decision to not include China in its emerging markets index earlier this year.[16] In addition, the perception that China's financial markets are still developing may affect quota usage. Cyclical factors are also likely to have contributed to the relatively low quota usage of late, given the recent slowing in Chinese economic growth and volatility in the equity market.
It appears that the Chinese authorities are likely to continue using different schemes to gradually open up portfolio flows, rather than immediately offering direct access to its financial markets. For example, the authorities have been developing an extension to the QDII program (known as QDII2) that will reportedly allow individual investors with at least CNY1 million in financial assets to directly purchase a broad range of overseas financial assets (up to 50 per cent of their net assets' worth). The government recently announced that it is considering launching a QDII2 pilot in the Shanghai FTZ. Other potential reforms include giving firms in the Shanghai FTZ greater access to domestic financial markets and a supplementary Stock Connect scheme between Shenzhen and Hong Kong.
Implications of further liberalisation
As the Chinese authorities continue to gradually open the capital account, there could be a considerable increase in global portfolio flows. The size of these flows is difficult to predict but as one indication, China's gross portfolio flows would have been around US$530 billion in the year to June 2015 if they were equivalent to 5 per cent of GDP, which would be consistent with average flows in South Korea and Malaysia. This would have accounted for around 20 per cent of international portfolio flows in the year to June 2015 (rather than the 7 per cent that actually occurred), which would have made it the third largest economy in terms of portfolio capital flows, behind the United States and the euro area (Graph 10). It is unclear whether the expected increase in gross flows will be driven more by capital inflows or outflows, although some research has predicted that there will be a greater increase in flows out of China than in, given the greater incentive for Chinese investors to diversify their assets (Bayoumi and Ohnsorge 2013; He et al 2012; Hooley 2013). The destination of these possible portfolio outflows are also uncertain, although some research indicates that portfolio equity investment tends to flow towards major trading partners (Lane and Milesi-Ferretti 2008).
There are a number of implications that would arise from such a sizeable expansion of Chinese portfolio flows.
One implication is that a more open capital account will probably require China to allow its exchange rate to be more flexible to permit monetary policy independence. Indeed, the Chinese authorities have indicated that they aim to make the RMB more flexible over time and the recent changes to the fixing rate between the RMB and the US dollar are consistent with this aim. Even with a floating exchange rate, it may be that an open capital account results in domestic monetary conditions becoming more sensitive to global monetary conditions (Rey 2013). If true, this would imply that Chinese interest rates and financial markets will become more correlated with those of other economies as the capital account is opened.
Given that China is a large economy itself, the converse may also become true: other economies' financial conditions would become more sensitive to China's monetary policy and financial shocks. This is most likely to occur as Chinese banks expand or contract their foreign lending in response to domestic shocks, but could also happen via fluctuations in portfolio flows from China as expected relative returns on securities change. South Korea and Malaysia are China's largest trade partners in Asia (other than Japan, Hong Kong and Taiwan) and portfolio inflows to these economies would approximately double if China's gross portfolio flows rose to 5 per cent of GDP and flows were directed in line with trade shares.
A second implication is that the composition of China's net foreign assets may change. Currently, official reserve assets comprise around three-fifths of China's foreign assets, reflecting many years of foreign reserve accumulation in order to maintain the authorities' desired exchange rate. A more flexible exchange rate implies that the importance of foreign exchange reserves in China's total foreign assets is likely to decline over time as the extent of intervention diminishes and private capital flows become more important in matching China's net current account position. That is, there would be a substantial shift in the share of ownership of China's foreign assets from the public sector to the private sector. As a result, there is also likely to be a significant shift in the nature of capital flows. This could have a large effect on global financial markets, depending on the difference in portfolio allocation between the public and private sectors.
A more open capital account could also increase financial stability risks in China, which would have global implications given the size of China's economy. Previous academic research on capital account liberalisation suggests that economies should consider liberalising domestic financial markets and develop risk management frameworks before opening up to capital flows (see Ballantyne et al (2014) and Eichengreen, Walsh and Weir (2014) for further discussion). This helps to ensure that domestic interest rates more accurately reflect the relative risk of borrowers, allowing domestic and foreign institutions to properly invest and intermediate additional flows. A number of economies that opened their capital account before risk management practices were appropriately developed subsequently experienced adverse outcomes – including Australia in the 1980s and many Asian economies in the 1990s. In both cases, the opening of the capital account was followed by banking crises that were precipitated in large part by the newly opened banking sectors of these economies misallocating capital inflows (with unhedged borrowing in foreign currency also a feature). It was only after the risks associated with these practices were realised that financial institutions and regulators developed more appropriate risk-management tools.
These challenges suggest there is merit to the gradual approach being undertaken by the Chinese authorities, which may make it more likely that China realises the benefits of a more open capital account without the associated costs. In addition to those discussed above, these benefits include greater financial integration, a more efficient use of capital and increased diversification of its assets. A more open Chinese capital account also raises opportunities for other economies, such as greater trade in financial services and access to one of the largest markets in the world.
Conclusion
The composition of Chinese capital flows is different to that in many other economies, mostly reflecting restrictions on portfolio flows. The Chinese authorities intend to continue gradually opening up China's capital account. This process is likely to encompass all of its components, although the greatest scope for liberalisation appears to be for portfolio flows. While this liberalisation could take some time, a cautious approach may be warranted given the experience of other economies that have liberalised their capital accounts. However, as the process of liberalisation occurs, there are likely to be sizeable changes in capital flows and stocks, particularly between the public and private sectors, which would have significant effects on global markets.
Footnotes
The authors are from International Department. [*]
This article refers to ‘other’ investment flows as defined in the balance of payments as banking-related flows. [1]
Intra-company loans are recorded as direct investment in the balance of payments. Such inflows are relatively large for China and may be more akin to portfolio investment than FDI (Avdjiev, Chui and Shin 2014). [2]
For more details see the ‘restricted’ and ‘prohibited’ industries in NDRC (2015). [3]
See RBA (2015) for further details. [4]
UK-owned banks are relatively important among ultimately foreign-owned banks that lend to China. This likely reflects the operations of banks that have a presence in both Hong Kong and mainland China and may also relate to returning offshore RMB deposits to the mainland. [5]
For more details on the offshore RMB market, see Hatzvi, Nixon and Wright (2014). [6]
It has been widely reported that some Chinese firms have misreported their trade receipts over recent years to circumvent capital controls (see Day (2015) for more information). For example, a Chinese firm could overstate the value of its exports to invest offshore funds in higher-yielding RMB assets (for example, to fund portfolio inflows). Such transactions are therefore misreported capital account inflows and thus do not affect the difference between the net positions of the current account and capital account. In principle, this means they would not be recorded in net errors & omissions (unless there is an unrecorded difference between settlement and invoicing). [7]
See Hatzvi et al (2014) for more details on many of the schemes discussed below. [8]
The key advantage of the RQFII scheme over the QFII scheme is the greater flexibility it gives over investment decisions and repatriation. [9]
The investment scope varies across approved QDII entities. [10]
There are a number of criteria that funds must meet to be able to participate (Securities and Futures Commission 2015). [11]
See RBA (2015) for further details. [12]
FTZs currently exist in Shanghai, Tianjin, Guangdong and Fujian. [13]
Central banks, sovereign wealth funds and supranational institutions have recently been given more open access to China's debt markets. [14]
Applications for the RQFII and QFII programs can take up to six months. The MRF reportedly takes around 20 days while there is no approval required to participate in the Stock Connect. The MRF is only available to Hong Kong-domiciled funds and the (daily and aggregate) quotas on Stock Connect could be problematic for funds that rebalance their portfolios. [15]
See MSCI (2015) for more information. [16]
References
ABS (Australian Bureau of Statistics) (2015), ‘Balance of Payments and International Investment Position, Australia’, ABS Cat No 5302.0, June.
Avdjiev S, M Chui and H Shin (2014), ‘Non-Financial Corporations from Emerging Market Economies and Capital Flows’, BIS Quarterly Review, December, pp 67–77.
Ballantyne A, J Hambur, I Roberts and M Wright (2014), ‘Financial Reform in Australia and China’, RBA Research Discussion Paper No 2014-10.
Bayoumi T and F Ohnsorge (2013), ‘Do Inflows or Outflows Dominate? Global Implications of Capital Account Liberalization in China’, IMF Working Paper No WP/13/189.
Day I (2015), ‘Assessing China's Merchandise Trade Data Using Mirror Statistics’, RBA Bulletin, December, pp 19–27.
Eichengreen B, K Walsh and G Weir (2014), ‘Internationalisation of the Renminbi: Pathways, Implications and Opportunities’, Centre for International Finance and Regulation Research Report, March.
Hatzvi E, W Nixon and M Wright (2014), ‘The Offshore Renminbi Market and Australia’, RBA Bulletin, December, pp 53–62.
He D, L Cheung, W Zhang and T Wu (2012), ‘How Would Capital Account Liberalisation Affect China's Capital Flows and the Renminbi Real Exchange Rates?’, Hong Kong Institute of Monetary Research Working Paper No 09/2012.
Hooley J (2013), ‘Bringing down the Great Wall? Global Implications of Capital Account Liberalisation in China’, Bank of England Quarterly Bulletin, December, pp 304–316.
James E, K McLoughlin and E Rankin (2014), ‘Cross-Border Capital Flows since the Global Financial Crisis’, RBA Bulletin, June, pp 65–72.
Lane P and G Milesi-Ferretti (2008), ‘International Investment Patterns’, The Review of Economics and Statistics, 90(3), pp 538–549.
MSCI (2015), ‘Results of MSCI 2015 Market Classification Review’, Media Release, 9 June.
NBS (National Bureau of Statistics of the People's Republic of China) (2014), China Statistical Yearbook 2014, China Statistics Press, Beijing, 28 October. Available at http://www.stats.gov.cn/tjsj/ndsj/2014/indexeh.htm
NDRC (National Development and Reform Commission) and Ministry of Commerce (2015), ‘Catalogue for the Guidance of Foreign Investment Industries’, Cat No 22, March.
OECD (Organisation for Economic Co-operation and Development) (2014), FDI Regulatory Restrictiveness Index, 30 October. Available at http://www.oecd.org/investment/fdiindex.htm
RBA (Reserve Bank of Australia) (2015), ‘International and Foreign Exchange Markets’, Statement on Monetary Policy, November, pp 19–31.
Rey H (2013), ‘Dilemma not Trilemma: The Global Financial Cycle and Monetary Policy Independence’, in Global Dimensions of Unconventional Monetary Policy, a Symposium sponsored by the Federal Reserve Bank of Kansas City, Jackson Hole, Wyoming.
Securities and Futures Commission (2015), ‘Circular on Mutual Recognition of Funds (MRF) between the Mainland and Hong Kong’, Media Release, 22 May.
State Council (The State Council of The People's Republic of China) (2015), ‘State Council to Draft “Negative Lists” for Market Access’, Media Release, 19 October.
Walmsley T, T Hertel and E Ianchovichina (2006), ‘Assessing the Impact of China's WTO Accession on Investment’, Pacific Economic Review, 11(3), pp 315–339.
Wang M, Z Qi and J Zhang (2015), ‘China Becomes a Capital Exporter’, L Song, R Garnaut, C Fang and L Johnston (eds), China's Domestic Transformation in a Global Context, ANU Press, Canberra, pp 315–338.