Bulletin – September 2016 Australian Economy The Household Cash Flow Channel of Monetary Policy
- Download 398KB
Abstract
Changes in interest rates can affect household spending by directly affecting households' interest income and payments and, in turn, the amount of cash that households have available to spend. This is typically referred to as the ‘household cash flow channel of monetary policy’. Household-level data provide evidence that the cash flow channel operates both for households that are net borrowers and for those that are net lenders, though the effect on borrowers is estimated to be much stronger than the effect on lenders. Overall, changes in household cash flow appear to be an important channel through which lower interest rates can stimulate greater household spending.
Introduction
Changes in monetary policy directly affect the household sector through several channels. Lower interest rates can encourage households to save less and bring forward consumption from the future to the present (the intertemporal substitution channel). Lower interest rates can also lift asset prices, such as housing prices, and the resulting increase in household wealth may encourage households to spend more (the wealth channel). Additionally, lower interest rates reduce the required repayments of borrowing households with variable-rate debt, resulting in higher cash flows and potentially more spending, particularly for households that are constrained by the amount of cash they have available. At the same time, lower interest rates can reduce the interest earnings of lending households, which may, in turn, lead to lower cash flows and less spending for these households. These last two channels together are typically referred to as ‘the household cash flow channel’.
The household cash flow channel has been described in journal articles, speeches and public commentary. But, to date, there has been little research into it, either in Australia or overseas.[1] In this article, we outline some recent research into the cash flow channel in Australia.[2]
The analysis in this article focuses on a fairly narrow definition of the cash flow channel. It examines the direct effects of interest rates on interest income and expenses, but abstracts from monetary policy changes that have an indirect cash flow effect by influencing other sources of income, such as labour or business income.
It is important at the outset to define some concepts that will be used throughout the article. ‘Interest-earning liquid assets’ are defined as assets that have income streams that are directly tied to interest rates and that are easily convertible to cash. ‘Interest-bearing debt’ is debt that has a payment stream that is directly linked to interest rates and that matures relatively quickly. For households, interest-earning liquid assets comprise mainly of savings deposits, while interest-bearing debt mainly includes variable-rate mortgage debt. Using this classification, a net ‘borrower’ is a household that holds more interest-bearing debt than interest-earning liquid assets. Similarly, a net ‘lender’ is a household that holds more interest-earning liquid assets than interest-bearing debt. The income flows that are associated with both interest-earning liquid assets and interest-bearing debt will be referred to as ‘interest-sensitive cash flows’.
Broadly speaking, the household cash flow channel consists of three stages. First, changes in the cash rate are transmitted to changes in the lending and deposit rates faced by households. Second, changes in household lending and deposit rates flow through to changes in household disposable income by changing the required mortgage payments of borrowing households and the net interest earnings of lending households. Third, changes in cash flow potentially affect household spending, particularly for households that are constrained by the amount of available cash (‘liquidity constrained’). This article focuses on the latter two stages; other recent Bank publications discuss how changes in the cash rate are transmitted to the interest rates faced by households (for example, Wilkins, Gardner and Chapman (2016)).
From Lending and Deposit Rates to Household Cash Flow
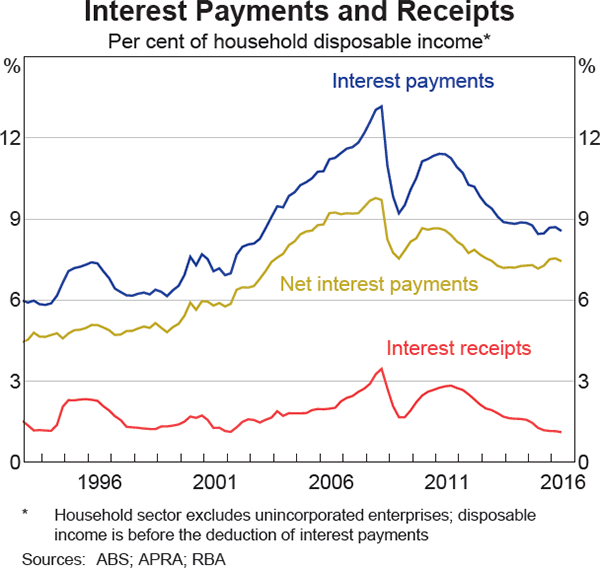
Household disposable income, or cash flow, comprises wages and salaries, property income (including interest paid on deposits) and transfers, less taxes and interest payments on debt. The household sector in Australia holds more interest-bearing debt than interest earning assets (Graph 1). Indeed, households have increased their debt holdings at a rapid pace since the early 1990s, mainly due to an increase in mortgage debt. For the household sector as a whole, the level of household debt now exceeds the level of directly held interest-earning deposits by a significant margin. However, since the mid 2000s, slower growth in household debt and increases in interest-earning deposit balances (including balances held in mortgage offset accounts) has led to a decline in net interest-bearing debt.[3] This means that the household sector is a net payer of interest. Household net interest payments increased through the 1990s and early 2000s, mainly reflecting the rise in net household debt, but trended down from 2007 as interest rates and net debt declined (Graph 2).
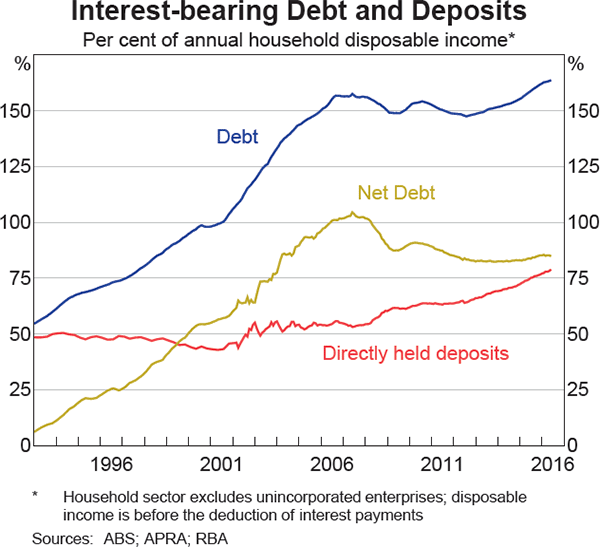
The data shown above do not account for interest-earning assets held in managed superannuation accounts, which have increased substantially since the early 1990s. The majority of these assets cannot be accessed until retirement and, therefore, are likely to be of less importance for the household cash flow channel. Interest-earning deposits in retirement-phase superannuation accounts do provide an accessible cash flow; however, comprehensive data on these accounts are not available. Internal RBA estimates suggest that including these accounts would increase household interest-earning assets and interest income by 10 to 20 per cent but would otherwise not substantially affect the key results in this analysis.
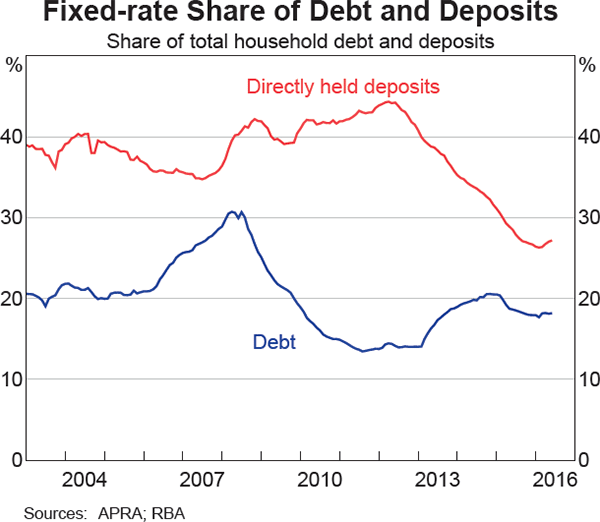
Using the data on households' interest-earning deposits and interest-bearing debt, it is possible to construct an estimate of the direct effect of a cash rate change on aggregate household cash flows. For this estimate, the cash rate change is assumed to be fully reflected in the variable interest rates that households receive and pay on their deposits and debt. Such a change would usually occur within a month. However, the estimates also need to account for the time it takes for interest rate changes to pass through to fixed-rate products. Australian households have a relatively low share of fixed-rate debt compared with most other advanced economies; less than 20 per cent of mortgages are currently at fixed rates, which is around its long-run average (Graph 3).[4] On the asset side of the household balance sheet, around one-quarter of deposits are term deposits. However, more than three-quarters of the outstanding balance of these term deposits are currently estimated to mature within six months, so changes in the cash rate are passed through to interest rates on these products fairly quickly.
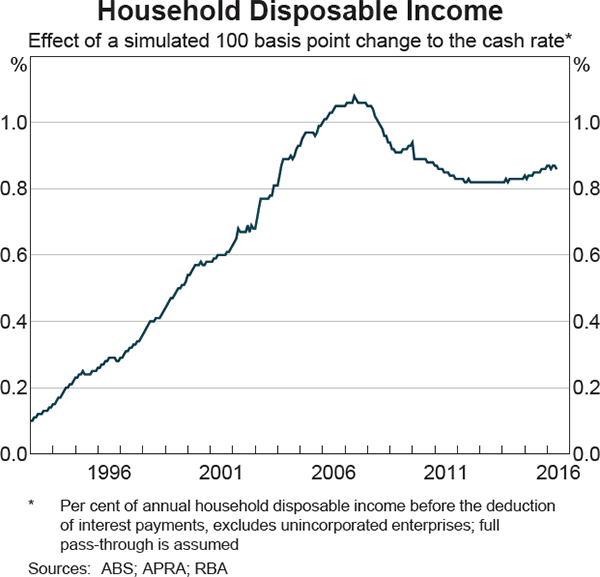
If changes in the cash rate are eventually fully reflected in the interest rates households receive and pay on their deposits and debt, lowering the cash rate reduces households' overall net interest expenses and raises aggregate disposable income by around 0.9 percentage points (Graph 4).[5] Compared with the early 1990s, aggregate household disposable income is estimated to have become more sensitive to cash rate changes owing to the large increase in directly held net interest-bearing debt; however, this sensitivity is estimated to have declined since the mid 2000s, reflecting the overall decline in net interest-bearing debt as a share of household disposible income.
From Household Cash Flow to Spending
As noted, for the household sector as a whole, the level of interest-bearing debt exceeds the level of interest-earning assets, so lowering the cash rate adds to household cash flow through lower net interest expenses. However, estimating the importance of the cash flow channel for overall household consumption requires disaggregate (household-level) analysis, rather than aggregate analysis, because of the relative strength of the ‘borrower’ and ‘lender’ channels. The relative strength of the two channels for household spending depends on several factors including:
- differences in the sizes of the borrower and lender groups
- differences between borrowers and lenders in the average holdings of net liquid assets and debt
- differences between borrowers and lenders in their propensities to consume out of cash flow.
Household-level information on the distribution of expenditure, cash flow and wealth is available in the HILDA Survey. This household-level longitudinal study, with information collected annually since 2001, tracks individuals over time and provides detailed information on various household characteristics.[6] The decomposition of the average household balance sheet into interest-earning liquid assets and interest-bearing debt is shown in Table 1.
As Table 1 highlights, the distributions of interest-earning liquid assets and interest-bearing debt are skewed. In particular, the mean household has more interest-bearing debt than interest-earning liquid assets, while the opposite is true for the median household. On average, most liquid assets are held in the form of bank deposits, while interest-bearing debt is primarily variable-rate mortgage debt.
The HILDA Survey indicates that the population is fairly evenly split between net borrowers and lenders. While there are roughly the same number of borrowers and lenders in the economy, on average, borrowers hold two to three times as much net debt as lenders hold in net liquid assets (Graph 5).
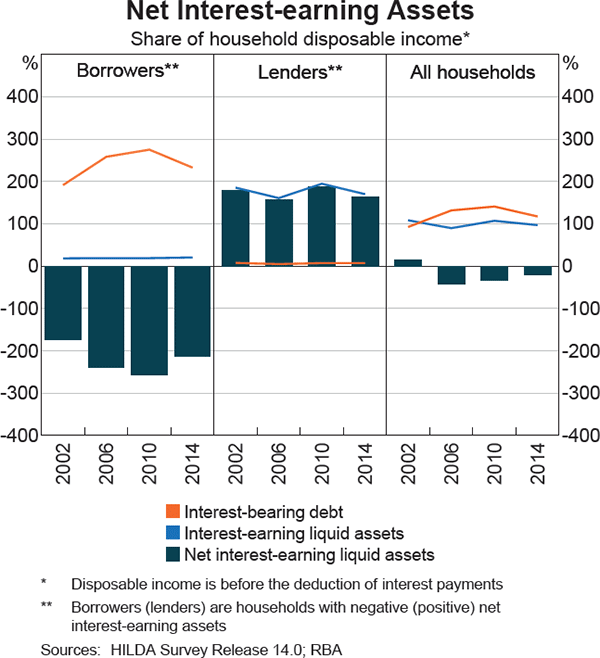
Table 2 summarises the characteristics of net borrowers and lenders. Borrowers and lenders mainly differ because of their positions in the lifecycle: the average borrower is younger, earns more income and is twice as likely to be in the workforce as the average lender. The average borrowing household is also typically larger, less wealthy and more educated than the average lending household.
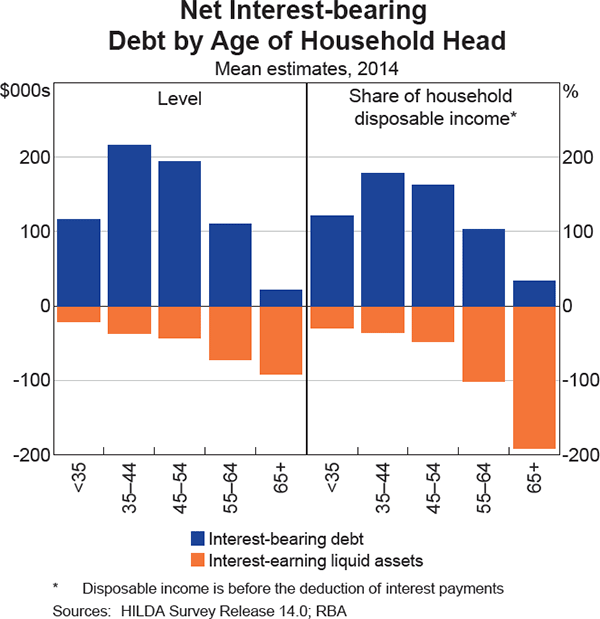
The influence of the life cycle for borrowers and lenders is also shown by the way in which the composition of wealth varies with the age of the household head (or ‘reference person’).[7] Interest-earning liquid assets make up a greater share of net wealth for older households (aged 55 years and above), while middle-aged households hold higher levels of interest-bearing debt (Graph 6).
| Assets Mean $′000 | Median(a) $′000 | Share of mean assets Per cent | |
|---|---|---|---|
| Bank deposits | 51.0 | 11.0 | 5.6 |
| Cash investments (e.g. bonds) | 2.1 | 0.0 | 0.2 |
| Total interest-earning liquid assets | 53.1 | 12.0 | 5.8 |
| Housing assets | 530.0 | 393.8 | 58.0 |
| Superannuation | 185.7 | 65.0 | 20.3 |
| Other assets (e.g. equities, vehicles) | 145.6 | 25.5 | 15.9 |
| Total assets | 914.3 | 579.0 | 100.0 |
| Debt Mean $′000 |
Median $′000 | Share of mean debt Per cent | |
| Variable-rate housing debt | 114.1 | 0.0 | 65.8 |
| Variable-rate personal debt(b) | 8.4 | 0.0 | 4.9 |
| Variable-rate business debt(b) | 6.0 | 0.0 | 3.5 |
| Total interest-bearing debt | 128.6 | 5.0 | 74.1 |
| Fixed-rate housing debt | 28.5 | 0.0 | 16.4 |
| Fixed-rate personal debt(b) | 6.9 | 0.0 | 4.0 |
| Fixed-rate business debt(b) | 3.2 | 0.0 | 1.9 |
| Credit cards | 1.7 | 0.0 | 1.0 |
| Other debt (e.g. student debt) | 4.6 | 0.0 | 2.7 |
| Total debt | 173.5 | 22.0 | 100.0 |
|
(a) Median estimates do not sum to totals Sources: HILDA Survey Release 14.0; RBA |
|||
To estimate how responsive consumption is to cash flow changes for borrowers and lenders a household-level consumption model is used to control for various household-level characteristics.[8]
This model provides an estimate of the marginal propensity to consume (MPC) durable goods (for example, cars, computers and audio-visual equipment) from cash flow for borrowers and lenders. Expenditure on durable goods is typically more discretionary and sensitive to changes in interest rates than expenditure on non-durable goods and services.[9] The HILDA Survey collected information on durable goods expenditure only between 2006 and 2010 so attention is focused on this sample period. While the sample period is relatively short, it does span the global financial crisis period and hence captures some important cyclical fluctuations in interest rates, income and spending.
| Borrowers | Lenders | |
|---|---|---|
| Durables consumption ($′000) | 11.2 | 7.4 |
| Total consumption ($′000) | 45.6 | 26.9 |
| Cash flow ($′000) | 87.8 | 68.3 |
| Interest-earning liquid assets ($′000) | 17.6 | 68.7 |
| Interest-bearing debt ($′000) | 214.7 | 4.7 |
| Net interest-earning liquid assets ($′000) | −197.1 | 64.1 |
| Net total wealth ($′000) | 673.9 | 721.6 |
| Age of household head (years) | 43.0 | 55.7 |
| Household size (persons) | 3.0 | 2.2 |
| Share that are home owners (%) | 75.9 | 57.8 |
| Share that are mortgagors (%) | 66.3 | 4.5 |
| Share that is employed (%) | 81.3 | 45.2 |
| Share that is tertiary educated (%) | 27.4 | 19.2 |
| Observations | 15,066 | 15,806 |
|
(a) All variables in dollar amounts are deflated by the consumer price
index to express them in 2014 dollars; all estimates are based on Sources: HILDA Survey Release 14.0; RBA |
||
The focus of the model is on the components of household cash flow that are directly sensitive to interest rates (required mortgage payments and income earned directly on bank deposits).[10] These cash flows are distinguished from the remainder of total cash flow (‘other cash flow’, which includes wages, business income, pensions, taxes etc).[11]
The regression model relates the level of consumption of household i in year t
(Cit) to interest sensitive cash flow  and other cash flow
 .
The model is estimated separately for lenders (j = L) and
borrowers (j = B) to examine any differences in the MPC
out of cash flow. The model is specified as:
The model includes a set of variables that theory suggests are important determinants of household spending. These ‘control’ variables (CONTROLSIT) include demographic characteristics (such as age of the household head), labour market characteristics (such as whether the household head is employed) and housing characteristics (such as whether the household has recently moved or refinanced its mortgage). Importantly, the models include an estimate of home equity for each owner-occupier household, which should account for the effects of monetary policy on household spending via the (housing) wealth channel.
The model also controls for household-level characteristics that affect household spending but are difficult for econometricians to observe and which, presumably, do not vary with time, such as a household's degree of impatience or its appetite for risk. These characteristics are captured by the household ‘fixed effect’ (θi ). This should capture, to some extent, the effects of monetary policy on household spending via the intertemporal substitution channel.
The results are consistent with the presence of both borrower and lender cash flow channels (Table 3). We present the elasticities of consumption with respect to cash flow estimated by the model and calculate MPCs (that is, the dollar change in spending as a result of a dollar change in cash flow) by multiplying these elasticities by the mean ratio of spending to cash flow for borrowers and lenders. For borrowers, lowering required mortgage payments is associated with more durable goods spending (column 1). The estimated MPCs indicate that lowering required mortgage payments by one dollar is associated with durables spending rising by over 20 cents, on average. For lenders, the MPCs indicate that an extra dollar of interest income is associated with durables spending rising by around 4 cents, on average (column 2).
The estimated MPC is five times larger for borrowers than for lenders, indicating that, for a given dollar change in cash flow, the borrower cash flow channel is a stronger channel of monetary transmission. On top of this, borrowers typically hold more net debt, on average, than lenders hold in net liquid assets so a given change in interest rates leads to a much larger change in cash flow for borrowers than for lenders. Given the shares of borrowers and lenders in the economy, back-of-the-envelope calculations suggest that lowering interest rates by 100 basis points would be associated with the level of aggregate household consumption rising by 0.1 to 0.2 per cent. By way of comparison, this is within the range of estimates produced by a number of macroeconomic models that assess the effect of an exogenous change in the cash rate on household consumption in Australia, including through other channels and second round effects.[12] Overall, our results suggest that the cash flow channel is an important channel of monetary policy transmission to household consumption in Australia.
| Sample period: 2006 to 2010 | All households | Liquidity constrained households | ||
|---|---|---|---|---|
| Key variables | Borrowers | Lenders | Borrowers | Lenders |
| Interest-sensitive cash flow elasticity | −0.40** | 0.02* | −0.50** | 0.03 |
| (−2.53) | (1.79) | (−2.18) | (1.27) | |
| MPC | −0.21 | 0.04 | −0.23 | 0.23 |
| Other cash flow elasticity | 0.40*** | 0.35*** | 0.73*** | 0.40** |
| (3.08) | (5.07) | (3.63) | (2.54) | |
| MPC | 0.04 | 0.04 | 0.07 | 0.03 |
| R2 | 0.52 | 0.64 | 0.53 | 0.60 |
| Within R2 | 0.01 | 0.01 | 0.02 | 0.01 |
| Observations | 5,186 | 12,165 | 2,204 | 3,288 |
|
(a) ***, ** and * denote statistical significance at the 1, 5 and 10 per cent levels, respectively; t statistics shown in parentheses; standard errors are clustered by household; estimated coefficients on control variables are omitted Sources: HILDA Survey Release 14.0; RBA |
||||
The model is also estimated on the sub-sample of households that are identified as being liquidity constrained (or ‘hand-to-mouth’), following the framework outlined in Kaplan, Violante and Weidner (2014). In effect, liquidity constrained households are those that have liquid wealth that is low relative to income and therefore tend not to save from their current income. In theory, if there is a cash flow channel, the effect of cash flow on household spending should be strongest for households that are liquidity constrained because their consumption is more likely to be limited by their current income. The results are reported in Table 3.
The estimated MPCs are slightly higher for liquidity constrained households than for other households (columns 3 and 4). This is consistent with the existence of a cash flow channel of monetary policy. Somewhat surprisingly, the estimated MPC for liquidity constrained lenders is about the same as for liquidity constrained borrowers.[13] However, in aggregate, the borrower cash flow channel is still a lot stronger than the lender channel. This is because the average liquidity constrained borrower holds over 20 times more net debt than the average liquidity constrained lender holds in net liquid assets.
Conclusion
This article finds evidence for both the borrower and lender cash flow channels, but the borrower channel is estimated to be the stronger channel of monetary transmission. One reason for this is that while there are roughly similar shares of borrower and lender households in the Australian economy, the average borrower holds two to three times as much net debt as the average lender holds in net liquid assets. Another reason is that the sensitivity of spending to changes in interest-sensitive cash flow is estimated to be larger for borrowers than for lenders based on statistical analysis using household-level data.
Overall, the estimates suggest that the cash flow channel is an important channel of monetary transmission; the central estimates indicate that lowering the cash rate by 100 basis points is associated with an increase in aggregate household income of around 0.9 per cent, which would, in turn, increase household expenditure by about 0.1 to 0.2 per cent through the cash flow channel.
Footnotes
The authors are from Economic Group. [*]
The household cash flow channel is discussed in more detail in Hughson, La Cava and Kaplan (forthcoming). [1]
The article provides an Australian perspective on the new and growing literature on the distributional effects of monetary policy (see also, Doepke, Schneider and Selezneva 2015; Auclert 2016; Broer et al 2016). [2]
An offset account is a type of deposit account that is directly linked to a loan, such as a mortgage. Balances in offset accounts effectively reduce the borrower's net debt position and the interest payable on the loan. These accounts effectively ‘earn’ the rate of interest that otherwise would have been paid on the loan (Reserve Bank of Australia 2015). [3]
In the United Kingdom this share is close to half, and in Canada and the United States almost all mortgages have fixed interest rates. [4]
Adjusting this analysis to account for an estimate of deposits held by retirees in superannuation would reduce the net cash flow effect by around 20 per cent (or about 16 basis points) in 2016. [5]
The HILDA Survey provides detailed information on the wealth holdings of Australian households at four-year intervals (in 2002, 2006, 2010 and 2014). [6]
The head of each surveyed household is determined by applying the following criteria, in order, until a unique person is selected. These criteria are: in a registered or defacto marriage (and still living together); a lone parent; the person with the highest income; the eldest person. [7]
The model is similar to those used extensively in the consumption literature. See, for example, Jappelli and Pistaferri (2010). [8]
Hughson et al (forthcoming) find little evidence that expenditure on non-durable goods and services is responsive to interest-sensitive cash flow. [9]
For retirees that receive superannuation income in the form of a pension, some fraction of that income reflects changes in interest rates on their indirect holdings of bank deposits. The key results on the aggregate cash flow channel are little affected if such indirect interest flows are included in the household-level estimates of interest-sensitive cash flow. [10]
Each cash flow is available in the HILDA Survey except required mortgage repayments, which were not collected until 2014. Annual required repayments are estimated using a credit foncier model, which requires information on the loan interest rate, the number of years remaining on the mortgage and the loan size at origination. Information on loan size at origination and the age of the mortgage is available in the survey in the wealth modules. For the loan interest rate, separate estimates for variable and fixed-rate owner-occupier mortgage debt are constructed using the average annual interest rates on each type of debt at the time of origination. A standard 30-year term for each mortgage is assumed. The interest rate is assumed to be equal to the average advertised interest rate on new mortgage loans. [11]
See, for example, Jääskelä and Nimark (2011), Lawson and Rees (2008) and Rees, Smith and Hall (2016). [12]
The concept of a liquidity constrained lending household is a bit unusual in the context of standard consumption theory. It may be the case that households have ‘mental accounts’ for saving and only consume out of certain types of cash flow (such as interest earnings) (Laibson 1997). [13]
References
Auclert A (2016), ‘Monetary Policy and the Redistribution Channel’, Stanford University, unpublished manuscript. Available at <http://web.stanford.edu/~aauclert/mp_redistribution.pdf>.
Broer T, N-JH Hansen, P Krusell and E Oberg (2016), ‘The New Keynesian Transmission Mechanism: A Heterogenous-Agent Perspective’, NBER Working Paper No 22418.
Doepke M, M Schneider and V Selezneva (2015), ‘Distributional Effects of Monetary Policy’, Hutchins Center Working Paper 14.
Hughson H, G La Cava and G Kaplan (forthcoming), ‘The Household Cash Flow Channel of Monetary Policy’, RBA Research Discussion Paper.
Jääskelä J and K Nimark (2011), ‘A Medium-Scale Open Economy Model of Australia’, Economic Record, 87(276), pp 11–36.
Jappelli T and L Pistaferri (2010), ‘The Consumption Response to Income Changes’, Annual Review of Economics, 2, pp 479–506.
Kaplan G, G Violante and J Weidner (2014), ‘The Wealthy Hand-To-Mouth’, Brookings Paper on Economic Activity, pp 77–153.
Laibson D (1997), ‘Golden Eggs and Hyperbolic Discounting’, The Quarterly Journal of Economics, 112(2), pp 443–477.
Lawson J and D Rees (2008), ‘A Sectoral Model of the Australian Economy’, RBA Research Discussion Paper No 2008-01.
Rees D, P Smith and J Hall (2016), ‘A Multi-Sector Model of the Australian Economy’, Economic Record, March, pp 1–35.
Reserve Bank of Australia (2015), ‘Box E: Offset Account Balances and Housing Credit’, Statement on Monetary Policy, August, pp 56–57.
Wilkins K, G Gardner and B Chapman (2016), ‘Developments in Banks’ Funding Costs and Lending Rates', RBA Bulletin, March, pp 21–30.
