Bulletin – December 2017 Financial Stability Foreign Currency Exposure and Hedging in Australia
- Download 1.38MB
Abstract
The latest Survey of Foreign Currency Exposure confirms that Australian entities' financial positions are well protected against a depreciation of the Australian dollar. Consistent with previous surveys, the net foreign currency exposures of the banking sector are fully hedged. This means that the sector's overall foreign currency liability position would not in itself be a source of vulnerability in the event of a sudden depreciation of the Australian dollar.
Introduction
Since the float of the Australian dollar more than 30 years ago, Australia's flexible exchange rate has contributed to macroeconomic stability by cushioning the economy from external shocks and allowing monetary policy to more effectively smooth the business cycle.[1] The benefits of a flexible exchange rate, however, depend on how exposed individual entities are to currency movements. If individual entities hold large foreign currency liabilities or have trade payment obligations denominated in foreign currency, a sharp depreciation of the exchange rate could adversely affect their balance sheets or cash flows. In turn, this could have implications for financial stability and macroeconomic performance. It is therefore important to understand the size and distribution of foreign currency exposures and the extent to which firms protect themselves against the exchange rate risk arising from these exposures.
Given the importance of hedging behaviour for reducing the vulnerability of particular sectors in the Australian economy to exchange rate movements, the Reserve Bank initiated, and has provided funding for, the Australian Bureau of Statistics (ABS) to regularly survey firms' foreign currency exposures and the extent to which they are hedged. The first Survey of Foreign Currency Exposure (SFCE) was conducted in 2001 and subsequent surveys have been conducted every four years.[2]
Broadly speaking, there are two ways in which firms can hedge, both of which are captured by the survey. First, firms can use derivatives – financial instruments that insure against movements in the exchange rate. Alternatively, firms can have ‘natural’ hedges. Natural hedges occur when foreign currency payment obligations or receipts are offset by other payment obligations or receipts. An example of a natural hedge would be a bank using US dollar deposits to purchase US Treasury securities. The 2017 SFCE asked firms about their natural hedges for the first time, allowing for a more complete assessment of hedging behaviour. The 2017 SFCE results also include more information on the hedging of expected trade payments and receipts than the results of the previous survey.
Australia's Net Foreign Currency Position
Australia has historically had a net liability position with the rest of the world, which is the result of domestic investment exceeding domestic saving over a long period.[3] This position has averaged between 55 and 60 per cent of GDP for the past decade or so. However, Australia's foreign liabilities are largely denominated in Australian dollars, but Australia's foreign assets are largely denominated in foreign currency. As a result, Australia has consistently had a net foreign currency asset position with the rest of the world. This means that a significant depreciation of the Australian dollar increases the Australian dollar value of foreign currency assets relative to foreign currency liabilities. This is true even before hedging of exchange rate risk is taken into account.
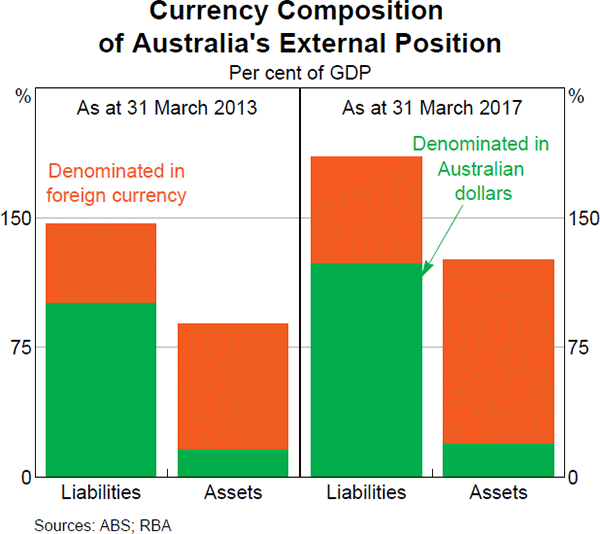
In 2017, Australia's net foreign currency asset position amounted to 45 per cent of GDP (ABS 2017b). Around two-thirds of Australia's foreign liabilities were denominated in Australian dollars, compared with around 15 per cent of Australia's foreign assets (Graph 1). Since 2013, foreign currency assets and liabilities have both increased as a share of GDP. Since the dollar increase in assets has been greater than that in liabilities, there has been an increase in Australia's net foreign currency asset position of around 15 percentage points of GDP.
Foreign currency assets and liabilities have risen by more than Australian dollar-denominated foreign assets and liabilities since 2013. That is, the shares of both assets and liabilities that are in foreign currency have increased. Several factors have contributed to this change. The Australian dollar has depreciated by around one-quarter since 2013, as the terms of trade declined and the mining investment boom unwound. This depreciation would have boosted foreign currency positions when translated into Australian dollars.[4] Foreign currency assets have also grown because of the performance of foreign equity indices and continued purchases of foreign equities by Australian superannuation funds. Finally, there has been an increase in foreign currency borrowing and loans by non-financial corporations. These sector-level trends are discussed in more detail below.
The Effect of Hedging
Hedging continues to increase Australia's net foreign currency position, as has been the case for some time. After accounting for hedging with derivatives, Australia's effective net foreign currency asset position was equivalent to around 50 per cent of GDP as at the end of March 2017 (Graph 2). This larger figure reflects the fact that more than half of foreign currency liabilities are hedged back into Australian dollars, compared with around one-quarter of foreign currency assets.
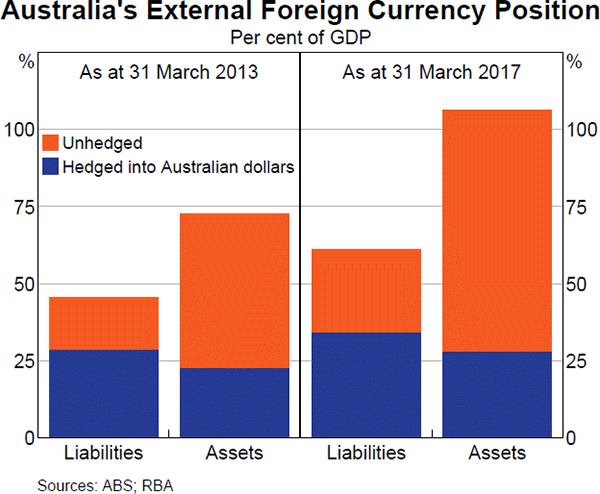
A smaller proportion of both assets and liabilities were hedged in March 2017 than in March 2013. In large part, this reflected significant growth over that period in the foreign currency assets and liabilities of non-financial corporations, which tend to use derivatives for hedging much less than firms in other sectors. Assets of non-financial corporations accounted for 31 per cent of foreign currency assets in 2017, up from 28 per cent in 2013, while the share of foreign currency liabilities accounted for by the sector increased from 26 per cent to 36 per cent. Hedging of liabilities also declined a little within most sectors, possibly reflecting some change in hedging behaviour.
Sectoral Results
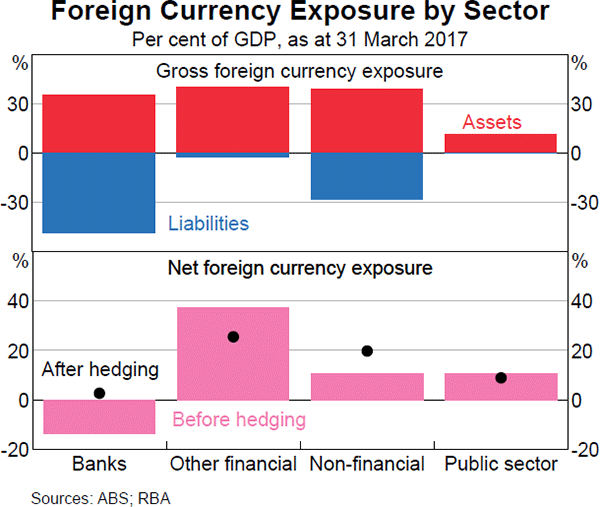
While most sectors of the Australian economy had a net foreign currency asset position at 31 March 2017 (even before accounting for hedging), the banking sector was the main exception. The banks account for almost 40 per cent of Australia's foreign liabilities and a large share of the country's foreign currency liabilities. Because of this, and their important role in the financial system, the hedging of exposures by banks is of particular interest. However, the banking sector continues to be fully hedged in net terms and, after accounting for hedging, had a small net foreign currency asset position. As at March 2017, the non-bank private financial corporations (other financial corporations) had the largest net foreign currency asset position, while non-financial corporations and the public sector also had small net foreign asset positions (Graph 3).
Banks
The 2017 SFCE confirmed that the banking sector had a small net foreign currency asset position once hedging by derivatives had been taken into account. However, as discussed above, the banking sector was the only sector with a net foreign currency liability position before hedging, equivalent to 14 per cent of GDP as at the end of March 2017 (Table 1). This consisted of a foreign currency asset position of 35 per cent of GDP and a foreign currency liability position of 49 per cent of GDP. The large foreign currency liability position for the banking sector reflects the fact that Australian banks continue to use offshore wholesale funding markets, although these markets comprise a smaller share of banks' overall funding than they did before the financial crisis.[5] In 2017, these markets accounted for a little under 20 per cent of total bank funding, almost all of which was denominated in foreign currency. The share of banking sector funding sourced from offshore has been roughly constant since March 2013; however, the value of foreign currency exposures has increased, reflecting the growth in the banking system over this time. As foreign currency liabilities and assets have increased by similar dollar amounts, the sector's net foreign currency exposure has remained roughly constant as a share of GDP.
| Banks | Other financial corporations | Non-financial corporations | ||||
|---|---|---|---|---|---|---|
| Before hedging | After hedging | Before hedging | After hedging | Before hedging | After hedging | |
| A$ billion | ||||||
| Assets | 603 | 305 | 687 | 463 | 674 | 664 |
| Liabilities | 841 | 259 | 40 | 23 | 490 | 323 |
| Net balance sheet exposure | −238 | 45 | 647 | 441 | 184 | 341 |
| Per cent of GDP | ||||||
| Assets | 35 | 18 | 40 | 27 | 39 | 38 |
| Liabilities | 49 | 15 | 2 | 1 | 28 | 19 |
| Net balance sheet exposure | −14 | 3 | 37 | 26 | 11 | 20 |
|
Sources: ABS; RBA |
||||||
The change in banks' net foreign currency position after hedging by derivatives is taken into account reflects the fact that banks explicitly hedge 70 per cent of their foreign currency liabilities with derivatives, but only 50 per cent of their foreign currency assets. The overall net foreign currency asset position means that hedging fully offsets the exposure to the exchange rate risk that arises from the banks taking advantage of offshore markets to diversify their funding mix.
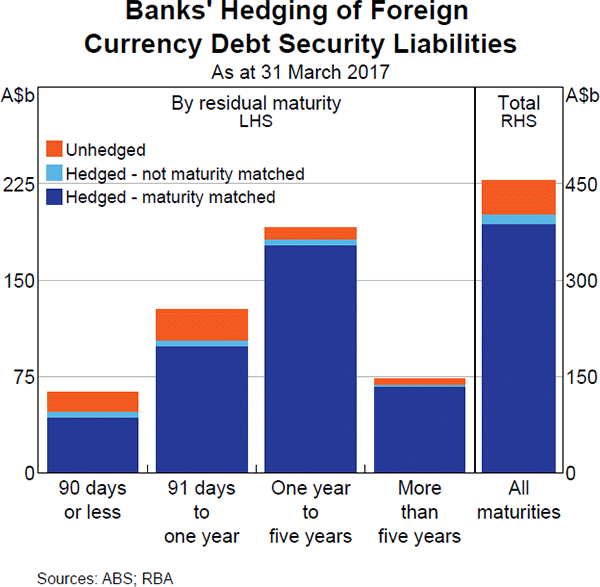
Debt security liabilities are the main source of foreign currency exposure for the banking sector, accounting for over half of the sector's foreign currency liabilities. The increase in banks' debt security liabilities since the previous survey has been proportionate to the increase in total bank balance sheets. The 2017 SFCE indicated that around 85 per cent of these liabilities were hedged using derivatives, with hedging more prevalent for long-term debt securities than short-term ones based on the remaining (residual) maturity of the security (Graph 4). Moreover, the SFCE indicated that the maturities of the derivatives used to hedge against foreign currency risk were well matched to the maturities of the underlying debt securities. This means that an entity will not be exposed to foreign currency risk for the duration of the underlying exposure and avoids the risk that it might not be able to obtain replacement derivatives if the original derivatives used for hedging did not cover the full maturity of the original exposures (that is, it avoids rollover risk).
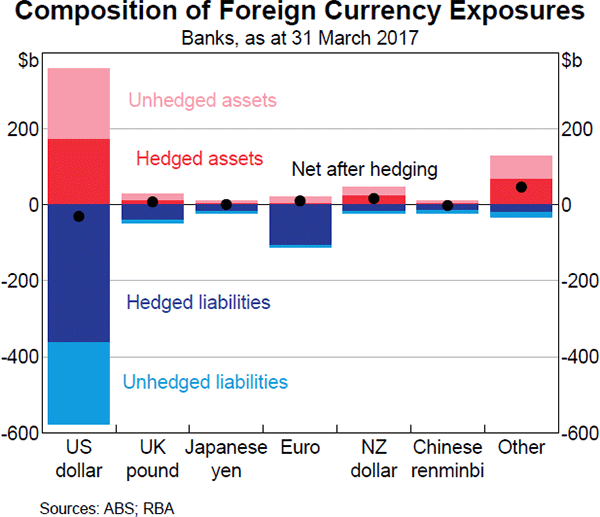
For the relatively modest share of banking sector liabilities that were not hedged with derivatives, there was typically a matching asset in the same foreign currency. Indeed, the banking sector reported that, of those liabilities that were not hedged with derivatives, around two-thirds had a natural hedge. As a result, after hedging is taken into account for individual currencies, there were only very small net foreign currency exposures for the sector as a whole (Graph 5). The extent of natural hedges looks to have increased over recent years, as banks have increased their foreign currency liabilities that are not hedged with derivatives and matched this with increased lending in the same foreign currency. In part, this increase in matched assets and liabilities reflects growth in lending by the Australian operations of foreign banks to non-residents. It may also partly reflect Australian banks' acquisition of high-quality liquid assets.
Other financial corporations
The other financial corporations sector includes non-bank financial corporations, including superannuation funds, fund managers and insurance corporations.[6] These entities generally invest on behalf of households and other firms with the aim of providing high risk-adjusted returns. These firms seek to diversify their investment portfolios by holding a variety of assets including foreign equities and assets that pay a fixed income, such as government and corporate bonds. For example, foreign equities represented 45 per cent of superannuation funds' equity holdings and foreign fixed income assets represented around one-third of their fixed income holdings as at 31 March 2017 (APRA 2017).
Since the previous survey, foreign currency assets of the other financial sector have increased notably, while the sector's foreign currency liabilities have decreased slightly. The increase in foreign currency assets is consistent with continued purchases of foreign equity assets, particularly by superannuation funds, as well as the increased Australian dollar value of the existing stock of assets arising from the depreciation of the Australian dollar since the previous survey (Black, Chapman and Windsor 2017). Superannuation funds have also increased their holdings of international fixed income and international infrastructure funds since the previous survey.
At the end of March 2017, other financial corporations had a net foreign currency asset position equivalent to 37 per cent of GDP. Foreign equity assets accounted for most of the sector's total foreign currency assets. These financial corporations used derivatives to hedge around one-third of their foreign currency assets. After accounting for the use of derivatives for hedging, the net foreign currency asset position of other financial corporations decreases to be equivalent to 26 per cent of GDP. The SFCE does not split the hedging of foreign currency assets by type, but Australian Prudential Regulation Authority data (APRA 2017) indicate that superannuation funds hedge around 65 per cent of their international debt holdings and listed infrastructure funds but only hedge 30 per cent of their international equity holdings.
Non-financial corporations
Non-financial corporations had a net foreign currency asset position equivalent to 11 per cent of GDP as at the end of March 2017 (Table 1).[7] This net position consisted of a significant amount of foreign currency assets, around two-thirds of which were equity assets.[8] However, the sector also had a significant amount of foreign currency liabilities, almost all of which were either long-term debt securities or loans. The sector's asset and liability positions were noticeably larger in 2017 than in the previous survey. This growth partly reflects valuation effects from the Australian dollar depreciation and, for assets, the performance of foreign equities. After accounting for the use of derivatives to hedge, non-financial corporations had a net foreign currency asset position of 20 per cent of GDP at the end of March 2017.
Non-financial corporations do not use derivatives for hedging as much as other sectors. The 2017 SFCE indicated that derivatives were used to hedge only around one-third of their foreign currency liabilities and a negligible amount of the foreign currency assets. This difference is related to the composition of the sectors' assets and liabilities. The foreign currency equity assets of the sector include the foreign operations (subsidiaries and branches) of multinational corporations, which are offset by foreign currency borrowing in the form of loans and debt securities. In addition, some non-financial corporations conduct much of their trade in foreign currency, so foreign currency borrowing is matched to trade payments. For example, a large share of Australia's resource exports is invoiced in US dollars (ABS 2016). Mining firms generally borrow in US dollars to match the currency of their debt payment obligations to these trade receipts.
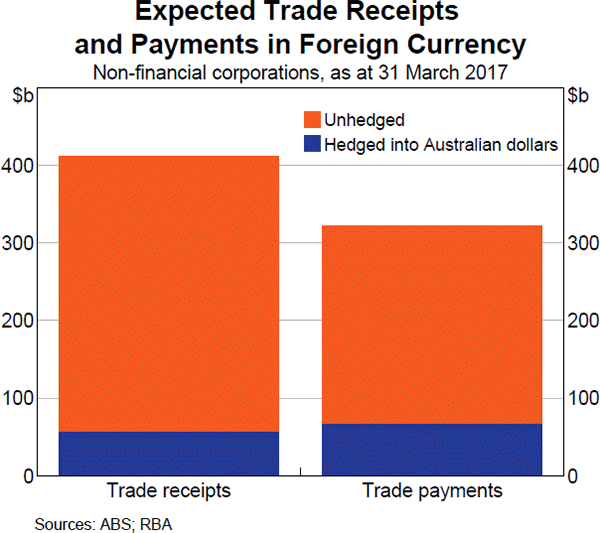
Changes to cash flows arising from exchange rate movements affect trade payment and receipts, and are a potential source of vulnerability for non-financial corporates. This is important because a large share of Australia's exports is invoiced in foreign currency. Non-financial corporations represent almost all of Australia's expected foreign currency trade receipts and a vast majority of Australia's expected foreign currency trade payments.[9] Hedging of these flows by derivatives is low. At the end of March 2017, non-financial corporations used derivatives to hedge around one-fifth of their foreign currency trade payments and around 15 per cent of their trade receipts (Graph 6). After accounting for the use of derivatives, the sector had around $350 billion in expected trade receipts and $250 billion in expected trade payments over the next four years.
Public sector
The public sector's foreign currency assets and liabilities are relatively small (Table 2). The general government sector, which includes federal, state and local governments, had a net foreign currency asset position of $108 billion before accounting for the use of derivatives for hedging purposes. The net foreign currency asset position has roughly doubled in its proportion relative to GDP since the previous survey to 6 per cent. This increase has been mainly driven by an increase in foreign currency assets. Foreign currency equity assets account for around two-thirds of the general government's total foreign currency assets. The Australian Government's Future Fund continues to hold a significant proportion of the foreign currency assets of the general government sector. The Future Fund had a net foreign currency asset position of around $85 billion at the end of the 2017 financial year (Future Fund 2017).
The Reserve Bank had a foreign currency asset position equivalent to 4 per cent of GDP as at 31 March 2017. This position represents the net foreign reserve holdings of the Reserve Bank. Before hedging is taken into account, these reserves reflect the use of foreign exchange swaps to manage domestic liquidity.[10]
Derivative Holdings
As well as providing information about Australian entities' foreign currency exposures and hedging, the SFCE also contained detailed information on derivative holdings as at the end of March 2017.
| General Government | Reserve Bank of Australia | |||
|---|---|---|---|---|
| Before hedging | After hedging | Before hedging | After hedging | |
| A$ billion | ||||
| Assets | 115 | 102 | 76 | 53 |
| Liabilities | 7 | 1 | 0 | 0 |
| Net balance sheet exposure | 108 | 101 | 76 | 53 |
| Per cent of GDP | ||||
| Assets | 7 | 6 | 4 | 3 |
| Liabilities | 0 | 0 | 0 | 0 |
| Net balance sheet exposure | 6 | 6 | 4 | 3 |
|
Sources: ABS; RBA |
||||
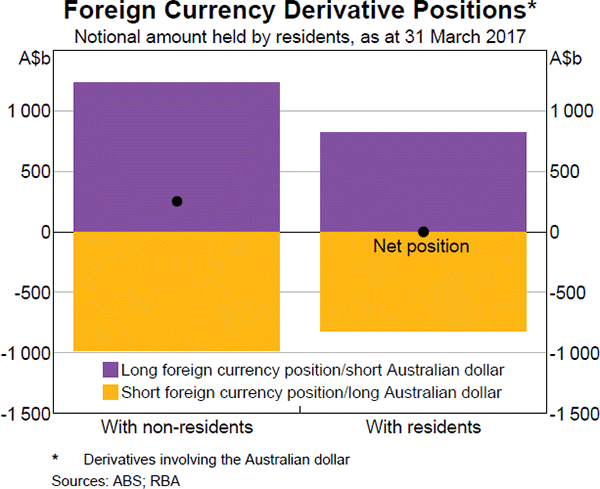
These are recorded on a notional basis (that is, the total value of the exposure the derivative is covering). Some of these derivatives are used to hedge foreign currency exposures, which have been the focus of much of this article, but the survey also captures derivatives used to gain exposure in particular foreign currency markets. Consistent with the finding that the use of derivatives for hedging increases Australia's net foreign currency asset position, the survey indicated that Australian entities were positioned such that they would profit from a depreciation of the Australian dollar (that is, they had a net short Australian dollar position or a net long foreign currency position against non-residents) (Graph 7).
Cross-currency swaps continue to be the main instrument used to hedge foreign currency exposures; holdings of these instruments are concentrated in the banking sector.[11] Cross-currency swaps, which are generally used to hedge longer-term foreign currency risk, accounted for slightly more than two-thirds of total notional long foreign currency positions (or short Australian dollar positions) and around half of short foreign currency derivative positions (or long Australian dollar positions). Forwards, which are generally used to hedge shorter-term foreign currency risk, accounted for most of the remainder of the positions. These shares were relatively unchanged from the previous survey, in line with relative stability in the maturity of banks' new offshore wholesale funding over this period. The shares had increased noticeably in the four years before the previous survey (Arsov et al 2013).
Summary
Australia's high level of investment relative to saving over a long period has been supported by capital inflows from the rest of the world. This has resulted in Australia having a net foreign liability position. However, due to the country's liabilities being mostly denominated in Australian dollars and assets being mostly denominated in foreign currency, Australia has a net foreign currency asset position, even before hedging by derivatives is taken into account. This means that a depreciation of the exchange rate increases the value of Australia's external position. By sector, only the banking sector had a net foreign currency liability position before hedging by derivatives is taken into account. However, the net foreign currency exposures of the banking sector are fully hedged by derivatives, which results in the sector having a small net foreign currency asset position after accounting for hedging. The banking sector's debt security liabilities, which account for more than half of the sector's total foreign currency liabilities, are almost fully hedged, and the maturities of the derivatives used to hedge the exchange rate risk are matched to the maturities of the underlying exposures. Moreover, there are no significant currency mismatches either for the banking sector or for the country as a whole. Overall, the 2017 SFCE indicated that the Australian economy, despite having an overall foreign liability position of close to 60 per cent of GDP, is well protected from a sharp depreciation of the exchange rate.
Footnotes
The authors are from International Department, and would like to thank Megan Garner, David Halperin and Callan Windsor for their contributions to the preparation of the Survey of Foreign Currency Exposure (SFCE) and to this article. The authors would also like to thank the Australian Bureau of Statistics for the preparation and distribution of the SFCE on which this article draws heavily. [*]
See Stevens (2013) for a fuller discussion of the role of a floating exchange rate in promoting macroeconomic stability. [1]
See ABS (2017a) for the primary source of this information. The results of the previous survey are discussed in Rush, Sadeghian and Wright (2013). [2]
For a discussion of the trends in saving and investment, see Bishop and Cassidy (2012). [3]
However, this is partly offset by the lower Australian dollar reducing the amount of foreign currency borrowing required to fund a given amount of Australian dollar assets. [4]
For a discussion of recent developments in the composition of Australian banks' funding, see Cheung (2017). [5]
Superannuation funds hold most of the sector's foreign currency assets. [6]
The SFCE reports the foreign currency exposures and hedging of other resident sectors. However, financial account data (ABS 2017c) suggest that non-financial corporations account for most of these sectors' exposures and hedging. [7]
The bulk of these assets reflect direct equity holdings of non-financial corporations, which consist of foreign operations and subsidiaries. [8]
Expected trade receipts and payments denominated in Australia dollars are not included in the survey. Around one-third of Australia's imports are denominated in Australian dollars, while only 15 per cent of Australia's exports are denominated in Australian dollars (ABS 2016). [9]
See RBA (2017) for a discussion of reserves management at the Reserve Bank. [10]
For further discussion of how cross-currency swaps are used, see Arsov et al (2013). [11]
References
Arsov I, G Moran, B Shanahan and K Stacey (2013), ‘OTC Derivatives Reforms and the Australian Cross-currency Swap Market’, RBA Bulletin, June, pp 55–63.
ABS (Australian Bureau of Statistics) (2016), ‘International Trade in Goods and Services, Australia, Oct 2016’, ABS Cat No 5368.0, October.
ABS (2017a), ‘Foreign Currency Exposure, Australia, March Quarter 2017’, ABS Cat No 5308.0, March.
ABS (2017b), ‘Balance of Payments and International Investment Position, March 2017’, ABS Cat No 5302.0, March.
ABS (2017c), ‘Australian National Accounts: Finance and Wealth, March 2017’, ABS Cat No 5232.0, March.
APRA (Australian Prudential Regulation Authority) (2017), ‘Quarterly Superannuation Performance Statistics’, June 2017.
Black S, B Chapman and C Windsor (2017), ‘Australian Capital Flows’, RBA Bulletin, June, pp 23–34.
Bishop J and N Cassidy (2012), ‘Trends in National Saving and Investment’, RBA Bulletin, March, pp 9–18.
Cheung B (2017), ‘Development in Banks' Funding Costs and Lending Rates’, RBA Bulletin, March, pp 45–50.
Future Fund (2017), ‘Future Fund Annual Report 2016–2017’.
RBA (Reserve Bank of Australia) (2017), Reserve Bank of Australia Annual Report 2017.
Rush A, D Sadeghian and M Wright (2013), ‘Foreign Currency Exposure and Hedging in Australia’, RBA Bulletin, December, pp 49–58.
Stevens G (2013), ‘The Australian Dollar: Thirty Years of Floating’, Speech at the Australian Business Economists’ Annual Dinner, Sydney, 21 November.