Bulletin – March 2017 Financial Stability Returns on Equity, Cost of Equity and the Implications for Banks
- Download 1MB
Abstract
Returns on equity for the major Australian banks have declined of late, following equity raisings in 2015. At the same time, estimates of the cost of raising new equity appear to have fallen very little, despite large declines in risk-free rates. These two developments help to explain why Australian bank stocks are now trading at a declining, but still sizeable, premium to their book value.
Introduction
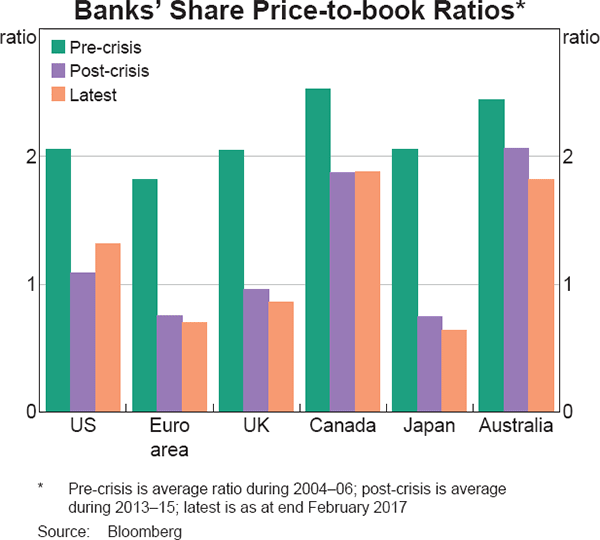
Share price-to-book (PB) ratios – a firm's market capitalisation divided by the accounting value of its equity – have fallen for banks across the world over the past decade (Graph 1). In most countries, the fall in banks' PB ratios occurred in 2007 and 2008 as problems in the banking sector started to emerge: PB ratios quickly declined from around 2 to 1 or less and have not changed much since then. PB ratios for Australian banks fell more modestly than in most other countries during the financial crisis and had recovered much of that decline by 2013, but have since declined materially.
PB ratios are commonly taken as a signal of banks' health so these declines have generated much commentary. Furthermore, Sarin and Summers (2016) argue that the fall in global banks' PB ratios suggests that the extensive regulatory reforms to the banking sector over the past decade have failed to convince investors that banks have become more resilient. They note that when leverage is measured using the market value of equity, banks in the major advanced economies are more leveraged than before because of large falls in their market capitalisation.
This article lays out a framework for how to interpret developments in PB ratios. In particular, it shows that changes in PB ratios are driven by shifts in either returns on equity (ROE) or the cost of equity (COE), or both. This framework is then applied to Australian banks, along with estimates of how their ROE and COE have evolved, to explain recent changes in their PB ratios. At a more fundamental level, the article discusses how both ROE and PB ratios can be influenced by the accounting treatment of goodwill, which supports using caution when drawing conclusions from differences in PB ratios across banks and over time.
Return on Equity, Cost of Equity and Price-to-book Ratios
ROE is a measure of how efficiently shareholder capital is being used to generate profit and is the most widely used metric to assess banks' profitability. Banks commonly set ROE targets both at the institution and product level – and these targets are often a central element of executive remuneration. Investors also use ROE to assess the performance of banks and regulators and academics commonly use it to calculate the cost to banks of raising capital requirements. ROE is determined by both the underlying profitability of a bank's assets and the extent to which these are leveraged. As a result, there is evidence that banks have historically increased leverage to meet ROE targets and that declining ROE has been a trigger for increased risk-taking (Haldane 2011; Adrian and Shin 2014; Adrian, Friedman and Muir 2015).
ROE (πe) is calculated by dividing earnings (E ) by the book value of a firm's equity (B) at time t:
Earnings are typically measured by net profits after tax. The book value of equity is taken from accounting statements and reflects the difference between assets and liabilities as measured under accounting standards. These standards require most assets to be measured at their acquisition cost (net of any subsequent depreciation for physical assets), although loans are valued at the amount outstanding (net of provisions) and some other financial assets – mostly securities and derivatives – are required to be measured at market value (the price they would fetch if sold). Importantly, intangible assets (including goodwill) are only recognised in book value to the extent that they can be separately identified from other assets and their acquisition cost can be accurately determined (a point discussed later).
COE is a related but distinct measure that captures the return required to entice investors to purchase and hold bank shares. It is a function of two market-determined prices: the risk-free rate of return (typically measured by the long-term sovereign bond yield); and a risk premium to compensate investors for holding a risky asset. Accordingly, COE will rise in response to an increase in investors' outlook for growth and inflation as well as any increase in uncertainty around this outlook (Rankin and Shah Idil 2014). The Modigliani-Miller (1958) theorem states that COE should also be proportional to the extent of leverage applied by a firm, although it is commonly accepted that several factors cause COE to depart from the strict predictions of the Modigliani-Miller theorem.
COE is unobservable because it measures investors' risk tolerance and expectations. Nonetheless, it can be proxied using the dividend discount model (Gordon and Shapiro 1956):
where re represents COE, D represents dividends, P the share price and g is the expected future growth rate of dividends. To facilitate a comparison with ROE, this can be converted to a function of earnings by replacing dividends with the product of earnings and the dividend payout ratio (δ):[1]
If investors expect a bank's dividend will not grow (g = 0) then its COE is equal to its forward earnings yield (Et+1/Pt; noting that non-growing companies in the model pay out all their earnings as dividends so that δ = 1).[2]
ROE has often been used as a proxy for COE, given that COE is not observable. The above relationships highlight two reasons why doing so can be misleading. The first is that ROE is calculated from the book value of equity while COE is calculated from the market value of equity. As discussed later, there are reasons why the book and market values of equity can differ substantially. Indeed, when g = 0 the ratio of ROE to COE is the bank's PB ratio:
and, as seen earlier, this ratio can deviate substantially from 1.
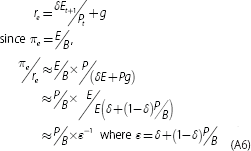
The second (less important) reason why the two metrics may differ is that ROE is calculated only from current profits, while COE is also conditional on expectations for future growth (that is, g). For a bank that is growing (g ≠ 0 and δ < 1), the intuition yielded by the equations above is unchanged but the formulae are more complex. In that instance, COE is still a function of the earnings yield (but adjusted for the difference between the return on equity measured at book and market value), while the ratio of ROE to COE is the PB ratio (but scaled by a weighted average of the PB ratio and 1, where the weight is the dividend payout ratio):
The detail behind these calculations is shown in Appendix A.
Historical Trends in Returns on Equity and the Cost of Equity
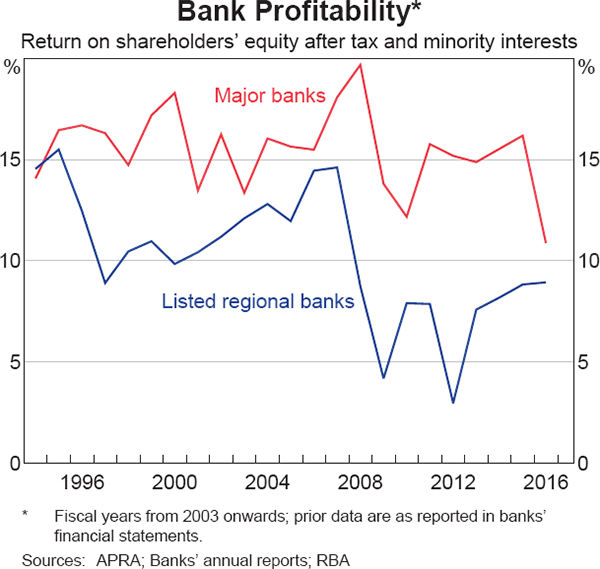
Australian banks have consistently generated ROE that are much higher than banks in most other countries. For the major banks, ROE averaged around 17½ per cent for the 15 years prior to the global financial crisis and moderated only slightly (to 15 per cent) over the past five years (Graph 2). However, ROE have fallen more notably over the past year as the major banks raised additional equity to meet tighter capital standards set by the Australian Prudential Regulation Authority (APRA). As this additional equity requirement is permanent, it is unlikely that ROE will return to the levels that major banks and their investors had become accustomed to without the banks taking additional risk or achieving substantial productivity gains.[3]
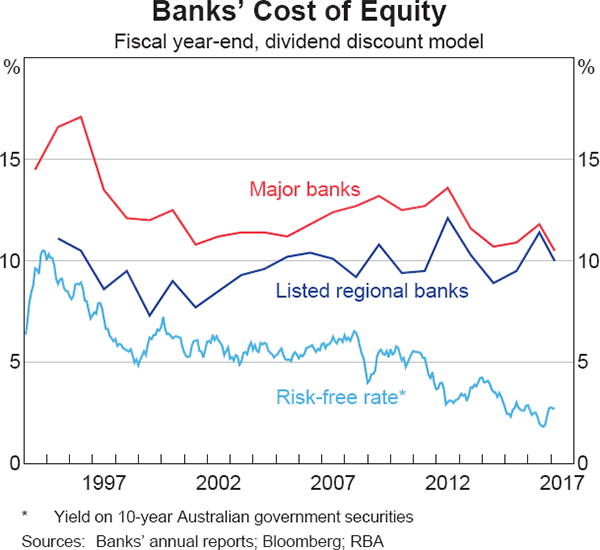
Estimates for Australian banks' COE, derived using the formula shown in Equation (1), are shown in Graph 3.[4] For the four largest banks, COE was consistently around 12 per cent between the late 1990s and the onset of the global financial crisis, and is currently only a little below that level. COE for the two listed regional banks has historically been lower than for the majors but this gap has narrowed as their COE has drifted up.[5] In both cases, the decline in risk-free yields since 2011 has had little impact on measured COE, in contrast to the earlier period of falling risk-free rates (the mid 1990s). Accordingly, the implied equity risk premia for these stocks have risen by almost 300 basis points since the financial crisis. COE measured using a common alternative method – the capital asset pricing model (CAPM) – also produces a lesser fall than the risk-free rate, largely because the sensitivity of banks' share prices to market-wide movements has risen.
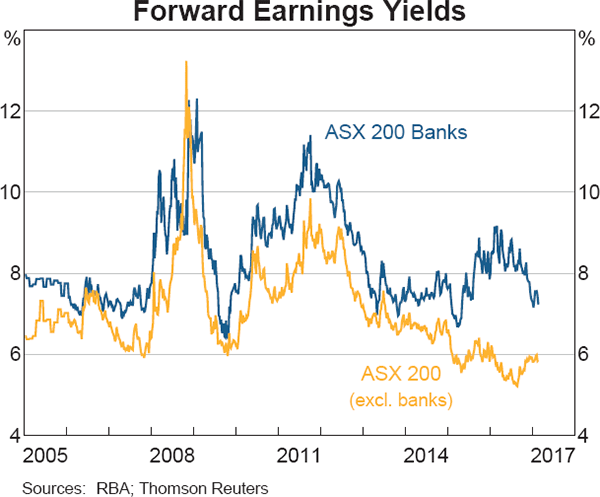
The apparent rise in risk premia since the financial crisis looks to have been much larger for banks than for other Australian companies. This is implied by the marked divergence between the earnings yield on bank equities and that on other equities over recent years (Graph 4), only part of which is likely to reflect a greater slowing in the outlook for banks' profit growth. It is not clear why risk premia on bank equities have risen relative to that on other stocks. Some part of the rise is likely to reflect an increase in concerns about the fragility of European banks during 2016 that spilled over to Australia. However, domestic factors were likely to have also been important since the earnings yield differential between banks and other stocks widened more notably in Australia. The divergence happened as banks raised additional equity and may in part reflect investors' uncertainty about how much more capital will be required over time.
Implications for Price-to-book Ratios
When considered alongside these trends in ROE and COE, the equations presented earlier provide a framework to understand why PB ratios for the major Australian banks have persistently been well above 1 (and much higher than for regional banks; Graph 5) and why they have declined over time.
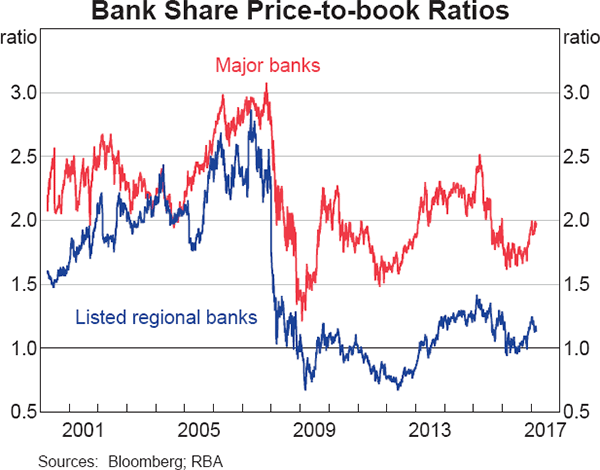
The first question – why the major banks' PB ratios have persistently been well above 1 – can be superficially explained by noting that their ROE have consistently and significantly exceeded their COE. The major banks have also generated much higher ROE than the regional banks since 2008, more than compensating for a slightly higher COE and resulting in more elevated PB ratios.
A deeper question, however, is why major banks' ROE have persistently been well above their COE. Davis (2012) argues that the fundamental reason is that management at the major banks feel ‘handicapped’ to price their products to meet prevailing high returns on equity and that smaller banks, whose ROE are closer to their COE, cannot effectively undercut these high prices. But a simpler explanation may be the impact of accounting standards relating to goodwill.
Goodwill is defined as an asset representing the future economic benefits that are expected to flow from the combination of other assets, but which cannot be individually and separately identified from the value of other assets (Australian Accounting Standards Board 2010, p 33). Australian accounting standards require goodwill to be recorded when there is a business acquisition in which the amount paid for that business exceeds the value of its identifiable net assets,[6] but prevent companies from recognising goodwill that is generated internally (that is, without an acquisition).[7] Accordingly, banks that have created ongoing value through the natural course of utilising their assets to develop their business organically will see their share price appreciate without any corresponding rise in their book value (that is, their PB ratio will rise). Internally generated goodwill such as this can take many forms, including brand value, synergies or advantages in funding or distribution.
The effect of this accounting treatment of goodwill on Australian banks' ROE and PB ratios can be most clearly observed from the merger of Bendigo Bank and Adelaide Bank in 2008. Before merging, these banks generated a weighted average pre-tax ROE of 20 per cent and had a combined PB ratio of 2.2. The transaction required the combined entity to book $1.5 billion of goodwill in its accounts, equivalent to almost half its combined shareholders' equity. Consistent with the theory above, this resulted in the combined entity's ROE immediately halving and its PB ratio falling to 1.3. This transaction also explains the step lower in the regional banks' PB ratios shown in Graph 5.[8] Similar effects would be observed if each of the major banks were to be sold, with the acquirer accounting for the associated goodwill. In aggregate, this would require the banks to book $210 billion of goodwill – almost as much as their current shareholders' equity – and would lower their ROE to the same level as their earnings yield (7½ per cent) and their PB ratios to 1.
Differences in the extent to which goodwill is recorded in book value at various banks have implications for how valid it is to compare ROE and PB ratios across banks or countries. The major Australian banks have a much smaller proportion of their book value attributable to goodwill than the regional banks – just over 10 per cent on average, compared with one-quarter for the listed regional banks – despite having brand names and other advantages that are more valuable. This gap in recorded goodwill explains a reasonable portion of the difference in ROE and PB ratios between these two sets of banks: excluding goodwill, both listed regional banks generated ROE that were similar to ANZ in the past financial year and have PB ratios that are equivalent to both ANZ and NAB (though still well below CBA and Westpac).
The second question – why banks' PB ratios declined during the financial crisis and again over the past two years – can also be explained by trends in their ROE and COE. The falls in PB ratios during the crisis occurred because of both a substantial decline in banks' ROE as credit losses increased and funding pressures built, and a rise in their COE as concerns about the health of the banking industry intensified. More recently, the movement in PB ratios has been more evident for the major banks than the regional ones. This is because major banks' ROE have fallen by almost 3 percentage points as a result of the large amount of new equity that was raised in response to regulatory changes, significantly reducing their leverage. (Return on assets has also fallen marginally.) In contrast, COE has been broadly stable over the same time, resulting in a narrower gap between ROE and COE and hence a 50 basis point decline in PB ratios (though some of this has been unwound very recently). These trends differ from those at banks globally: for banks in other countries, both ROE and COE appear to have been broadly unchanged over the past two years, resulting in their PB ratios holding steady (see Graph 1). This different trend in ROE (and, in turn, in PB ratios) arises because Australian banks increased their capital levels more rapidly than other banks over the past two years (APRA 2016) and global banks have generated a modest recovery in their return on assets of late (although from low levels). PB ratios for many global banks nevertheless remain low, reflecting concerns over the future value of their assets and profitability.
The narrowing gap between Australian banks' ROE and COE is at odds with the predictions of the Modigliani-Miller theorem whereby a reduction in leverage should have the same effect on both measures. Haldane (2011) notes that a narrowing like this creates an environment in which banks have an incentive to take additional risk – whether by writing loans to more marginal borrowers or by weakening the quality of their risk culture, monitoring or governance. To date, banks have instead sought to lift their ROE by raising the price of credit relative to the cash rate or by scaling back their exposure to lower return businesses, such as international banking and wealth management (RBA 2016). Some banks have also lowered their stated ROE targets. However, it will be important to continue monitoring how banks respond to pressure from investors for higher returns.
Appendix A
The dividend discount model states that the fair value of a share (P) is determined by the expected value of its future stream of dividends (D), discounted to present value using the cost of equity (re):
where Et is the expectations operator. A typical way to simplify this equation (following Gordon and Shapiro 1956) is to assume that the firm grows at a steady state (represented by g) forever, so that the model can be simplified to:
This can be rearranged to provide an expression for the cost of equity:
This can also be expressed in earnings form by replacing D with the product of earnings (E) and the dividend payout ratio (δ). It is also possible to eliminate the unobservable steady-state growth rate variable by noting that growth comes only from reinvesting retained earnings:
(where the second line uses the equation g = (1 − δ)E/B – the earnings retention rate times the return on equity).
For companies that are not expected to grow (g = 0), COE can be simplified to being the earnings yield (E/P) and the ratio of ROE (E/B) to COE is then the PB ratio:
This same relationship broadly holds when we allow for an expectation that dividends will grow (g ≠ 0), but the ratio of ROE to COE is now scaled by a weighted average of the PB ratio and 1 (with the weight being the dividend payout ratio):
For most banks (those that pay out at least half their earnings and grow at a moderate rate), this equation converges on the ratio of ROE to COE being the PB ratio. However, for banks that don't pay a dividend this equation implies that ROE always equals COE – the intuition being that there is no difference between the book value of equity and its market value when a firm is growing its capital rapidly.
Footnotes
The author is from Financial Stability Department. [*]
It is possible to write the model in terms of free cash flow if it is believed that investors care about earnings, regardless of whether they are reinvested or paid out. The intuitions of that approach are the same as those that follow. [1]
The dividend discount model naturally has limitations, the main one being that it only works for dividend-paying companies that are not growing too rapidly. It also assumes that leverage stays constant; if this is not true then g can be 0 and yet δ less than 1, which would mean that the earnings yield overstates COE. [2]
The requirement to hold more capital against riskier assets mitigates the possibility of greater risk-taking, but cannot remove it because risk weights aren't perfectly calibrated and there is no automatic capital increase in response to deteriorating risk culture or monitoring. [3]
One complication is how to value franking credits attached to the dividends paid by Australian banks. We attach full value to these franking credits when estimating COE. This assumption adds almost 2 percentage points to the estimated COE but is fairly consistent over the sample. [4]
It is difficult to know why the regional banks have a lower COE and yet a lower (stand-alone) credit rating. One possibility is that the marginal investor in regional banks has different preferences to the marginal investor in major banks, but this is difficult to prove. [5]
While such goodwill is recorded in book value, it is deducted from measures of capital used for regulatory purposes. [6]
Internally generated goodwill is not recognised because it isn't separable from other assets, does not arise from contractual or other legal rights and cannot be reliably measured at cost. For similar reasons, recorded goodwill – that is, arising from a business transaction – cannot be revalued upwards but must be amortised and can be subject to writedowns when it is deemed to have been impaired. [7]
The effects of other mergers in the Australian banking industry have been smaller. Westpac's merger with St. George increased the combined entity's goodwill by only 15 per cent of total equity. CBA booked no goodwill when it acquired Bankwest because its assets were acquired at a discount to book value. [8]
References
Adrian T, E Friedman and T Muir (2015), ‘The Cost of Capital of the Financial Sector’, Federal Reserve Bank of New York Staff Report No 755.
Adrian T and HS Shin (2014), ‘Procyclical Leverage and Value-at-Risk’, The Review of Financial Studies, 27(2), pp 373–403.
APRA (Australian Prudential Regulation Authority) (2016), ‘International Capital Comparison Update’, Insight No 2.
Australian Accounting Standards Board (2010), ‘AASB 3, Business Combinations’, 26 November, p33.
Davis K (2012), ‘Banking Profitability, Bank Capital and Competition’, Australian Centre for Financial Studies Financial Regulation Discussion Paper FRDP 2012-1.
Gordon M and E Shapiro (1956), ‘Capital Investment Analysis: the Require Rate of Profit’, Management Science, 3(1), pp 102–110.
Haldane A (2011), ‘Control Rights (and Wrongs)’, Wincott Annual Memorial Lecture, London, 24 October.
Modigliani F and M Miller (1958), ‘The Cost of Capital: Corporation Finance and the Theory of Investment’, The American Economic Review, 48(3), pp 261–297.
Rankin E and M Shah Idil (2014), ‘A Century of Stock-Bond Correlations’, RBA Bulletin, September, pp 67–73.
RBA (Reserve Bank of Australia) (2016), ‘Box C: Recent Developments in Australian Banks' Capital Position and Return on Equity’, Financial Stability Review, October, pp 40–43.
Sarin N and L Summers (2016), ‘Have Big Banks Gotten Safer?’, Brookings Papers on Economic Activity, Fall.


