Bulletin – March 2018 Australian Economy The Distribution of Mortgage Rates
- Download 467KB

Abstract
Mortgage interest rates can vary considerably across borrowers and are typically less than the standard variable rates (SVRs) advertised by banks. This article uses loan-level data to explore the relationships between interest rates and the characteristics of borrowers and their loans. Mortgages with riskier characteristics tend to have higher interest rates. Discounts applied to SVRs have tended to increase over recent years, and are also influenced by the type of loan and its size.
Introduction
The typical mortgage in Australia has a variable interest rate and is priced with reference to a benchmark SVR. SVRs are indicative rates advertised by lenders and are unlikely to be the actual interest rate paid on a loan. Borrowers are typically offered discounts on these SVRs, which vary according to the characteristics of the borrower and the loan. Discounts may also vary by institution and the level of discounts has varied over time. It is difficult to obtain comprehensive data on the level of interest rates actually paid by borrowers as banks apply both advertised and unadvertised discounts. Since mid 2015, the Reserve Bank has been collecting loan-level data on residential mortgage-backed securities.[1] These data are collected in the Bank's Securitisation Dataset and provide timely and detailed information on mortgages. We use these data to explore the relationships between interest rates and the characteristics of borrowers and their loans. If banks use risk-based pricing, then mortgages with less risky characteristics will tend to receive larger discounts.
The Securitisation Dataset
The Reserve Bank accepts certain asset-backed securities as collateral in its domestic market operations.[2] In order to be accepted as collateral, detailed information about the assets underlying the securities and their structural features are made available to the Reserve Bank.[3] The Securitisation Dataset allows the Reserve Bank (and other investors) to more accurately assess the risk and pricing of these securities, reducing the reliance on rating agencies.
Most of the asset-backed securities in the dataset are underpinned by residential mortgages. The Securitisation Dataset currently receives data (with a one-month lag) on 1.7 million individual residential mortgages with a total value of around $400 billion. This accounts for about one-quarter of the total value of housing loans in Australia. Detailed data are available on each loan. Around 100 data fields are collected, including loan characteristics, borrower characteristics and details on the property underlying the mortgage. Such granular and timely data are not readily available from other sources and the dataset can be used to obtain valuable insights into the mortgage market.[4]
Despite the size and breadth of the dataset, the loans in the Securitisation Dataset may not be representative of the entire mortgage market across all of its dimensions. The types of mortgages that are securitised may be influenced by the way credit ratings agencies assign ratings, the type of lender, investor preferences, and by the Reserve Bank's repo-eligibility framework. Even so, on aggregate metrics such as investor and interest-only shares and average loan-to-valuation ratio (LVR), the sample of securitised loans appears to be no riskier than the broader population of mortgages.
Interest Rates and Discounts
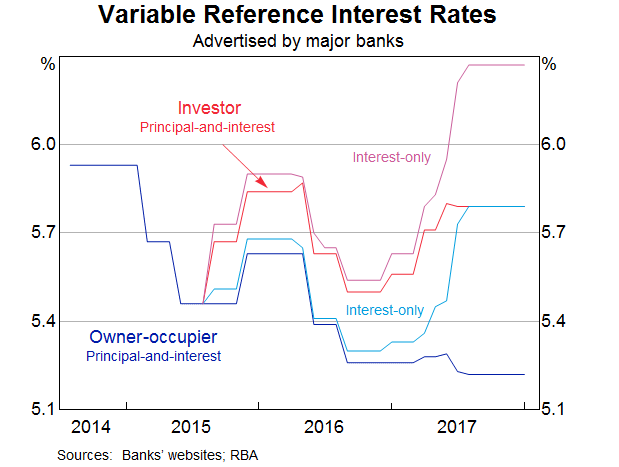
In the years before 2015, banks would generally each set one main SVR for mortgages with no distinction between the different types of loans.[5] Over the past few years, banks have introduced differential pricing in response to measures by the Australian Prudential Regulation Authority (APRA) to place limits on investor and interest-only lending and to improve lending standards.[6] Banks now advertise SVRs on four main types of loans across two dimensions: whether the borrower is an owner-occupier or investor, and whether the loan payments are principal-and-interest (P&I) or interest-only (IO) (Graph 1).
The actual interest rates paid by borrowers are typically discounted relative to SVRs. The discount is initially set or negotiated when the loan is written and applies over the life of the loan. Some borrowers may decide to take up advertised discounts, such as through packaged deals, which bundle a loan with several other financial products, or may negotiate unadvertised discounts. Borrowers may also renegotiate discounts over time to obtain a larger discount over the remaining life of the loan. A common way for this to occur is for the borrower to refinance a loan with another lender.
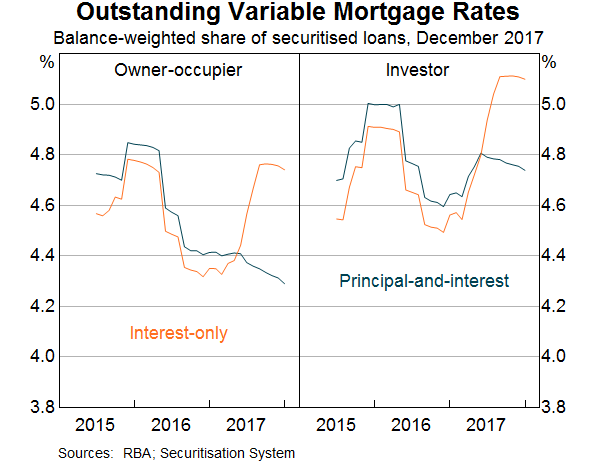
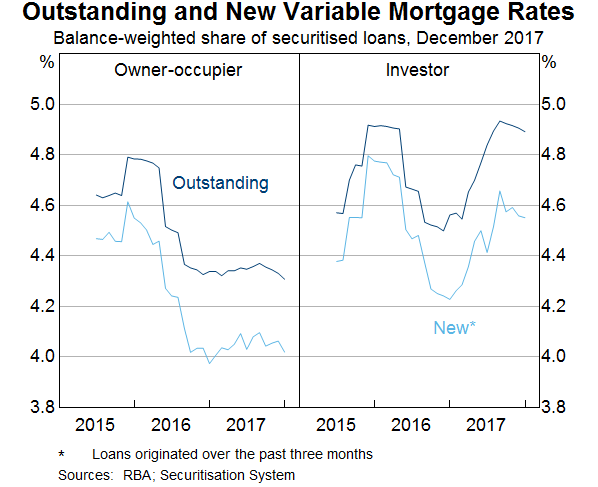
The Securitisation Dataset includes data on the interest rate paid on individual loans and provides insights into how actual interest rates paid have changed over time (Graph 2). Consistent with the developments in SVRs over the past two years, the outstanding interest rate on securitised loans has increased on investor and IO loans, but has fallen on owner-occupier P&I loans. However, the average level of outstanding interest rates is lower than would be suggested by only looking at SVRs, and the gap between the different types of loans is smaller than the gap between SVRs. More recently, there has been less change in the level of outstanding interest rates paid as the banks' responses to regulatory measures appeared to have largely flowed through to the existing loan pool.
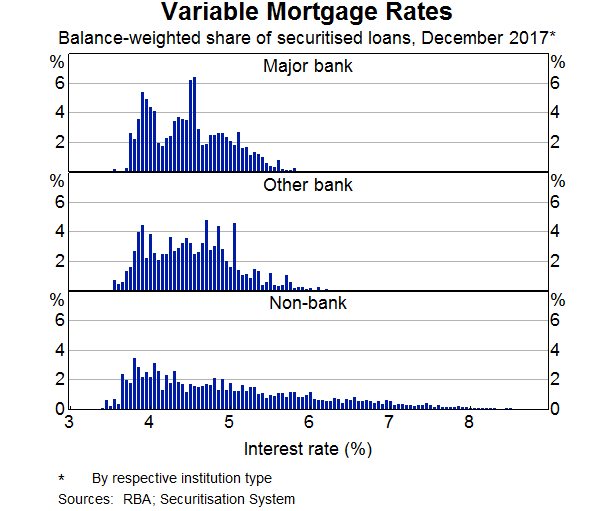
Measures of average outstanding interest rates mask the broad range of interest rates paid by borrowers (Graph 3). The major banks offer variable interest rates within a range of around 2 percentage points and this distribution is comparable to that of smaller banks, suggesting they are competing for similar types of borrowers. The range of interest rates offered by non-bank lenders is much larger, reflecting the different types of lenders and borrowers in this segment. Some non-bank lenders specialise in providing riskier mortgages, such as to borrowers that require ‘alternative’ or low-documentation loans (e.g. self-employed borrowers) or have impaired credit histories, or loans with high LVRs. Other non-bank lenders offer products with a similar level of interest rates to the banks.
There is also a wide distribution of interest rates for each of the four main types of loans (Graph 4). For the major banks, very few borrowers actually pay the relevant SVR. There is a wide range of interest rates within each type of loan category, consistent with a degree of risk-based pricing. In response to the regulatory measures, the distribution of interest rates for owner-occupier loans with P&I payments has shifted towards the left (i.e. lower interest rates) while the other distributions have shifted towards the right (i.e. higher interest rates). The distributions, which largely overlapped before the introduction of the recent regulatory measures, are now more distinct.
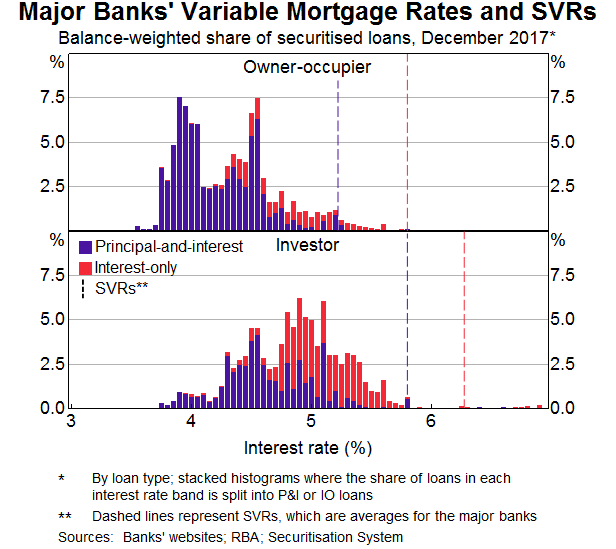
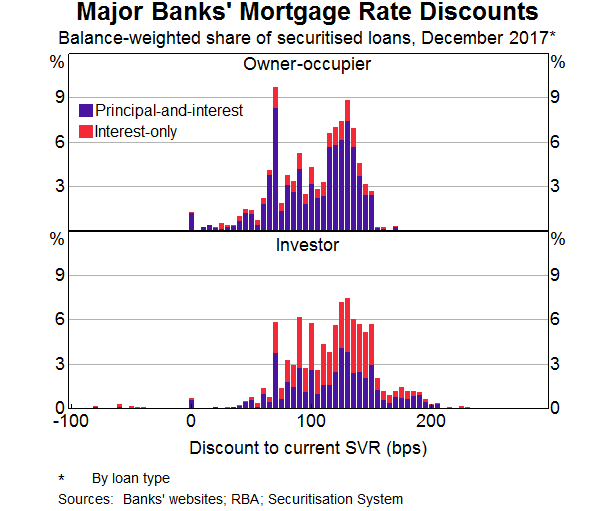
There is a wide distribution of (implied) mortgage discounts. Most discounts are between 50 and 150 basis points for the major banks (Graph 5). A large proportion of borrowers received a discount of at least 100 basis points. Discounts tend to be slightly larger for investor loans, a small share of which have discounts greater than 150 basis points. However, investor loans now have higher SVRs so this does not necessarily translate into a lower interest rate paid compared with owner-occupier loans.
The discount applied to a mortgage is likely to depend on a number of factors. First, the level of discounting may be an important tool for lenders to account for the risk of the different types of loans and borrowers. Other things being equal, more creditworthy borrowers or lower-risk loans are likely to be offered larger discounts. Second, discounts may reflect the objectives of lenders regarding the composition, growth and return on their mortgage books, which are influenced by factors such as competition between lenders, funding costs and the regulatory environment. While these factors should also affect SVRs, discounts may move independently of SVRs depending on lenders' discount decisions. In particular, changes to reference rates would affect a bank's entire mortgage portfolio while changes to discounts affect only new borrowers. Furthermore, because borrowers can negotiate discounts with lenders, discounts reflect the bargaining process with individual borrowers.
Modelling Mortgage Interest Rate Discounts
A simple regression model can be used to examine which characteristics are the most important determinants of the size of discounts applied to loans written by the major banks. These loans account for the majority of loans in the Securitisation Dataset. The model provides estimates of how a specific variable relates to the size of the discount on a loan, while controlling for the effect of other variables considered in the model.
The choice of variables included in the model is limited to the information available in the Securitisation Dataset. There may be other economic or financial variables that influence how lenders determine discounts, such as bank funding conditions, but this was outside the scope of this analysis. [7] The variables included are: loan characteristics, such as the type of loan, lender, loan amount, LVR and when the loan was written; borrower characteristics, such as income and employment type; and details of the collateral underlying the mortgage, such as the property type and the state or territory in which it is located. Where possible, the variables selected reflect characteristics prevailing when the loan was written, as discounts applied to loans in the dataset were largely set when the loans were written. For example, the original LVR and approval amount are used instead of the current LVR and loan balance.[8]
The model estimates the discount on variable rate loans that were written by the major banks from 2014 onwards and outstanding in December 2017.[9] Overall, the model suggests that the most important determinants of discounts are when the loan was written, loan type, and loan size: more recent loans, investor loans and larger loans attract larger discounts (Table 1).[10] However, since SVRs are now higher for IO and investor loans, the larger discounts for investors are relative to higher SVRs. The results for LVRs are mixed, while the effects of most other borrower and loan characteristics were relatively small. The model can explain around one-quarter of the variation in mortgage discounts, indicating that there are other factors that also influenced mortgage rate discounts that are not accounted for in the model. Further details of the model are available in Appendix A.
| Variables (a) | Coefficient Estimate (b) |
|---|---|
| Intercept | 95.5 |
| Seasoning (months) | −0.8 |
| Loan type (base = owner-occupier P&I) | |
| Owner-occupier IO | −8.5 |
| Investor P&I | 15.3 |
| Investor IO | 8.8 |
| Approval amount (c) | 3.3 |
| Approval amount^2 (c) | −0.1 |
| Original LVR | 0.1 |
| Original LVR × (original LVR>80) | −0.02 |
| Lender’s mortgage insurance coverage | −8.0 |
| Income(d) | 0.05 |
| Approval loan-to-income ratio | −0.4 |
| Apartment | 1.8 |
| Broker-originated | 4.5 |
| Full documentation | 13.3 |
| Loan purpose (base = purchase existing dwelling) | |
| Refinance | 1.3 |
| Purchase new dwelling | 0.1 |
| Construction | −8.0 |
| Other | −9.8 |
| Non-metro | −6.1 |
| Not PAYG employee | −2.9 |
| R2 | 0.28 |
| Number of observations | 409,832 |
|
(a) Includes fixed-effects dummies for institution and the state or territory
in which the property is located but the results are not shown Sources: RBA; Securitisation System |
|
Loan settlement date
The level of discounts applied by banks increased between 2014 and 2017. Seasoning (i.e. the age of the loan) is used in the model to indicate when the loan was written, with newer loans being less seasoned. The model suggests that discounts tend to be larger for newer loans, after controlling for differences across loans; a recently written loan would typically receive a 20 basis points larger discount than the same loan written two years ago. This result is consistent with other estimates from the Securitisation Dataset, which show that the average interest rate on recently written loans has been below the interest rate on outstanding loans over the past few years (Graph 6).
This increase in discounts suggests that competition is stronger for new borrowers than for existing customers, particularly for owner-occupier loans. The Reserve Bank has noted the apparent difference in competition for new and existing borrowers in its recent submission to the Productivity Commission's public inquiry into competition in the Australian financial system.[11] Small differences in discounts can greatly affect the amount the borrower has to pay over the life of the loan. The submission noted that more transparency in the mortgage market may make it easier for existing borrowers to assess whether they should consider renegotiating their mortgage or switching to another lender.
Loan type
Owner-occupier loans with P&I payments are the most common type of loan in Australia. Borrowers with these types of loans are required to make regular interest and principal payments. The property that the loan is secured against is likely to be the borrower's primary residence. These loans are considered by many, including the credit rating agencies, to be a less risky type of loan.[12]
The model suggests that an IO loan receives a discount that is around 10 basis points smaller than the same loan requiring both P&I payments. As SVRs on IO loans are higher than on P&I loans, this means that the interest rates on IO loans are typically higher than for P&I loans. Loans that require only interest payments are often considered to be more risky than a loan that also requires principal repayments. Typically, an IO borrower is not required to make any principal payments for the first five to ten years of the loan (although funds may be placed in offset accounts). With less principal repayments, the lender would be more likely to incur losses if the borrower defaulted.[13]
The results suggest that the discounts applied to investor loans are around 15 basis points larger than for owner-occupier loans with the same characteristics. However, as SVRs on investor loans are now higher than owner-occupied loans, the interest rates paid on the former are typically higher. The larger discount for investor loans may be partially explained by some investors renegotiating discounts. Their incentive to do so is now much greater because investor SVRs have risen relative to owner-occupier SVRs.
Loan size
The results indicate that sizable discounts are offered to larger loans. For example, a borrower with a loan approval for $1,000,000 would expect to attract around a 12 basis points larger discount than for a loan with the same characteristics but smaller size of $400,000. Borrowers seeking larger loans may have more bargaining power to negotiate greater discounts. Moreover, lenders may be more willing to offer greater discounts to larger loans given the fixed costs associated with writing loans (independent of loan size).
Loan-to-valuation ratio
The LVR is an important indicator of the riskiness of a loan. Higher LVR loans are on average riskier due to there being lower equity buffers to absorb any potential declines in the value of the property. There is prudential guidance for banks to have internal limits on these types of loans. Borrowers with an LVR above 80 per cent are also typically required to pay for lenders' mortgage insurance (LMI). Although LMI should reduce the risk to the lender, high LVR loans are still typically considered to be more risky. Borrowers who are required to pay for LMI may also be more cash-constrained and have lower capacity to pay back a mortgage.
The results indicate that loans with original LVRs greater than 80 per cent and/or that are covered by LMI tend to receive lower discounts. Most loans have LVRs between 60 and 80 per cent (at origination), with banks applying larger discounts to loans with LVRs below 80 per cent. All else being equal, a loan with an LVR of 70 per cent receives around a 10 basis point larger discount than a loan with an LVR of 90 per cent and LMI coverage.
However, the results indicate that there is some variation across institutions in the discounts offered for different LVRs. This may suggest that banks also consider other characteristics that are correlated with risk when setting discounts, but that we could not easily model. For example, data are not consistently available within the Securitisation Dataset for credit scores or to measure a borrower's ability to repay the loan. Loan-to-income ratios are calculated as a proxy for a borrower's ability to repay. These ratios do not account for other debts the borrower may have and are found to have relatively little effect on discounts. However, looking just at loans where banks provide a consistent credit score measure across their loans, the model suggests that borrowers with high credit scores receive larger discounts compared to those with relatively low scores.
Other characteristics
The results for the other variables in the model indicate that characteristics associated with riskier loans typically attract lower discounts. However, the effect of these variables is generally smaller than for the variables outlined above. For instance, self-employed borrowers and loans on properties in regional areas receive smaller discounts of around 5 basis points respectively. Construction loans also receive smaller discounts compared to loans secured against an existing property. There are smaller discounts for loans without full documentation (where the borrower's income and employment hasn't been formally verified). The model suggests that these loans receive a discount that is 15 basis points lower, although only a small proportion of loans issued by major banks did not have full documentation.
Factors other than risk may also influence the discount a loan receives, such as the cost to the bank of writing the loan and the bargaining process with individual borrowers. For example, a borrower may obtain a loan by going to a bank or speaking to a mortgage broker. The results indicate that loans issued via mortgage brokers receive around a 5 basis point larger discount, which is a relatively small difference.[14] Discounts are also slightly larger for refinanced loans, consistent with borrowers aiming to negotiate a better rate compared with their existing loan.
Conclusion
The Securitisation Dataset provides detailed information on mortgage interest rates and can be used to obtain valuable insights into the pricing of mortgages. This includes analysis on the banks' responses to regulatory measures, the effect of competition, and how banks set interest rates on individual loans. We find that interest rate discounts increased between 2014 and 2017, and that the most important determinants of the distribution of these discounts are the loan size and loan type. In particular, mortgage rate discounts are higher for newer and larger loans; investor loans also attract larger discounts but this is relative to higher SVRs for this type of loan. While discounts offered by banks appear to reflect the perceived riskiness of a loan (which depends on borrower and loan characteristics), a range of other factors may also influence the interest rates that borrowers pay.
Appendix A: Methodology
The model is a linear regression of mortgage rate discounts against a range of explanatory variables. We limit the analysis to mortgages from the major banks as SVR data are limited for smaller lenders and their pricing behaviour may be different (particularly for non-banks). One challenge with modelling discounts using the Securitisation Dataset is that the data includes a large number of potentially relevant variables which makes variable selection difficult. Rather than just including all possible variables, the choice of variables in the model is based on economic theory and was crosschecked by using Lasso (least absolute shrinkage and selection operator) regressions.[15] Furthermore, as the dataset includes a very large number of loans, the regression results suggest that most coefficients are statistically significant and we need to be careful not to overstate the economic significance of some of the results. The results should also be interpreted with the possibility that there may be selection biases; discounts are conditional on a borrower accepting a mortgage offer (and that mortgage being securitised).
Variables that are associated with larger discounts have positive coefficients, while variables with negative coefficients are associated with smaller discounts. Dummy variables are included to capture any differences across institutions; for example, SVRs may vary across institution. Dummy variables are also included for the state or territory the property is located, with the coefficients very small for most regions. The coefficients on the categorical variables such as loan type and loan purpose are interpreted relative to the base category. For example, the model suggests relative to owner-occupier P&I loans, discounts for owner-occupier IO loans are around 9 basis points smaller. A squared term is included for approval amount to capture any non-linear relationship. There is also an interaction term between original LVR and whether the loan has an LVR over 80 per cent as a discontinuity in discounts is expected for loans with LVRs over 80 per cent.
Footnotes
The authors are from Domestic Markets Department. [*]
For more information about RMBS, see Arsov, Kim and Stacey (2015). [1]
For more details, see Aylmer (2016) and <https://www.rba.gov.au/mkt-operations/resources/tech-notes/eligible-securities.html>. [2]
More detail on permitted users, data access and reporting templates is available at <https://www.rba.gov.au/securitisations/> and <http://www.securitisation.com.au/standards>. [3]
See Kent (2017) and Kohler (2017) for additional insights into the mortgage market using the Securitisation Dataset. [4]
The term ‘bank’ here refers to all authorised deposit-taking institutions, namely banks, building societies and credit unions. [5]
For more information on the announced measures, see APRA (2017). [6]
However, this would bias our model estimates only if there are variables ‘omitted’ from the model that are correlated with the variables included. [7]
Original LVR is not available for some loans and instead current LVR is used. Current LVR is based on the current loan balance and the most recently available property valuation (typically the value when the loan was written). Loan approval amounts are available for most loans; where data are not available, original loan amounts are used instead. [8]
Variable rate mortgages represent around 85 per cent of loans in the Securitisation Dataset. [9]
Results from analysis of variance (ANOVA) show that these variables account for most of the variance explained by the model. [10]
For details of the Reserve Bank's submission, see RBA (2017b). [11]
For details on how credit ratings agencies assess the risk of loans and RMBS, see Moody's (2017) and Standard and Poor's (2011). [12]
For more information on IO lending, see RBA (2017a). [13]
An ASIC (2017) review into mortgage brokers found that there was no consistent difference between broker and non-broker loans across lenders and any differences were very small. [14]
Lasso regressions can be used to assist in variable selection when the potential set of variables is large, with the methodology applying penalties to regressions with more variables; see Tibshirani (1996) for more details. [15]
References
Arsov I, IS Kim and K Stacey (2015), ‘Structural Features of Australian Residential Mortgage-backed Securities’, RBA Bulletin, June, pp 43–58.
ASIC (Australian Securities & Investments Commission) (2017), ‘Review of Mortgage Broker Remuneration’, Report 516, March.
APRA (Australian Prudential and Regulatory Authority) (2017), ‘APRA Announces Further Measures to Reinforce Sound Residential Mortgage Lending Practices’, Media Release No 17.11, 31 March.
Aylmer C (2016), ‘Towards a More Transparent Securitisation Market’, Address to Australian Securitisation Conference, Sydney, 22 November.
Kent C (2017), ‘Some Innovative Mortgage Data’, Address to Moody's Analytics Australia Conference 2017, Sydney, 14 August.
Kohler M (2017), ‘Mortgage Insights From Securitisation Data’, Address to Australian Securitisation Forum, Sydney, 20 November.
Moody's (2016), ‘Moody's Approach to Rating RMBS Using the MILAN Framework’, Rating Methodology, September.
RBA (Reserve Bank of Australia) (2017a), ‘Box B: Interest-only Mortgage Lending’, Financial Stability Review, April, pp 26-27.
RBA (2017b), ‘Competition in the Financial System’, Submission to the Productivity Commission Inquiry, September.
Tibshirani R (1996), ‘Regression Shrinkage and Selection via the Lasso’, Journal of the Royal Statistical Society. Series B (Methodological), 58(1), pp 267-288.
Standard & Poor's (2011), ‘Australian RMBS Rating Methodology and Assumptions’, Criteria, September.