Bulletin – March 2019 Global Economy The International Trade in Services
- Download 555KB

Abstract
Services are becoming increasingly traded globally and technological advances have led to the rise of more modern services such as communications, financial and intellectual property services. While advanced economies continue to account for the bulk of the demand and supply of services traded around the world, the emerging economies' share has been increasing. This article examines the changing global trends and compares them to Australia's experience with services trade, which has been shaped by China's growing demand.
Introduction
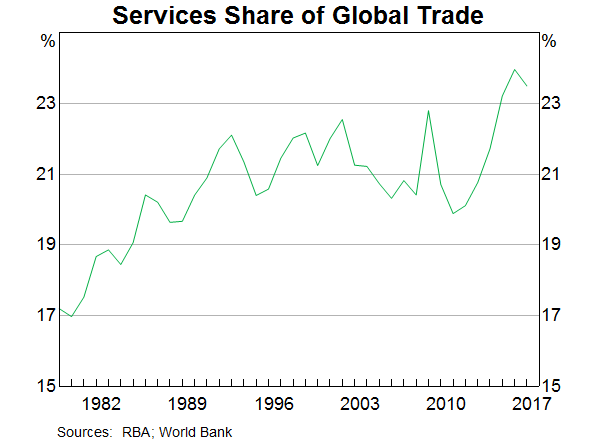
Services account for around two-thirds of global output and 75 per cent of total employment, yet they account for less than one-quarter of global trade (Graph 1). Historically, international trade in services has been less prevalent than the trade in goods, because buyers and sellers have needed to be face to face. However, advances in communications technology have allowed for more services to be traded.
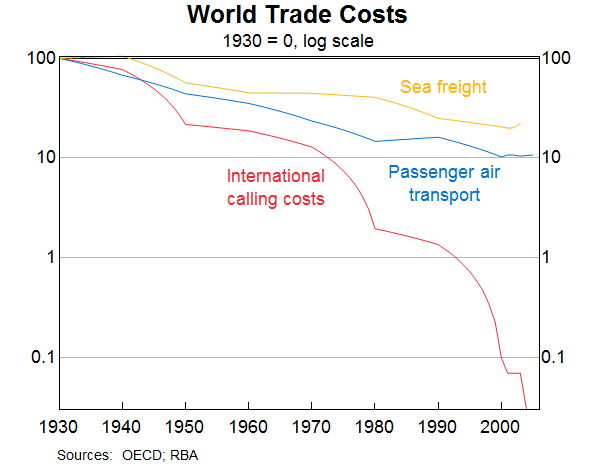
Declines in the cost of transportation (freight and passenger) – which is itself a traded service – and falling communication costs have encouraged trade in services, as well as goods (Graph 2). Innovations in transport services have also enabled goods to be produced in longer value chains around the world, further contributing to trade in goods.[1] Business support functions have been increasingly outsourced in response to cost and technology developments. The rise of multinational corporations has also increased services trade because they create within-firm cross-border transactions in intellectual property, human resources and information technology. There have also been concerted efforts to liberalise trade in services over the past couple of decades, although barriers to trade in services remain higher than for goods (IMF 2018).
This article outlines developments in the main exporters and importers of services, and the main types of services traded. The unique role that services have played in global value chains is also discussed. Finally, the article places Australia's experience with services trade in the global context.
Who Trades Services?
Services trade is dominated by the large advanced economies (the United States, United Kingdom, Japan and the euro area) (Graph 3). These four economies account for 50 per cent of exports and 40 per cent of imports of services, which is larger than their share of global output and goods trade (around one-third). In contrast to goods trade – where large advanced economies are net consumers, often importing manufactured goods from emerging economies – large advanced economies are net providers of services. These are often high-value professional and intellectual property services exported to emerging economies. The advanced economies also trade large volumes of services with each other.
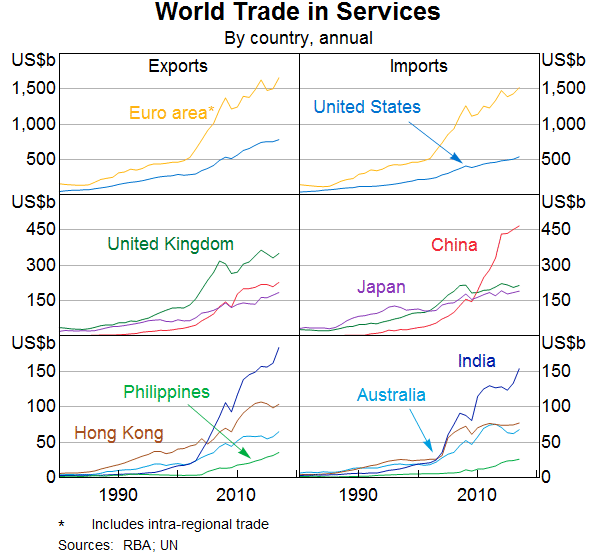
While emerging economies trade less services in total than advanced economies, they are increasingly important for services trade. Emerging economy service exports have grown at twice the rate of exports from advanced economies over the past few decades. This growth has been driven by the Asian region, in particular China, which is now the world's fourth largest services exporter. Growth has been assisted by government support as part of a broader effort to rebalance the economy towards domestic consumption and the export of higher-value goods and services (The State Council of The People's Republic of China 2018). Much of the growth in global demand for services, particularly from emerging economies, has come from the increasing popularity of outbound travel from China. China is now the world's third largest services importer, marginally behind the United States, and is the largest net consumer of services.
Hong Kong, India and the Philippines have also contributed to the rapid growth of exports and are net providers of traded services. China has been a direct source of demand for many of Hong Kong's ‘merchanting’ services.[2] Hong Kong also acts as a financial entry point to China. As a result, Hong Kong generates sizeable financial service exports (Leung et al 2008). In India and the Philippines, service exports have risen rapidly due to the outsourcing of support services to these countries and the growth in telecommunications services.
What Services Are Traded?
Travel and transport accounted for the majority of global services trade until the late 1990s (Graph 4). These services are ‘traditional’ in the sense that they involve face-to-face transactions.
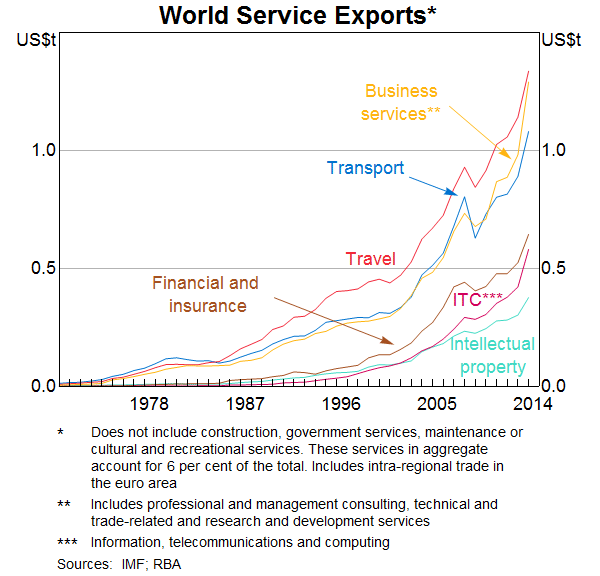
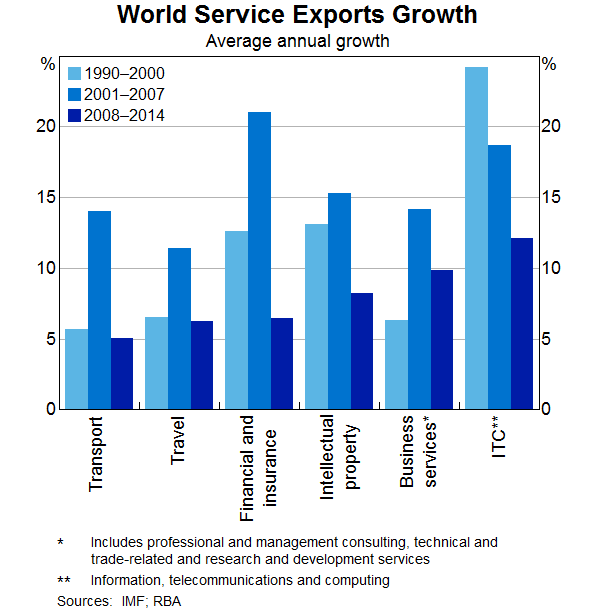
In recent decades, technological progress and changes in the regulatory environment have facilitated trade in a broader range of services, including financial and insurance services, intellectual property charges, communication & computing services, professional & management consulting and technical services. These more ‘modern’ services have increased from around one-quarter of service exports in the early 1970s to half in 2017, and continue to grow rapidly (Graph 5).
Travel
Travel is the single largest service export, accounting for around US$1¼ trillion in global exports annually. Travel includes services provided by a country to foreign tourists, students and business travellers, and covers services like accommodation, meals, tourist attractions and education expenses. It does not include the transport to and from the country, which is captured in transport services.
Since 2000, global travel exports have increased rapidly. The most important driver of this growth has been demand from China. Chinese nationals are travelling abroad much more than they used to, which has been the result of rising Chinese disposable incomes, the relaxation of foreign travel restrictions and the growth of low-cost airlines. The total number of visits to foreign economies from China has increased from 10.5 million in 2000 to around 150 million in 2017, and China is now the largest outbound travel market in the world. Chinese tourists also spend more than twice the amount of an American tourist on average (World Tourism Organisation 2018). Another driver of outbound travel has been demand for foreign education. The number of Chinese students studying abroad has increased from just over 100,000 in 2005 to more than 600,000 in 2017. The most popular destinations to study have been the United States, the United Kingdom and Australia. As a result of these trends, China now accounts for around 20 per cent of global travel demand and this is expected to increase further.
Transport
Transport services capture the movement of people, animals and goods across borders by air, sea, road and rail. Sea transport is predominantly used for the movement of goods, so this trade largely involves economies that are large trading hubs, such as China, Denmark, Hong Kong, Japan, Korea, the Netherlands and Singapore. Air transport services typically originate from economies that are airline hubs, such as Germany, the United States, the United Arab Emirates and the United Kingdom. Goods trade and transport services trade are closely linked and during the Global Financial Crisis (GFC), slowing trade in goods saw a contraction in world transport exports. Most of the growth in transport exports over recent decades has been driven by increasing goods trade and growth in international air passenger traffic.
During the 1970s, transport accounted for around one-third of all services traded globally. Over the past few decades, transportation costs have declined and there has been strong growth in other services trade. As a result, the share of transport in global services trade has declined to be below 20 per cent. However, despite the share declining, transport services have been vital for the development of global value chains, and are a key input in goods trade (Loungani et al 2017).
Business services
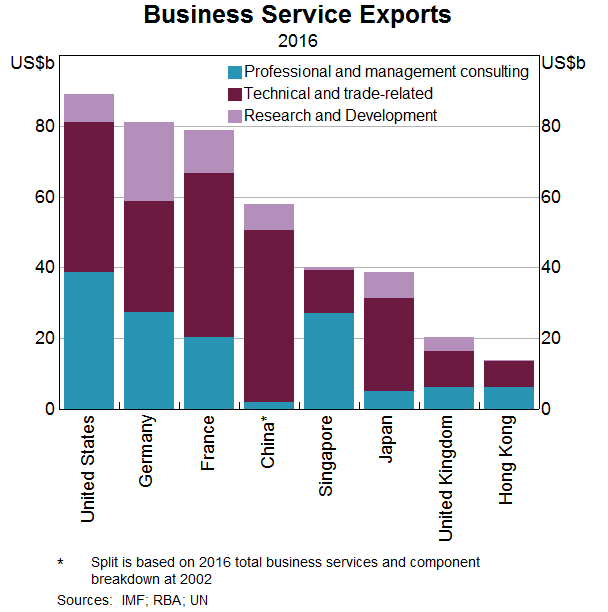
The rise of multinational firms and outsourcing has led to a considerable increase in business service exports over the past few decades. International trade in business services covers a wide array of commercial activities, including technical and trade-related services (such as engineering, leasing and merchanting services); professional and management consulting services (such as legal, accounting, advertising and management consulting services); and research and development (R&D) services (which includes the initial purchase or development of intellectual property).[3] R&D does not include charges for using intellectual property, which are a separate category of service exports discussed below.
Globally, technical and trade-related services are the most traded business services, but this varies across economies (Graph 6). Trade in professional and management consulting services is significant for the United States, in part because the world's largest consulting and accounting firms are domiciled there. By contrast, in Japan, the majority of business service exports are technical and trade-related services, reflecting the prevalence of merchanting services in Japan (WTO 2015).[4] China's business service exports have been almost exclusively technical and trade-related, which is likely to reflect merchanting. In the euro area, technical and trade-related services are dominated by architectural, engineering and other technical services. Across advanced economies, R&D service exports are consistently smaller than the other two subcategories.
Financial and insurance services
Financial and insurance (F&I) services represent the third most traded service around the world, with financial services accounting for the vast bulk of these. Financial services are measured by transaction charges and margins, asset management fees and other intermediation charges. Insurance services are measured by the value of premiums paid to insurers net of any claims.[5] F&I services are exported by a relatively small group of economies that are large international financial and insurance centres: Singapore, Switzerland, the United Kingdom, the United States and the euro area (Graph 7). Imports of financial services are concentrated in the same group of economies because financial services are typically traded across large financial centres. Cross-border trade in F&I services began to grow rapidly from the 1990s and has increased from 4 per cent of all services trade in 1990 to around 12 per cent in 2017. This rapid growth is in large part due to financial deregulation, the opening of financial sectors to international competition, outsourcing of some financial services and growth in internationally active banks (WTO 2019). In the euro area, financial services trade has also benefited from much closer financial integration, such as the shared currency (Liebscher 2005). The onset of the GFC saw a considerable contraction in the trade of F&I services, as banks withdrew from foreign operations, and growth in this trade has not subsequently returned to the pre-GFC rates.
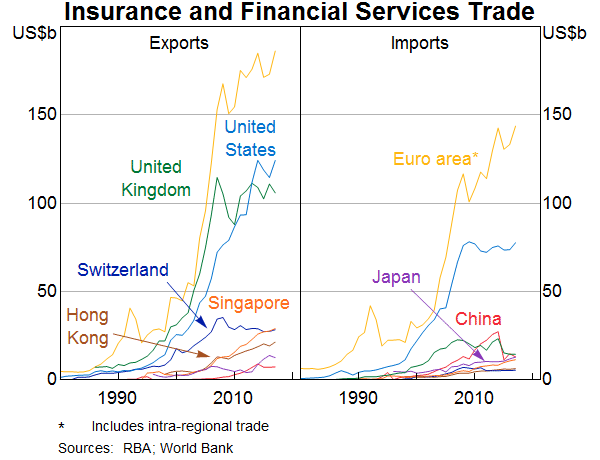
The United Kingdom is currently one of the largest exporters of financial services due to the role of London as a global financial services centre. The United Kingdom is the world's largest foreign exchange market and provides more cross-border bank lending than anywhere else. The size of the financial services sector is in part due to its access to continental European markets – around one-half of the United Kingdom's financial service exports are to the European Union. The size and nature of this trade in future may be influenced by how Brexit is resolved.
China's financial service exports are relatively small compared with the size of its economy. In part, this is because, over the past few decades, Hong Kong has acted as an entry point to financial markets and firms in China, and has also provided financial services to China (Leung et al 2008). However, China's financial services sector has grown strongly over the past decade due to the rising importance of the financial intermediation industry in the domestic economy and efforts to open financial markets to foreigners.
Information, telecommunications & computing
The fastest growing component of the global trade in services has been information, telecommunications & computing (ITC) services. These services have grown strongly because they are increasingly being used in the production of many other goods and services, in part driven by lower ITC costs. While the classifications of some of these services vary across economies, information technology, communication and contact centre services have all been key candidates for outsourcing. India and the Philippines are major service outsourcing destinations and have seen considerable increases in their service exports as a result.
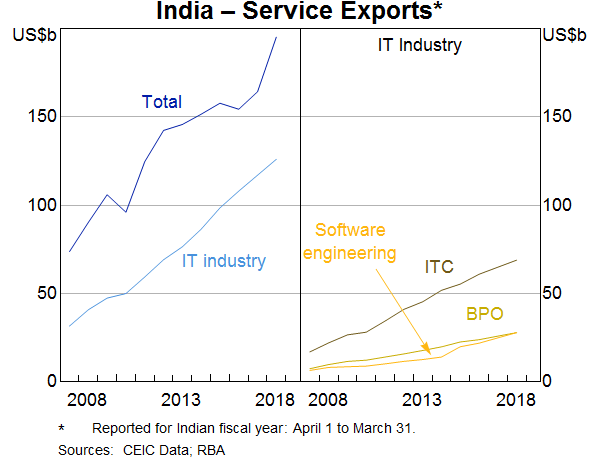
In India, the ITC sector is the largest and fastest growing sector in the economy, and is predominantly export oriented, accounting for almost one-third of total service exports (Hyvonen and Wang 2012). India's ITC exports also accounted for around 10 per cent of the world's ITC exports in 2017, exporting more than the United States and United Kingdom combined.[6] India has become a significant provider of Business Process Outsourcing (BPO) – which can include back-office functions like finance and accounting, and front-office functions like call centres. Together with software engineering, ITC and BPO services form the broader Indian IT industry, which accounts for the majority of service exports (Graph 8).
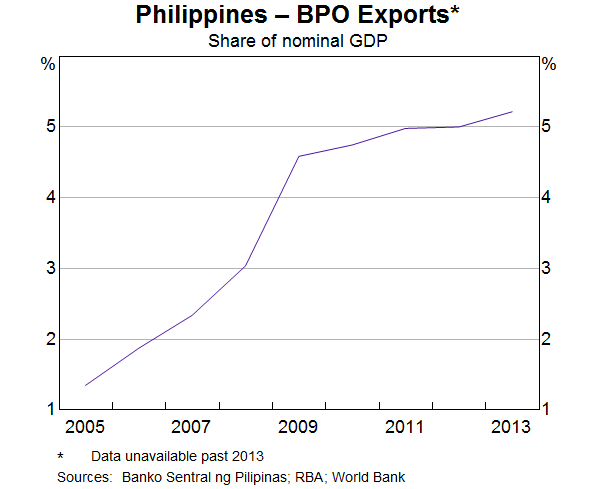
Since the early 2000s, the Philippines has also become a key destination for BPO. The Philippines BPO industry is export focussed; around 90 per cent of revenues are derived from exports. The outsourcing of these services to the Philippines has been driven by a lower cost of labour and a young workforce with relatively good English language skills (Mitra 2013). BPO exports grew by 36 per cent annually between 2004 and 2013, rapidly increasing service exports from the Philippines. As a result, the share of BPO exports in GDP rose from around 1 per cent in 2005 to more than 5 per cent in 2013 (Graph 9).
Intellectual property
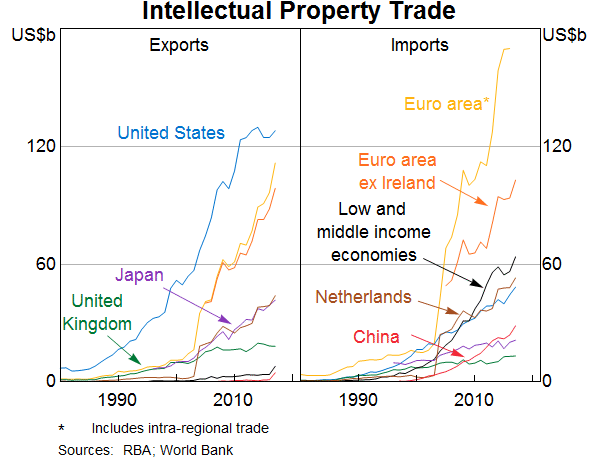
Trade in intellectual property (IP) occurs when businesses use IP that is owned in another country and includes charges for the use of patents, trademarks, copyrights, franchises and trade secrets. The majority of global IP trade consists of intra-firm transactions – such as payments between a subsidiary and a firm's headquarters. In the United States, two-thirds of IP exports are intra-firm (Neubig and Wunsch-Vincent 2017). IP is often imported by economies where manufacturing has been outsourced from another country and exports of IP typically originate from the world's more advanced economies: the euro area, Japan, the United States and the United Kingdom.[7] These economies are much larger exporters than importers of IP, because technology and ‘know-how’ on a net basis is transferred to lower and middle-income economies (Graph 10). The euro area is an exception, although a large part of their IP imports reflects businesses relocating to Ireland for tax and legal reasons.
Services and Value Chains
The services sector is an important link in global value chains and the role of services in global trade is larger than that suggested by gross trade values. While some services are exported directly, others are used as inputs to the production of goods exports – such as engineering services embodied in manufacturing exports. On a ‘value-added’ basis, the share of services in global trade is far higher (Graph 11).
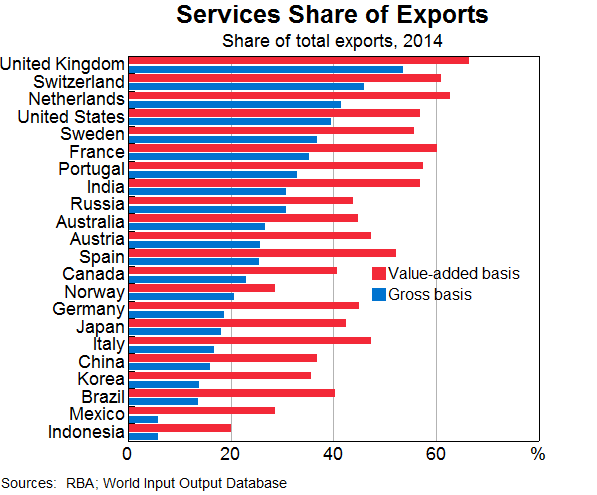
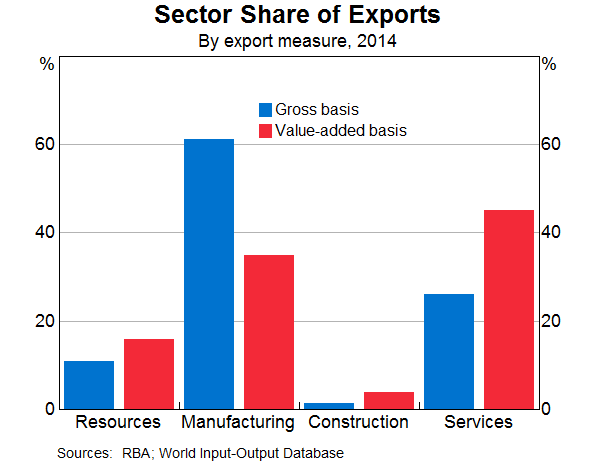
On average, services comprise one-quarter of gross exports but in value-added terms services account for almost half of all exports. There is large variation across economies, but invariably the services value-added share in exports is significantly larger than on a gross basis. Globally, the higher services share of trade when measured on a value-added basis is broadly matched by a correspondingly lower manufacturing share because these services are embodied in manufactured goods exports (Graph 12). Manufactured goods are also over-represented in gross trade because of their prevalence in global value chains.
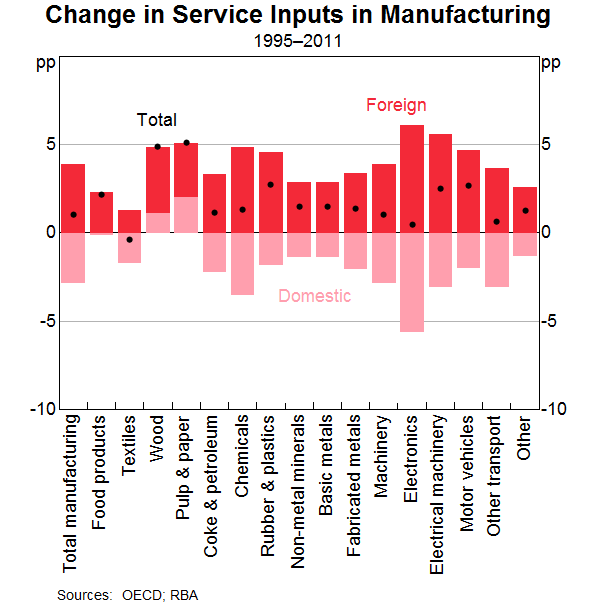
All industries use services to some extent as inputs into production. The value of services used as inputs in the manufacturing sector have not changed much over the 1990s and 2000s, but the origin of those services has. The use of domestic inputs has declined across most industries while the use of imported services has increased (Graph 13).
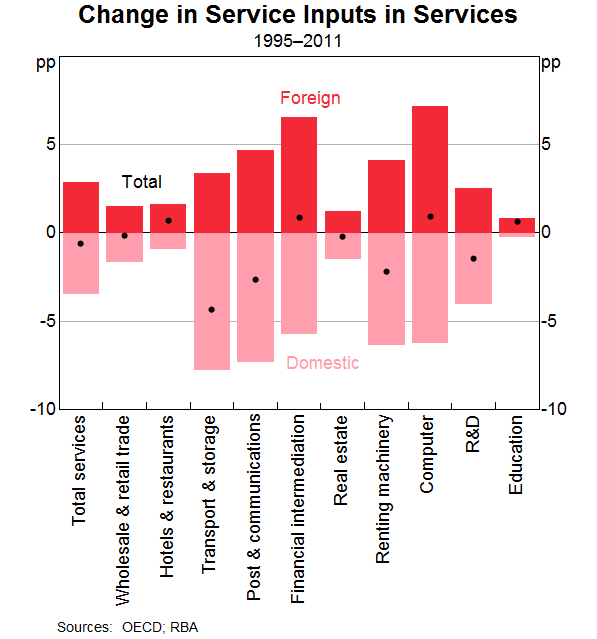
As with the manufacturing industry, the services industry itself has increased the use of imported services as inputs, displacing the use of domestic service inputs (Graph 14). This is particularly the case for economies that specialise in financial services, as they are produced in hubs connected to other financial centres that provide some of the service inputs, and computer services (Venzin 2009).
Australia's Experience
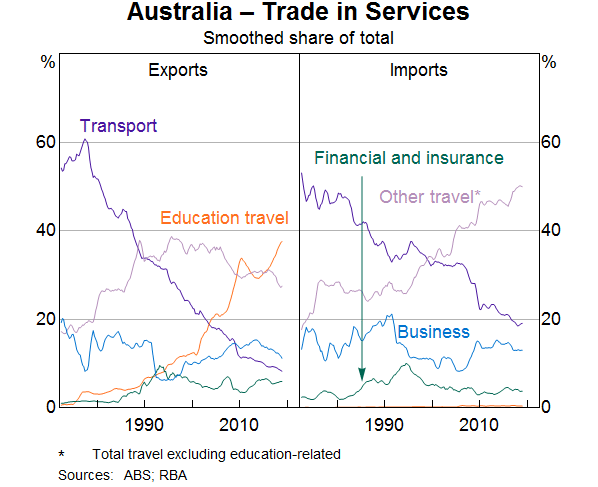
Australia's trade in services has changed considerably over the past couple of decades (Graph 15). Service exports from Australia have increased from around 15 per cent of total exports in the 1970s to more than 20 per cent in 2018. Education-related exports and tourism are now Australia's third (behind iron ore and coal) and fifth (behind natural gas) largest exports respectively. In line with global trends, the transport share of services trade has declined steadily since the 1970s and now makes up around one-quarter of services trade.
In contrast to other advanced economies, travel has increased as a share of services trade for Australia. On the export side, this has been driven by growth in education and on the import side, by outbound tourism. The rapid increase in education travel exports can be attributed to changes in Australia's migration policy, student visa access and rising demand for education from China and India (Hooper and Dobson 2015). Rapidly rising income in China has increased Chinese demand for education; one-third of Australia's education exports are to China, compared with 7 per cent in 2000. Education exports to emerging South-East Asian economies have also increased rapidly; education exports to these economies are greater than those to India and around half those to China (Alston et al 2018). Most spending in Australia of those who have travelled here for education purposes is on accommodation, retail and restaurants, and has also increased over recent decades.
Outbound travel continues to grow quickly and is a large and growing share of total service imports ─ much higher than in most advanced economies. Previous studies have found that rising incomes and increasing migration have had a positive impact on outbound travel.
Australia has not seen the same rising share of modern service exports, such as ITC and financial services, as most other advanced economies, and does not have a substantial share of trade in professional services, financial services or IP.
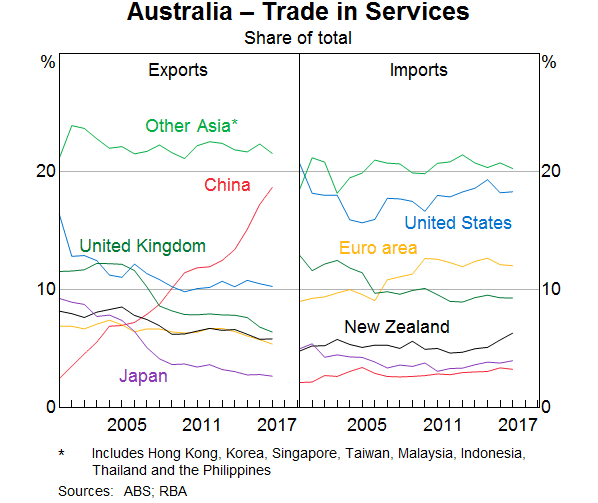
China became the largest single export destination for Australian services in 2010 and the share of services provided to China has continued to increase since, driven by education exports (Graph 16). With this shift to China, the share of services provided to the major advanced economies has declined, although exports to other parts of Asia (excluding China and Japan) remain sizeable. By contrast, the source of Australia's service imports have been stable and are dominated by the major advanced economies and the economies in Asia that are often tourism destinations.
Conclusion
Services are becoming increasingly traded. Advanced economies account for the majority of service exports, and are typically net providers of services to emerging economies. However, exports from emerging economies have been growing quickly, driven by China and India. Trade in traditional services has continued to grow strongly, supported by goods trade – facilitated by falling costs and advancements in transportation – and demand for overseas travel and education. Technological improvements have led to the increased tradability of more modern services, such as intellectual property, professional and financial services, which have grown quickly over the past few decades. In Australia, the bulk of service exports are traditional services, such as tourism and education, and they mostly go to the Asian region. Rising incomes in emerging economies should continue to provide opportunities for Australia's services sector.
Footnotes
The author is from the Economic Analysis Department [*]
Global value chains refer to production processes in which different stages of production occur in different countries, with trade occurring each time the partially finished goods are shipped to the next production location. [1]
Merchanting occurs when a resident (merchant) buys a good from a non-resident and then re-sells the good to another non-resident. Merchanting services are measured as the gains from this trade. [2]
Tax differentials create incentives for multinationals to shift activities such as balance sheets and intellectual property across borders. This activity ‘creates’ trade in services that is not contributing to economic activity. The experience in Ireland since 2015 is an example of this. See Conefrey (2018) for more detail. [3]
For example, it is common for Japanese merchants to purchase oil from the Middle East and subsequently re-sell this to non-residents without the oil ever entering Japan. Japan also has considerable transactions in non-monetary gold. In 2003, gross transactions of non-monetary gold that did not cross borders amounted to about 7 trillion Japanese yen. [4]
The value of insurance exports from a particular economy may fluctuate considerably due to large claim events, such as those following large natural disasters, because the insurance premium collected in that year is less than the claims made on the insurer. [5]
India's share of ITC exports is likely to be larger than 10 per cent because the euro area's measured ITC exports include considerable ITC service exports from Ireland, which reflect technology firms moving their balance sheets across borders rather than genuine economic activity (see footnote 2). [6]
These exports are typically factory techniques or industrial processes due to companies shifting manufacturing facilities overseas. See Neubig and Wunsch-Vincent (2017) and Yamaguchi (2004) for more detail. [7]
References
Alston M, I Arsov, M Bunny and P Rickards (2018), ‘Developments in Emerging South-East Asia’, RBA Bulletin, December.
Baldwin R and A Venables (2010), ‘Spiders and snakes: offshoring and agglomeration in the global economy’, NBER Working Paper 16611.
Conefrey T (2018), ‘Box B: Revisions to CSO National Accounts and Balance of Payments Statistics’, Central Bank of Ireland Quarterly Bulletin.
De Backer K and S Miroudot (2013), ‘Mapping Global Value Chains’, OECD Trade Policy Papers, No 159, OECD Publishing, Paris.
Heuser C and A Mattoo (2017), ‘Services trade and global value chains (English)’, Policy Research Working Paper no. WPS 8126. Washington, D.C.: World Bank Group.
Hooper K and C Dobson (2015), ‘Insights from the Australian Tourism Industry’, RBA Bulletin, March, pp 21–32.
Hyvonen M and H Wang (2012), ‘India's Services Exports’, RBA Bulletin, December, pp 33–38.
IMF (International Monetary Fund) (2001), ‘Issues Brief’, Global Trade Liberalization and the Developing Countries, November. Available at <https://www.imf.org/external/np/exr/ib/2001/110801.htm>.
IMF (2018), ‘World Economic Outlook, April 2018: Cyclical Upswing, Structural Change’, Washington DC, April.
Jones RW and H Kierzkowski (2001a), ‘Globalization and the Consequences of International Fragmentation’, in R Dornbusch, G Calvo and M Obstfeld (eds), Money, Factor Mobility and Trade: The Festschrift in Honour of Robert A Mudell, Cambridge, MA: MIT Press.
Jones RW and H Kierzkowski (2001b), ‘A Framework for Fragmentation’, in S Arndt and H Kierzkowski (eds), Fragmentation: New Production Patters in the World Economy, Oxford University Press, Oxford.
Kelly G and G La Cava (2014), ‘International Trade Costs, Global Supply Chains and Value-added Trade in Australia’, RBA Research Discussion Paper No 2014-07.
Kurachi Y, M Ando and K Shoji (2015), ‘Changes in the Environment Surrounding Japan's Exports: An Approach Focusing on Global Trade Volume and Export Share’, Bank of Japan Review 2015-E-5.
Leung F, K Chow, J Szeto and D Tam (2008), ‘Service exports: The next engine of growth for Hong Kong?’ Hong Kong Monetary Authority Quarterly Bulletin, June.
Liebscher K (2005), ‘Financial deregulation in the EU – chances and challenges for financial stability’, Speech to the 5th Annual CSI Conference – “New Agenda of the WTO: Challenge and Contribution of the European Union”, Innsbruck, 18 November. Available at <https://www.bis.org/review/r051124a.pdf>.
Loungani P, S Mishra, C Papageogiou and K Wang (2017), ‘World Trade in Services: Evidence from a New Dataset’, IMF Working Paper 17/77.
Ma J and I Roberts (2018), ‘Economic Trends in India’, RBA Bulletin, June.
Miroudot S and C Cadestin (2017), ‘Services in Global Value Chains: From Inputs to Value-Creating Activities’, OECD Trade Policy Papers, No 197, OECD Publishing, Paris.
Mitra RM (2013), ‘The Information Technology and Business Process Outsourcing Industry: Diversity and Challenges in Asia’, ADB Economics Working Paper Series No 365.
Neubig TS and S Wunsch-Vincent (2017), ‘A missing link in the analysis of global value chains: cross-border flows of intangible assets, taxation and related measurement implications’, World Intellectual Property Organisation Economic Research Working Paper No 37.
PC (Productivity Commission) (2015), ‘Australia's International Tourism Industry’, Commission Research Paper, Canberra.
Sorsa P (1997), ‘The GATS Agreement on Financial Services: A Modest Start to Multilateral Liberalization’, IMF Working Paper 55.
The State Council of The People's Republic of China (2018), ‘China to further open up its service sector’, 23 May. Available at <http://english.gov.cn/premier/news/2018/05/23/content_281476158048860.htm>.
Venzin M (2009), Building an International Financial Services Firm: How Successful Firms Design and Execute Cross-Border Strategies, OUP Catalogue, Oxford University Press, No 9780199535200.
World Tourism Organisation (2018), ‘UNWTO Tourism Highlights: 2018 Edition’, UNWTO, Madrid, DOI: http://www2.unwto.org/publication/unwto-tourism-highlights-2018-edition.
WTO (World Trade Organisation) (2015), ‘International Trade Statistics’. Available at <https://www.wto.org/english/res_e/statis_e/its2015_e/its2015_e.pdf>.
WTO (2019), ‘Developments in the sector’ Trade Topics, WTO.com site. Available at <https://www.wto.org/english/tratop_e/serv_e/finance_e/finance_devel_e.htm>.
Yamaguchi E (2004), ‘Recent Characteristics of Royalties and Licenese Fees in Japan's Balance of Payments’, Bank of Japan Working Paper Series No 04-E-5.