RBA Annual Conference – 2015 Firm Dynamics and Public Policy: Evidence from OECD Countries Dan Andrews, Chiara Criscuolo, Peter Gal and Carlo Menon
1. Introduction
Cross-country differences in GDP per capita mainly reflect large and persistent differences in labour productivity. At the same time, boosting labour productivity growth is an urgent policy priority, especially in countries where declining working-age populations pose a major headwind to future improvements in living standards. However, productivity growth has slowed in many Organisation for Economic Co-operation and Development (OECD) economies over the past decade, including Australia. This slowdown in productivity growth raises important questions about the structural and policy factors that shape productivity performance.
Cross-country differences in aggregate-level productivity outcomes are increasingly being linked to the widespread within-sector heterogeneity in firm performance (Hsieh and Klenow 2009; Bartelsman, Haltiwanger and Scarpetta 2013). The distribution of firm productivity is typically not clustered around the mean (as would be the case with a normal distribution), but is instead characterised by many below-average performers and a smaller number of star performers. Moreover, the degree of heterogeneity is striking: even within narrowly defined industries in the United States, firms at the 90th percentile of the total factor productivity distribution are twice as productive as firms at the 10th percentile (Syverson 2004).[1] These findings suggest that the focus on average outcomes is misleading and, thus, research is increasingly focusing on the star performers, which disproportionately drive productivity and job growth (Haltiwanger, Jarmin and Miranda 2013; Criscuolo, Gal and Menon 2014b).
Given the tendency for highly productive firms to coexist with low productivity firms within narrowly defined sectors, the recent literature has focused on resource misallocation as a potential explanation for why some countries are more productive than others (Hsieh and Klenow 2009; Bartelsman et al 2013).
Accordingly, this paper reviews evidence from recent OECD research that links cross-country differences in aggregate productivity performance to the widespread within-sector heterogeneity in firm size and productivity. A number of key findings emerge, which carry important implications for public policy.
First, contrary to the widespread popular perception, not all small businesses are net job creators. Rather, estimates show that only young businesses – which are predominantly small – are the primary drivers of job creation.
Second, there are important differences across OECD countries in the age composition and post-entry growth patterns of small businesses. While these differences imply a greater degree of experimentation by entrants in some countries rather than others, they also reflect the ability of economies to channel resources to the most productive firms. Accordingly, we highlight important differences across OECD countries in the efficiency of resource allocation, as measured by the extent to which: (i) the most productive firms are also the largest (i.e. static allocative efficiency); and (ii) resources flow to innovative firms (i.e. dynamic allocative efficiency).
The paper proceeds as follows. Section 2 documents some stylised facts relating to young businesses and employment growth. These facts hold across countries, but the magnitudes of the phenomena differ. Accordingly, the section also explores the cross-country differences in employment dynamics and in the extent to which start-ups are able to grow. A key advance in the productivity and firm dynamics literature in recent years is the focus on how the distributions of firm productivity and firm size are related. Consequently, Section 3 presents recent estimates on the efficiency of resource allocation. These estimates indicate that some countries are more successful than others at channelling scarce resources to productive and innovative firms. Section 4 shows that these outcomes partly reflect cross-country differences in the policy environment.
Section 5 offers some concluding thoughts and draws policy implications. In particular, the facts presented in this paper caution against the use of size-contingent policies and highlight the importance of policies that facilitate the reallocation of scarce resources to innovative firms. In this regard, well-functioning product, labour and capital markets as well as efficient judicial systems and bankruptcy laws that do not overly penalise failure can raise the expected returns to innovative activity and, therefore, the amount of innovative activity. These benefits are partly realised through stronger competitive pressures and more efficient reallocation, which make it easier for successful firms to implement and commercialise new ideas and, by lowering the costs of failure, encourage firms to experiment with uncertain growth opportunities.
2. Cross-country Evidence on Business Dynamics
The dynamism of employment varies significantly across countries. Recent cross-country evidence suggests that these differences exist not only in terms of the entry and exit patterns of firms but also in terms of the size of firms at entry and their post-entry growth performance (Bartelsman, Scarpetta and Schivardi 2003; Calvino, Criscuolo and Menon 2015). For example, the size of entering and exiting firms tends to be smaller in the United States than in Europe and successful young firms tend to expand relatively more quickly in the United States than elsewhere (Bartelsman et al 2013). This is consistent with a more dynamic distribution of firm growth in the United States – where successful firms grow faster and unsuccessful firms shrink faster – than in Europe. Moreover, Europe has a higher share of slow-growing and stagnant firms relative to the United States (Bravo-Biosca, Criscuolo and Menon 2013). The levels and growth rates of firm productivity within industries also tend to be more dispersed in the United States than in Europe (Bartelsman, Haltiwanger and Scarpetta 2004). More recent evidence also points to important differences in productivity dispersion across countries within Europe (Altomonte 2010).
These differences between the United States and Europe appear to reflect a greater degree of experimentation and ‘learning by doing’ among entrants in the United States. The largest differences can be found in high technology and emerging sectors. In these sectors, the imperative for experimentation and intensity in the use of knowledge-based capital is likely to be greatest (Aghion et al 2008). Experimentation may be particularly important in a time of extensive technological change, when the success of new business models and applications may only become apparent through testing in the market. The gap in experimentation between the United States and Europe suggests that differences in institutional factors – which shape differences in the cost of reallocating resources – may explain the relative sluggishness of some European countries in capitalising on the information and communications technology revolution (Conway et al 2007; Bartelsman, Gautier and de Wind 2010) and realising the potential for growth embodied in knowledge-based capital.
Box A: DynEmp – A New OECD Project on Firm-level Dynamics
This paper uses data collected by the OECD for a database called DynEmp. The purpose of the DynEmp database is to collect cross-country evidence from countries' business registers in order to identify the sources of job creation and destruction across countries and over time. The project aims to quantify the extent to which firms that differ in terms of age, size and sector contribute to job creation and job destruction, and to see how firm entry, growth and exit shape employment dynamics across countries and over time. The resulting statistics also provide insights on the effect of the recent global financial crisis on business dynamics.
A first phase of the project (DynEmp Express) has collected non-confidential comparable statistics on employment, gross job creation and destruction by firm age, size and macro-sectors for 18 countries in its first phase: Austria, Belgium, Brazil, Canada, Finland, France, Hungary, Italy, Japan, Luxembourg, the Netherlands, New Zealand, Norway, Portugal, Spain, Sweden, the United Kingdom and the United States. The second phase of the project is ongoing. It aims to collect detailed data at the two-digit industry code level and follow cohorts of businesses over three, five and seven years.
Although efforts have been made to harmonise the data, limitations in cross-country comparability remain. Differences in the source data might persist, for example, in the minimum threshold above which a business is captured in the relevant country's business register or because mergers and acquisitions could be accounted for in only a few countries. Owing to methodological differences in constructing these indicators, DynEmp Express statistics may deviate from official statistics published by national statistical offices. For instance, firms that enter and exit the data in the same year, and those that are never seen to employ more than one employee, are excluded from DynEmp Express-based figures.
For further information, see Criscuolo, Gal and Menon (2014b, 2014c).
2.1 Firm age is a key characteristic
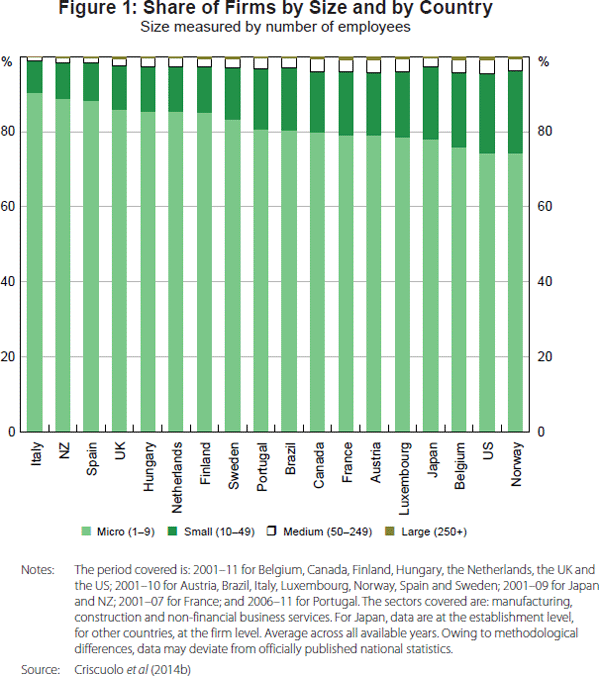
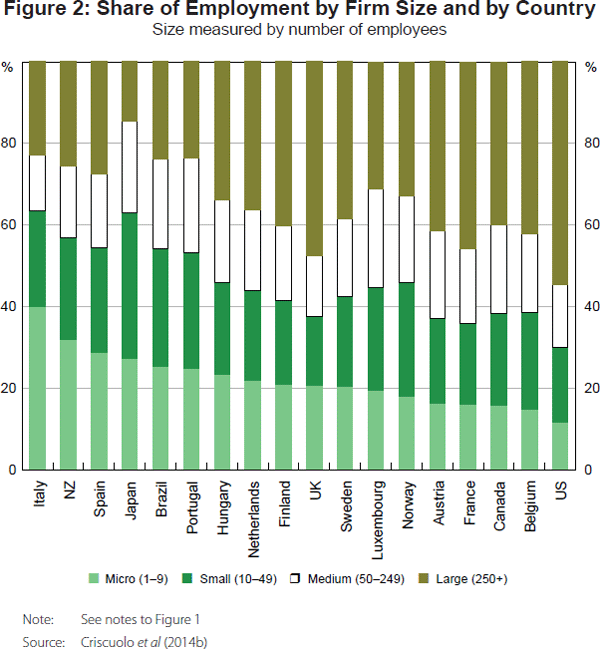
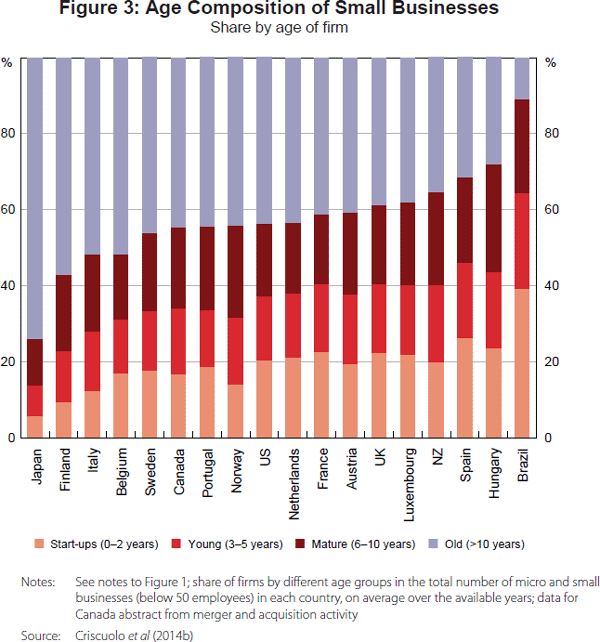
For the first time, new evidence from 18 OECD countries covering the period 2001–11 enables a closer look at the role of age – and not just size – in the growth dynamics of firms (see ‘Box A: DynEmp – A New OECD Project on Firm-level Dynamics’). This is particularly important because policies have generally focused on targeting small and medium-sized enterprises that typically represent a large proportion of economic activity. Firms with fewer than 50 employees account for more than 95 per cent of all businesses in an economy (Figure 1) and between 30 and 65 per cent of total employment (Figure 2). However, the age of small firms varies enormously, and the age distribution of small firms varies significantly across countries (Figure 3). The fact that in some economies (e.g. Italy) most firms are small and old might reflect a fundamental lack of dynamism in the economy. Conversely, the large proportion of small firms in Brazil reflects new entry, which is more typical of an emerging economy.
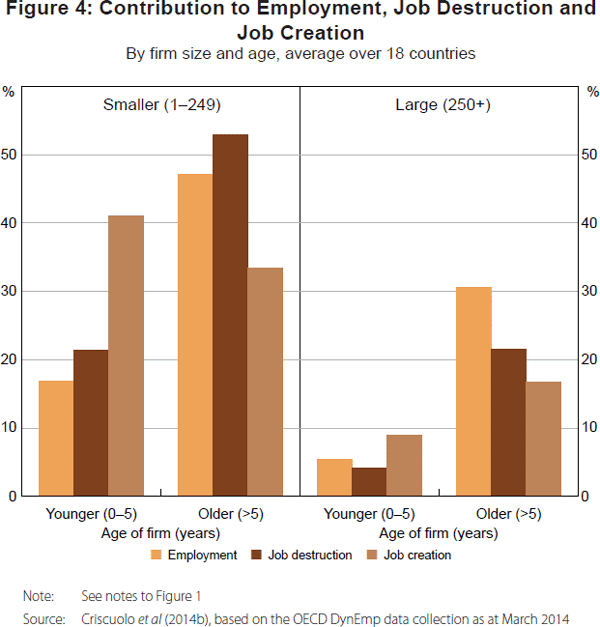
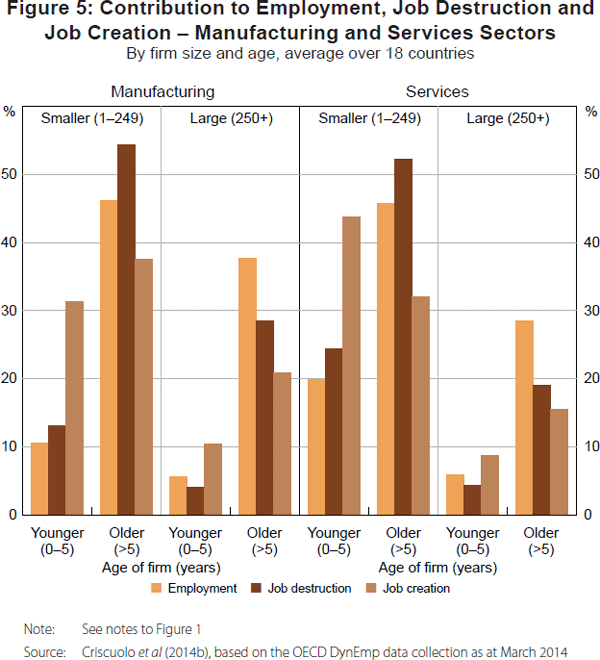
The cross-country aggregated micro data also show that, across all countries in the sample, young firms are more dynamic than old firms. Young firms systematically create more jobs than they destroy, independent of their size (Figure 4). In particular, young firms represent only around 20 per cent of total employment, but they account for almost 50 per cent of total job creation in the economy; their share in job destruction is around 25 per cent. These patterns also hold at the sector level (Figure 5). Smaller young firms account for almost 45 per cent of job creation in services and just over 30 per cent in manufacturing. Even during the global financial crisis, the majority of jobs destroyed in most countries reflected the downsizing of mature businesses, while net job growth in young firms (less than five years of age) remained positive.
Therefore, the age dimension is particularly important for the design of policy, especially for policies aimed at small firms.
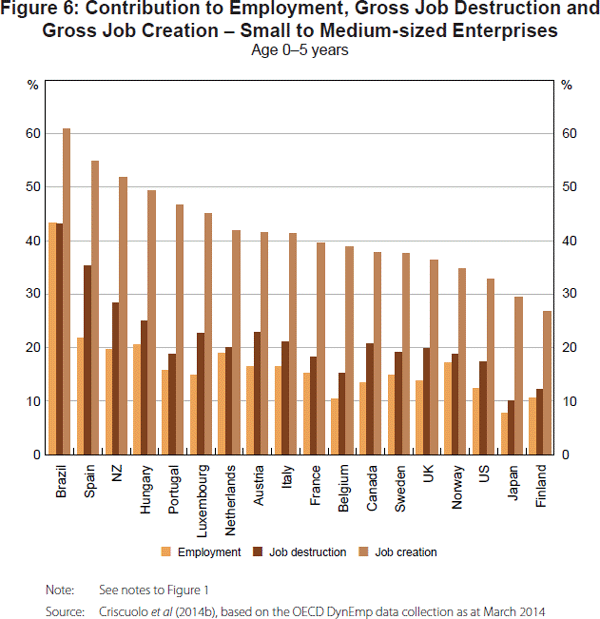
Differences in the magnitude of this phenomenon across countries point to the importance of national policies and business environments in fostering the birth and growth of new firms. In some countries – for example, Brazil, New Zealand and Spain – young firms account for more than half of the economy's total gross job creation; in others – such as Japan and Finland – young firms account for less than 30 per cent of jobs created (Figure 6).
2.2 The dynamics of micro start-ups
The contribution of young firms to aggregate employment growth reflects a process of creative destruction where success and failure go hand in hand. Young-firm dynamics are characteristed by a so-called ‘up or out’ pattern. A significant proportion of start-ups do not survive beyond the first two years; those that do survive contribute disproportionately to job creation.
Differences in the extent to which young firms grow are shown in Figure 7. We infer the potential growth of young firms by comparing the average size of start-ups with the average size of old businesses (greater than 10 years old). Figure 7 points to some differences in the size of start-ups across countries, although these are not striking. France, Finland and the Netherlands have the largest infant firms.[2] The picture is much more heterogeneous when examining the size of older businesses. The average size of old firms in the United States is by far the largest – around 75 employees in manufacturing and 40 in services. This is even more striking since the average size of start-ups in the French manufacturing sector is more than double the average size of US start-ups. This confirms the previous results of Bartelsman et al (2003), who found that seven-year-old US firms are on average 60 per cent larger than their size at entry; in European countries the figure ranged between 5 and 35 per cent. With the current data, the Netherlands has among the lowest ratios between the average size of old firms and start-ups of all countries, with a particularly low ratio of 1.7 for manufacturing firms. In the United States, this ratio is greater than 5 for both manufacturing and services firms.
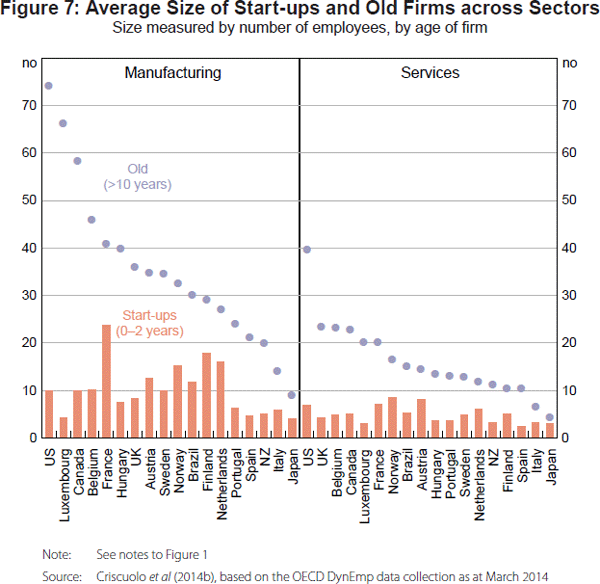
These findings suggest that in some countries there are lower entry barriers for new firms. Entrants can start off at a smaller size because it is less costly to experiment. Moreover, they can exit more easily if they are not successful. This, in turn, might contribute to stronger growth prospects for very productive and successful firms by freeing up scarce resources such as skilled labour. It also suggests that barriers to growth (e.g. access to markets, burdensome regulation on starting firms, and lack of competition) might hinder the growth potential of young firms in some countries.
To better understand the growth dynamics of start-ups, the OECD DynEmp database follows cohorts of entrants (firms aged 0 to 2 at the beginning of the period) with fewer than 10 employees for three, five and seven years (see Criscuolo, Gal and Menon (2014a)).
Figure 8 shows the importance of the ‘up-or-out’ dynamic in 17 countries as well as differences across them both in terms of number of firms and jobs involved. It shows the share (as a proportion of the total number of micro start-ups – that is, entrants with fewer than 10 employees) of firms that:
- are employing more than 10 employees after three years
- are still employing fewer than 10 employees after three years
- have become inactive within three years of opening.
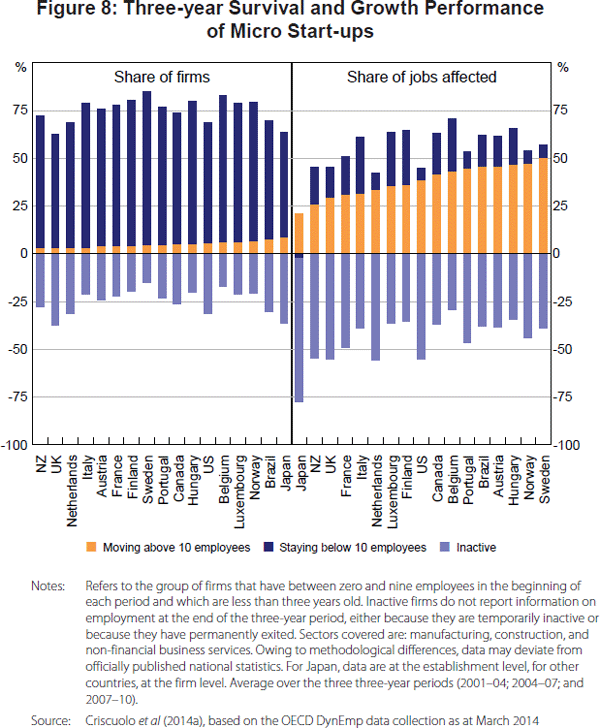
Figure 8 also shows the relative contribution to net job creation of each of these groups.
Three main features are worth noting:
- Very few micro start-ups – between 2 per cent and 9 per cent – grow above 10 employees, but their contribution to employment change ranges from around 20 to 50 per cent.
- Most firms remain within the same size class (i.e. they still employ fewer than 10 employees after three years) and while they still create a reasonable number of jobs, their contribution is less than proportional to their weight in terms of number of firms. For some cohorts and countries, these small start-ups actually contribute negatively to net job creation.
- The extent to which micro start-ups survive is very different across countries.
3. Cross-country Evidence on Resource Allocation
These aggregations from micro data point to important cross-country differences in business dynamics. An important difference is the extent to which some countries are more successful than others in channelling resources towards innovative and high-productivity firms – so-called allocative efficiency. Indeed, a key advance in the productivity and firm dynamics literature in recent years is to focus on how the distributions of firm productivity and firm size are related.
This section expands on this idea by using other recent OECD firm-level evidence, based on harmonised cross-country data, to examine how allocative efficiency varies across countries.
These differences in allocative efficiency may partly be due to structural differences between the economies – e.g. in the role of different sectors in the economy – but are also likely to reflect policies and institutional frameworks. We investigate the latter in Section 4.
3.1 Static allocative efficiency
According to Olley and Pakes (1996), at any point in time, differences in aggregate labour productivity will reflect:
- the productivity distribution of firms (i.e. the fraction of ‘better’ relative to ‘worse’ firms)
- the extent to which, all else equal, it is the more productive firms that command a larger share of industry value added (i.e. allocative efficiency), which will be the outcome of the shift in resources between firms in previous periods.
More formally, an index of productivity of industry j, defined as the weighted average of firm-level productivity (Pj = ∑i∈jθiPi), can be written as:
where:  =1/Nj∑i∈jPi
is the unweighted mean of firm productivity; θi is
a measure of the relative size of each firm (e.g. the employment share); and
 =1/ Nj
is the average share at the industry level. Hence, aggregate productivity (Pj)
can be decomposed into two terms: a moment of the firm productivity distribution
(the unweighted mean); and a joint moment of firm productivity and the firm
size distribution. This latter term reflects the extent to which firms with
higher efficiency also have a larger relative size. This is known as the ‘Olley-Pakes
covariance’ term and it measures static allocative efficiency.
Using this metric, Andrews and Cingano (2014) find that more productive firms are likely to account for a much larger share of manufacturing employment in the United States and some Nordic countries than in some other European countries (see Figure 9). In the United States, manufacturing sector labour productivity is 50 per cent higher due to the actual allocation of employment across firms, compared to a hypothetical situation where labour is randomly allocated across firms. By contrast, static allocative efficiency is negative in Poland, Greece and South Korea, which suggests that a random allocation of labour across firms would actually raise labour productivity in the manufacturing sector, relative to the actual allocation of labour. At the same time, the efficiency of resource allocation is much lower in the market services sector than in the manufacturing sector (Figure 9). This might be a symptom of naturally lower competitive pressure, because services are less trade-exposed than manufacturing. But it also provides a ‘smoking gun’ because we know that pro-competitive product market reforms have generally been less extensive in market services than in manufacturing in many OECD countries.

Moreover, an emerging literature links these sizeable differences in allocative efficiency across countries to policy distortions, which carry important consequences for aggregate performance. For example, estimates suggest that if China and India were able to align their efficiency of resource allocation to that observed in the United States, manufacturing total factor productivity could rise by 30–50 per cent in China and 40–60 per cent in India (Hsieh and Klenow 2009).
3.2 Dynamic allocative efficiency
While there are likely to be many reasons why some countries are more successful than others at channelling resources to the most productive firms, static allocative efficiency can only be achieved if there is dynamic allocative efficiency: that is, resources move towards more productive firms at the expense of less productive firms over time (Haltiwanger 2011).
Empirical evidence suggests that, over time, resources tend to be reallocated toward more productive activities. Most existing studies tend to focus on labour. For instance, while the leading cross-country study, based on data from the 1990s, finds that within-firm improvements in performance account for the majority of aggregate labour productivity growth over a five-year window, the contribution from firm entry and exit is estimated to reach at least 20 per cent in some OECD countries (the estimates are higher for emerging countries); in contrast, the contribution from reallocation of labour across existing enterprises is generally small, but positive (OECD 2003; Bartelsman et al 2004).[3]
Within-country studies show the importance of reallocation through entry, exit and market share gains by more productive firms via market selection. For example, Disney, Haskel and Heden (2003) show that for the United Kingdom this reallocation accounts for more than 80 per cent of aggregate total factor productivity growth in the manufacturing sector. Decompositions of labour productivity for the Canadian economy as a whole and the US retail sector yield similar conclusions.[4] There is also considerable heterogeneity across firms in their ability to use capital productively and existing studies show that capital – as measured by acquisitions of property, plant and equipment – also tends to flow from less productive firms to more productive firms (Jovanovic and Rousseau 2002; Eisfeldt and Rampini 2006).
Recent evidence from the United States suggests that resources flow towards firms that patent – one proxy for innovation – at the expense of non-patenting firms (Balasubramanian and Sivadasan 2011; Kogan et al 2012). A recent OECD study extends this approach to a range of OECD countries, and reveals important differences across countries in the extent to which capital and labour flow to innovative firms (Andrews, Criscuolo and Menon 2014). For example, a 10 per cent increase in the firm-level patent stock is associated with (Figure 10, top panel):
- about a 3 per cent rise in firm capital in Sweden and the United States
- a 1½–2 per cent increase in firm capital in the United Kingdom, Japan and Germany
- a ½–¾ per cent rise in firm capital in Italy.
Similarly, the ease with which patenting firms in the United States can attract labour is roughly twice as large as the average OECD country (Figure 10, bottom panel).[5]
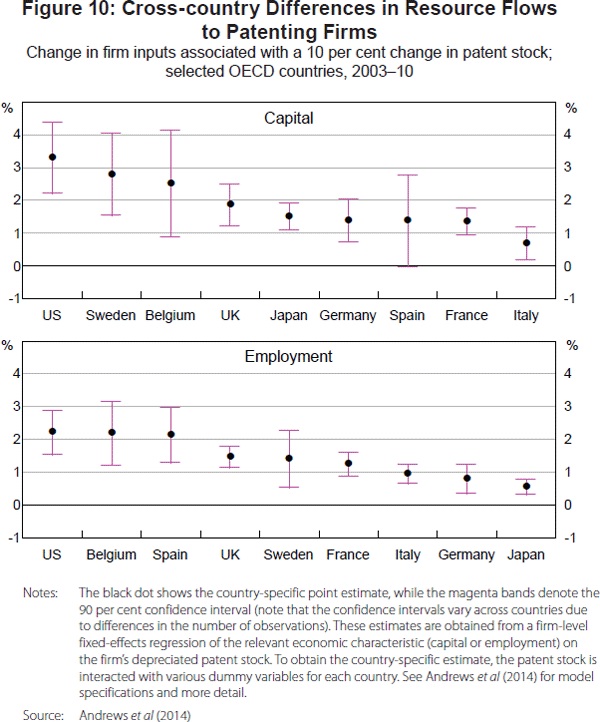
These patterns are significant because firms require a range of complementary tangible resources to test ideas (e.g. to develop prototypes and business models), develop marketing strategies and eventually produce at a commercially viable scale. They also bear some resemblance to cross-country differences in post-entry employment dynamics, which illustrate that young firms in the United States – and to a lesser extent, Sweden – exhibit ‘up or out’ dynamics, suggesting that market selection is very harsh and reallocation is significant in such environments (Haltiwanger et al 2013; Criscuolo et al 2014b). By contrast, the potential growth of firms in southern European countries – particularly Italy – is much lower, which tends to manifest itself in a high share of old and small firms, which tend to be less innovative.
4. Differences in Cross-country Resource Allocation: The Role of Public Policy
The working hypothesis in this paper is that these apparent differences in the efficiency of resource allocation are closely related to the design of public policies. Accordingly, this section reviews recent OECD evidence on the link between the efficiency of resource allocation and selected public policies.
4.1 Product market regulations
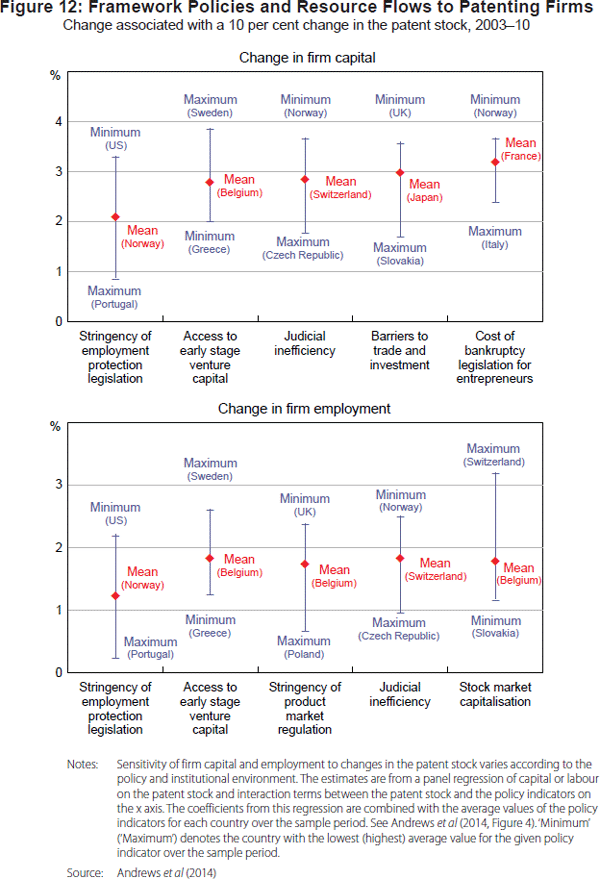
Across OECD countries, less stringent regulations affecting product markets tend to be associated with higher static allocative efficiency in manufacturing sectors and this relationship is confirmed by econometric analysis (Figure 11). This may reflect the tendency for such regulations to reduce firm entry, prolong the existence of inefficient firms in the market and raise the cost structure of inputs that are required by innovative firms to underpin their expansion. Product market regulations also influence innovation through the ability of successful firms to attract the complementary tangible resources that are required to implement and commercialise new ideas. Figure 12 shows how the estimated flow of resources to patenting firms – a concept introduced in Figure 10 – varies with different public policy settings, based on new OECD econometric modelling (Andrews et al 2014). For example, the estimates imply that the responsiveness of firm employment to increases in the patent stock would more than double if the stringency of product market regulation was reduced from the highest observed level (Poland) to the sample mean value (Belgium).
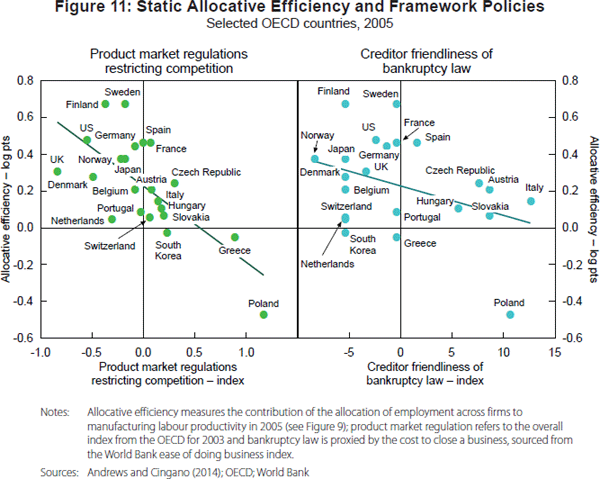
Reductions in barriers to trade and investment increase the ability of patenting firms to attract the capital required to implement and commercialise new ideas (Figure 12, top panel). All else equal, reducing barriers to trade and investment from the most stringent setting (Slovakia) to sample mean (Japan) is associated with a 70 per cent increase in the extent to which capital flows to patenting firms. Moreover, reforms to trade and investment policy improve the ability of national economies to leverage the benefits of innovation at the firm level through increases in market share of successful firms. Across service sectors in OECD countries, higher restrictions on foreign direct investment are associated with lower static allocative efficiency (Andrews and Cingano 2014).
4.2 Employment protection legislation
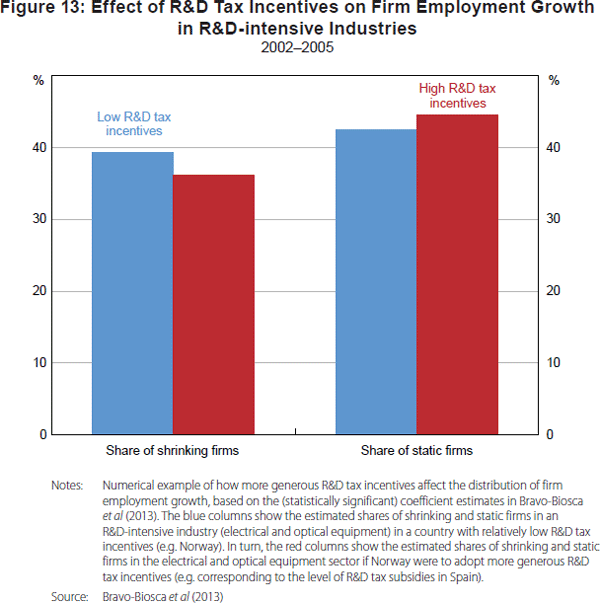
Employment protection legislation that imposes heavy or unpredictable costs on hiring and firing slows down the reallocation process. Moreover, by raising the costs of exit in case of business failure, stringent employment protection legislation makes it less attractive for firms to experiment with highly uncertain technologies. For example, in sectors with naturally higher reallocation needs – measured by job lay-off, firm turnover and information and communication technology intensity (e.g. electrical and optical equipment) – less stringent employment protection legislation disproportionately raises static allocative efficiency relative to other sectors (Andrews and Cingano 2014). Similarly, in more research and development (R&D)-intensive industries, less-stringent employment protection legislation raises productivity growth to the extent that it is associated with a more dynamic firm growth distribution – that is, a lower share of static firms and higher share of growing and shrinking firms (Bravo-Biosca et al 2013).
Consistent with these findings, less-stringent employment protection legislation significantly increases the ability of innovative firms to attract resources that are required to implement and commercialise new ideas (Figure 12). For example, a policy reform that reduced the stringency of employment protection legislation from the highest observed level (Portugal) to the mean level (Norway) is estimated to more than double the extent to which labour flows to patenting firms. Andrews et al (2014) also find that the burden of stringent employment protection legislation falls disproportionately on young firms, which is consistent with existing studies showing that stringent employment protection legislation reduces the scope for experimentation with uncertain technologies.
4.3 Bankruptcy legislation and judicial efficiency
Bankruptcy legislation that does not excessively penalise failure – as measured by a lower cost to close a business – can promote the flow of capital to more innovative firms (Figure 12, top panel), by reducing:
- the expectation of entrepreneurs that they will be heavily penalised in case of failure
- the likelihood that scarce resources are trapped in inefficient firms.
By contrast, if the cost of winding down a business is particularly high, risky entrepreneurial ventures might not be brought to the market to avoid incurring high exit costs in case of failure. Indeed, bankruptcy codes that more heavily penalise failure are negatively associated with multifactor productivity growth and the share of high growth firms in capital-intensive industries (Bravo-Biosca et al 2013). Finally, across OECD countries, less-stringent bankruptcy legislation is to some extent associated with higher static allocative efficiency (Figure 11, right panel), and this effect is particularly strong in sectors with naturally higher firm turnover rates, where regulations affecting exit costs are most likely to bind (Andrews and Cingano 2014).
The swift reallocation of resources from failed ventures will also be affected by the time required for the full completion of all legal procedures to wind up a business and the obstacles to the use of out-of-court arrangements. In extreme cases, these legal procedures might take years to complete, thus undermining effective reallocation and the accumulation of entrepreneurial capital. In fact, well-designed legal systems can support efficient resource allocation and raise the returns to innovation (Nunn 2007; Haltiwanger 2011). For example, in countries with more efficient judicial systems – proxied by a lower cost of enforcing contracts – labour flows more readily to patenting firms (Figure 12, bottom panel).[6]
4.4 Financial development and access to risk capital
Resource flows to patenting firms tend to be stronger in countries with more developed financial markets (Figure 12). This effect is particularly important for young firms (Andrews et al 2014). Thus, financial systems play an important role in helping credit-constrained firms implement and commercialise new ideas, in turn raising the returns to innovation. Similarly, resources flow more freely to young patenting firms in countries with more developed markets for seed and early stage venture capital (Figure 12). This suggests that seed and early stage venture capital plays an important role in ensuring the growth of young patenting firms and the development of radical innovations. For example, all else equal, increasing access to early stage venture capital from the lowest level (Greece) to the sample mean (Belgium) implies that capital flows to patenting firms would be around one-third higher than otherwise.
4.5 The unintended consequences of R&D fiscal incentives
R&D tax incentives – a non-discriminatory tool that aims to reduce firms' marginal costs of R&D activities – are present in most OECD countries and also in some non-OECD countries, such as Brazil, China, India and the Russian Federation. Support for business R&D through the tax system is typically combined with a broader set of direct support policies (e.g. grants, loans and loan guarantees) that are also intended to address market failures related to investment in innovation. While significant cross-country differences exist in the policy mix, there has recently been a general shift away from direct support toward more generous R&D tax incentives (Andrews and Criscuolo 2013).
OECD evidence suggests that R&D tax incentives have the unintended consequence of protecting incumbents to the detriment of potential entrants, thus slowing down the reallocation process (Bravo-Biosca et al 2013). Figure 13 shows that more generous R&D tax credits are associated with a more static distribution of firm growth in R&D intensive sectors – that is, a higher share of stagnant firms and a lower share of shrinking firms. This means that R&D tax incentives disproportionately benefit the slowest-growing incumbent firms.
This finding raises the possibility that R&D tax incentives may slow down the reallocation process if not designed properly. Indeed, one policy recommendation to follow from this research is that it is important that R&D tax incentives are refundable or contain carryover provisions. Including these features in R&D tax incentives would help avoid overly favouring less dynamic incumbents at the expense of dynamic young firms (Andrews and Criscuolo 2013). Many young innovative firms typically make losses in the early years of an R&D project and, thus, will not benefit from R&D tax incentives unless the incentives contain provisions for immediate cash refunds or allow such firms to carry associated losses forward to deduct against future tax burdens.
5. Discussion and Future Research
The evidence presented in this paper has pointed to the importance of accessing and using micro data for constructing the evidence base needed for policymaking. Often this requires:
- building a data infrastructure for allowing researchers to access the data
- additional data cleaning for creating panel data for research and policy analysis purposes from data sources whose use was only envisaged as cross-sectional, such as business registers
- using different classifications – for example ‘new’ firms as well as ‘small’ firms – to be able to calculate an internationally comparable set of statistics.
The OECD is working with the Australian Bureau of Statistics to create such a database to look at business dynamics with DynEmp and at the micro drivers of aggregate productivity using another similar OECD project called MultiProd.
Forthcoming research using the DynEmp and MultiProd databases intends to explore policy issues, particularly the policy drivers of post-entry firm growth. While the policy evidence presented in this paper relies on differences in regulations across countries, recent research is beginning to highlight the adverse consequences for aggregate productivity of regulations that vary in stringency depending on firm size. For example, Garicano, LeLarge and Van Reenan (2013) show that labour regulations in France – which become more stringent once a firm reaches a size of 50 employees – induce a bunching of firms just below the 50 employee threshold. This carries adverse consequences for allocative efficiency since these firms are relatively more productive than larger firms on the other side of the threshold. The welfare costs of this phenomenon are estimated to be around 4–5 per cent of GDP. Using the data collected from the second phase of the DynEmp project, combined with a newly collected database on size-contingent labour regulations (Calvino et al forthcoming), new research is exploring the effect of size-contingent policies on the firm size distribution across selected countries. This would also appear to be relevant for Australia, given that the stringency of labour regulations varies with firm size and there has been recent debate over whether a two-tier corporate tax rate that varies according to firm size should be introduced.
Footnotes
The same is true with respect to the firm size distribution, with many small firms coexisting with a smaller number of very large firms (Bartelsman et al 2013). [1]
These differences might be partly influenced by the intensity of mergers and acquisitions (M&A) activity across countries and whether the new businesses that result from M&A deals appear as ‘entrants’ in a country's business register. [2]
These estimates are likely to understate the contribution of reallocation since the direct contribution of net entry is reinforced by an indirect effect, whereby incumbents raise their own productivity to maintain market share in the face of strong entry pressures (Aghion, Fally and Scarpetta 2007). And, the contribution from reallocation – particularly net entry – tends to increase when the analysis is conducted over longer time horizons (Foster, Haltiwanger and Krizan 2001; Bartelsman et al 2004). [3]
Baldwin and Gu (2006) find that this reallocation accounts for about 70 per cent of aggregate labour productivity growth for Canada. Foster, Haltiwanger and Krizan (2006) find that entry and exit explain almost all labour productivity growth of the US retail sector. [4]
The low sensitivity of resources to patenting in countries such as Denmark, Finland and the Netherlands may reflect the fact that firms in small open economies may expand abroad rather than domestically. [5]
The cost of enforcing contracts is sourced from the World Bank and measures the court costs and legal fees as a per cent of the debt value. [6]
References
Aghion P, E Bartelsman, E Perotti and S Scarpetta (2008), ‘Barriers to Exit, Experimentation and Comparative Advantage’, Regional Comparative Advantage and Knowledge-Based Entrepreneurship (RICAFE 2) Working Paper No 056.
Aghion P, T Fally and S Scarpetta (2007), ‘Credit Constraints as a Barrier to the Entry and Post-Entry Growth of Firms: Theory and Evidence’, Economic Policy, 22(52), pp 731, 733–779.
Altomonte C (2010), ‘Micro-Founding “Europe 2020”’, Presentation at Bruegel Workshop ‘EU2020: Building Blocks for Europe's Growth and Employment Strategy’, Brussels, 11 January.
Andrews D and F Cingano (2014), ‘Public Policy and Resource Allocation: Evidence from Firms in OECD Countries’, Economic Policy, 29(78), pp 253, 255–296.
Andrews D and C Criscuolo (2013), ‘Knowledge-Based Capital, Innovation and Resource Allocation’, OECD Economics Department Working Papers No 1046.
Andrews D, C Criscuolo and C Menon (2014), ‘Do Resources Flow to Patenting Firms? Cross-Country Evidence from Firm Level Data’, OECD Economics Department Working Papers No 1127.
Balasubramanian N and J Sivadasan (2011), ‘What Happens When Firms Patent? New Evidence from U.S. Economic Census Data’, The Review of Economics and Statistics, 93(1), pp 126–146.
Baldwin JR and W Gu (2006), Competition, Firm Turnover and Productivity Growth, Economic Analysis (EA) Research Paper Series, Cat No 11F0027MIE — No 042, Statistics Canada, Ottawa.
Bartelsman E, PA Gautier and J de Wind (2010), ‘Employment Protection, Technology Choice, and Worker Allocation’, IZA Discussion Paper No 4895.
Bartelsman E, J Haltiwanger and S Scarpetta (2004), ‘Microeconomic Evidence of Creative Destruction in Industrial and Developing Countries’, IZA Discussion Paper No 1374.
Bartelsman E, J Haltiwanger and S Scarpetta (2013), ‘Cross-Country Differences in Productivity: The Role of Allocation and Selection’, The American Economic Review, 103(1), pp 305–334.
Bartelsman E, S Scarpetta and F Schivardi (2003), ‘Comparative Analysis of Firm Demographics and Survival: Micro-Level Evidence for the OECD Countries’, OECD Economics Department Working Papers No 348.
Bravo-Biosca A, C Criscuolo and C Menon (2013), ‘What Drives the Dynamics of Business Growth?’, OECD Science, Technology and Industry Policy Papers No 1.
Calvino F, C Criscuolo and C Menon (2015), ‘Cross-Country Evidence on Start-Up Dynamics’, OECD Science, Technology and Industry Working Papers No 2015/06.
Calvino F, C Criscuolo, C Menon and N Johnstone (forthcoming), ‘The Role of Size-Contingent Policies for Firm Size and Growth Distributions’, OECD Working Paper.
Conway P, D de Rosa, G Nicoletti and F Steiner, (2007), ‘Product Market Regulation and Productivity Convergence’, OECD Economic Studies, 2006(2), pp 39–76.
Criscuolo C, PN Gal and C Menon (2014a), ‘Do Micro Start-Ups Fuel Job Creation? Cross-Country Evidence from the DynEmp Express Database’, Unpublished manuscript, OECD.
Criscuolo C, PN Gal and C Menon (2014b), ‘The Dynamics of Employment Growth: New Evidence from 18 Countries’, OECD Science, Technology and Industry Policy Papers No 14.
Criscuolo C, PN Gal and C Menon (2014c), ‘DynEmp: A Stata® Routine for Distributed Micro-Data Analysis of Business Dynamics’, OECD Science, Technology and Industry Working Papers No 2014/02.
Disney R, J Haskel and Y Heden (2003), ‘Restructuring and Productivity Growth in UK Manufacturing’, The Economic Journal, 113(489), pp 666–694.
Eisfeldt AL and AA Rampini (2006), ‘Capital Reallocation and Liquidity’, Journal of Monetary Economics, 53(3), pp 369–399.
Foster L, J Haltiwanger, and CJ Krizan (2001), ‘Aggregate Productivity Growth: Lessons from Microeconomic Evidence’, in CR Hulten, ER Dean and MJ Harper (eds), New Developments in Productivity Analysis, NBER Studies in Income and Wealth, Vol 63, University of Chicago Press, Chicago, pp 303–363.
Foster L, J Haltiwanger and CJ Krizan (2006), ‘Market Selection, Reallocation, and Restructuring in the U.S. Retail Trade Sector in the 1990s’, The Review of Economics and Statistics, 88(4), pp 748–758.
Garicano L, C LeLarge and J Van Reenen (2013), ‘Firm Size Distortions and the Productivity Distribution: Evidence from France’, NBER Working Paper No 18841.
Haltiwanger J (2011), ‘Firm Dynamics and Economic Performance’, Paper presented at the Annual Bank Conference on Development Economics (ABCDE) ‘Broadening Opportunities for Development’, Paris, 30 May–1 June.
Haltiwanger J, RS Jarmin and J Miranda (2013), ‘Who Creates Jobs? Small Versus Large Versus Young’, The Review of Economics and Statistics, 95(2), pp 347–361.
Hsieh C-T and PJ Klenow (2009), ‘Misallocation and Manufacturing TFP in China and India’, The Quarterly Journal of Economics, 124(4), pp 1403–1448.
Jovanovic B and PL Rousseau (2002), ‘The Q-Theory of Mergers’, The American Economic Review, 92(2), pp 198–204.
Kogan L, D Papanikolaou, A Seru and N Stoffman (2012), ‘Technological Innovation, Resource Allocation, and Growth’, NBER Working Paper No 17769.
Nunn N (2007), ‘Relationship-Specificity, Incomplete Contracts, and the Pattern of Trade’, The Quarterly Journal of Economics, (122)2, pp 569–600.
OECD (Organisation for Economic Co-operation and Development) (2003), The Sources of Economic Growth in OECD Countries, OECD Publishing, Paris.
Olley GS and A Pakes (1996), ‘The Dynamics of Productivity in the Telecommunications Equipment Industry’, Econometrica, 64(6), pp 1263–1297.
Syverson C (2004), ‘Product Substitutability and Productivity Dispersion’, The Review of Economics and Statistics, 86(2), pp 534–550.
