Financial Stability Review – April 2018 3. The Australian Financial System
The Australian financial system remains resilient and its ability to withstand adverse shocks continues to be strengthened. Banks' capital ratios are well above current regulatory minimums, close to or above the Australian Prudential Regulation Authority's (APRA's) ‘unquestionably strong’ targets (which come into effect in 2020) and within the range identified as being sufficient to withstand most historical episodes of financial crisis globally. Banks' profit growth picked up over the past year and profits are sufficient to enable them to further increase their capital. Asset quality is very good overall, though mortgage loan arrears remain elevated in mining-related regions.
In February, APRA proposed revisions to the capital framework for authorised deposit-taking institutions (ADIs). These proposals underpin APRA's ‘unquestionably strong’ capital targets and incorporate modifications triggered by revisions to the international capital framework (known as ‘Basel III’). The proposed framework changes the capital needed for different portfolios without raising total capital requirements of the industry beyond those announced in mid 2017. In doing so, it aims to address the risks posed by the concentration of mortgages on banks' balance sheets by raising the amount of capital that must be used to fund these loans relative to others. APRA also proposes to make capital more risk-sensitive, including for the overall mortgage book by raising risk weights on interest-only (IO) and investor loans.
A central challenge facing banks is to address issues stemming from their culture. There have been various instances of misconduct, which are now being examined by the Royal Commission into Misconduct in the Banking, Superannuation and Financial Services Industry. The adverse implications of cultural issues and poor processes are starting to materialise in the form of customer refunds, higher costs to comply with inquiries and the setting aside of provisions for potential misconduct penalties. This has contributed to investors applying a higher risk premium to bank shares of late. Regulators and the banking industry have been taking steps to improve risk culture and address its consequences.
Residential mortgage lending by non-ADIs has accelerated over the past year, though their share of outstanding residential mortgages remains small and banks' exposures to the sector are limited. Their expansion has in part been in response to the increase in lending rates by ADIs for investor and IO loans, making non-ADI lenders more competitive for these loans. Favourable funding conditions in residential mortgage-backed security (RMBS) markets have also contributed.
The resilience of insurers has increased as profits have recovered and capital has been built up. General insurers' profitability has improved to around historically normal levels as they addressed earlier declines in commercial premiums and mitigated the impact of higher natural disaster claims through reinsurance.
Life insurers' profitability has stabilised and the sector has responded to ongoing structural issues by reducing risk through additional reinsurance and capital. There is yet to be a recovery in lenders' mortgage insurers' (LMI) profitability, given an ongoing decline in the volume of high loan-to-valuation (LVR) loans and rising claims in mining-related regions, but LMIs remain well capitalised. Risks to the superannuation sector are limited and financial market infrastructures have been working to increase their ability to withstand operational shocks.
Banks' Domestic Asset Performance
The performance of Australian banks' domestic assets continued to improve over the second half of 2017 (Graph 3.1). The share of non-performing assets declined, driven mostly by business loans while there was little change for housing loans.
Banks' housing non-performing loans (NPLs) are higher than historically but remain low. These are mostly well secured, with the proportion of impaired loans remaining steady. Conditions continue to vary across states with arrears in Western Australia higher than in the rest of Australia. In liaison with the Reserve Bank, banks indicated that they had become more optimistic about the outlook for Western Australia and do not expect a significant further deterioration in loan performance there. Some banks also noted an increase in arrears among some borrowers switching to principal & interest (P&I) loans at the expiry of the IO period of their loans. Partly, this was borrowers taking time to adjust to the higher required repayments (given they would then include principal) but most subsequently returned to meeting their payments in full. However, for a small share of borrowers higher arrears reflect difficulty making these higher repayments. Borrowers voluntarily switching before the IO period expiry – to take advantage of the lower interest rate on P&I loans – were meeting the higher repayments.
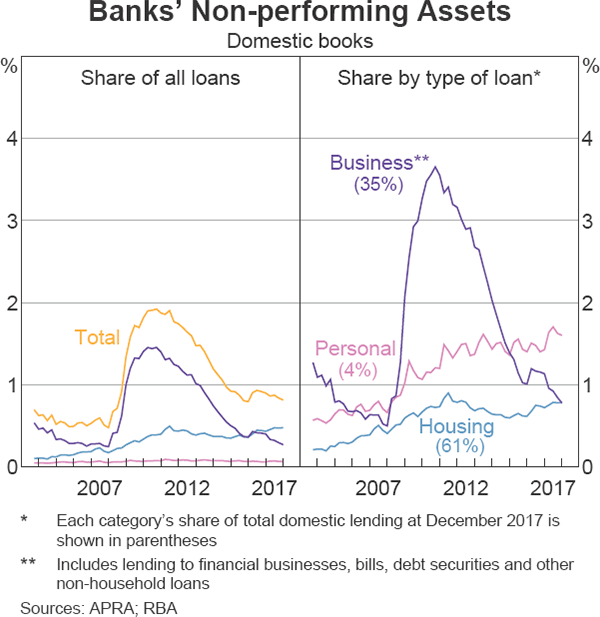
Personal lending remains a very small share of both total lending and household borrowing and so is currently not a risk to banks or the household sector in aggregate. The NPL rates of personal loans declined a little over the second half of 2017, although they remain high compared with their history. This recent improvement was driven by a decline in credit card NPLs. The share of other non-performing personal loans was steady over this period but remains close to its peak. The elevated share of non-performing personal loans mostly reflects the cyclical effects of economic conditions in mining-exposed states and structural changes as fewer older and higher-income borrowers take personal loans because they can typically more cheaply draw down on their accumulated excess mortgage payments. The latter has likely led to a change in the composition of personal credit towards borrowers who, on average, have lower creditworthiness (see ‘Box B: Recent Trends in Personal Credit’).
Credit Conditions
Total credit growth eased over the past six months (Graph 3.2). Housing credit growth edged lower with a marked slowing in the growth of credit to investors. Housing investor credit growth has remained below the 10 per cent benchmark first announced by APRA in late 2014, with the more recent restriction on IO lending and changed sentiment contributing.
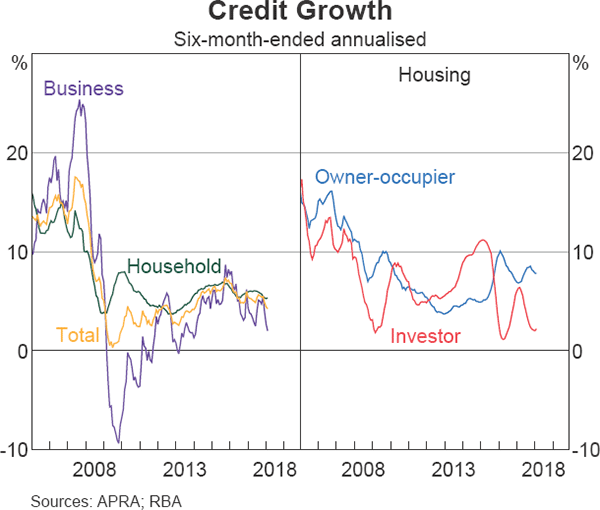
Business credit growth has eased in recent months, consistent with subdued merger and acquisition activity. The moderate growth in business credit over recent years has not materially constrained businesses' investment as most is financed with internal funds rather than debt. The major banks have continued to grow their property exposures to the retail segment while paring back exposures to residential development. Business lending by foreign-owned banks operating in Australia has continued to increase at a faster pace than lending by Australian-owned banks, driven primarily by banks with Asian headquarters. Asian banks now supply 12 per cent of total business credit in Australia, compared with 6 per cent in 2012, with this growth driven particularly by infrastructure and commercial property lending.
In the past, rapid expansion by foreign banks has exacerbated asset price and economic cycles by amplifying the credit supply cycle and prompting domestic banks to loosen lending criteria to retain market share. In the current upswing these risks appear to have been contained to date, due to the simultaneous tightening of lending standards in response to APRA's onsite review of commercial property lending in 2016 and a broader pullback by Australian-owned banks. However, given the role that this type of lending has played in previous periods of financial stress, both in Australia and abroad, it is important to remain vigilant about these risks.
International Exposures
Australian-owned banks have reduced their international lending as a share of total assets since 2015. The decline has been broad based across most countries and is expected to continue as ANZ completes the divestment of some Asian businesses this year. The notable exception over this time has been lending to New Zealand entities, mostly via the subsidiaries of the Australian-owned banks, which has increased faster than the banks' total assets. This lending is concentrated in residential mortgages, where risks are elevated (as discussed in ‘The Global Financial Environment’ chapter). The rising concentration of Australian banks' assets to both the New Zealand and Australian housing markets has seemingly reduced their diversification, given the historical correlation of these housing markets. However, this shift towards housing lending, which has historically generated higher risk-adjusted returns, has also supported their profits.
A longstanding feature of Australian banks is the scale of their offshore borrowing. Much of this offshore borrowing is in foreign currencies. Australian-located banks' net foreign currency liability position as at March 2017 was $238 billion, which was around 120 per cent of their total capital. However, the 2017 Survey of Foreign Currency Exposures showed that this position remains fully hedged by banks, suggesting they are resilient to the direct effects of a sudden depreciation of the Australian dollar.[1] More generally, global investors have historically been less likely to purchase bank debt outside their own country in stress episodes. However, Australian banks have reduced their use of short-term funding over the past decade and also now borrow from a more diverse range of countries. Some other factors also reduce banks' vulnerability to foreigners not rolling over funding. These include that past episodes of financial stress suggest the Australian dollar may well depreciate in this instance, which would both reduce the amount of foreign currency banks would need to raise and see them receiving collateral against their derivatives. Further, Australian banks largely use foreign currency borrowing to fund Australian dollar assets, meaning that if foreign funding were to retreat, alternative funding can be sourced domestically, including as a last resort from Reserve Bank open market operations.[2]
Liquidity and Funding
Australian banks also remain resilient to potential domestic liquidity shocks, with both their Liquidity Coverage Ratio (LCR) and Net Stable Funding Ratio (NSFR) well above the 100 per cent minimum requirements. The LCR measures banks' buffers of liquid assets against short periods of liquidity stress. The NSFR, which came into effect in January 2018, is intended to complement the LCR by encouraging banks to fund less liquid assets with more stable liabilities, such as long-term debt and retail deposits.
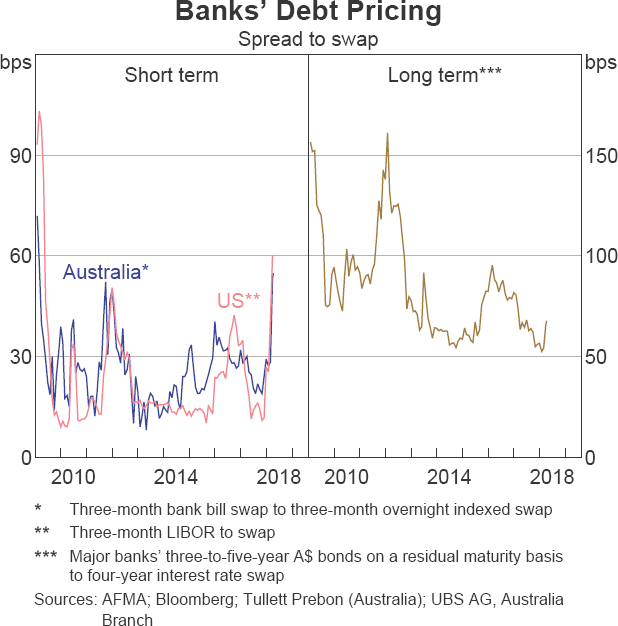
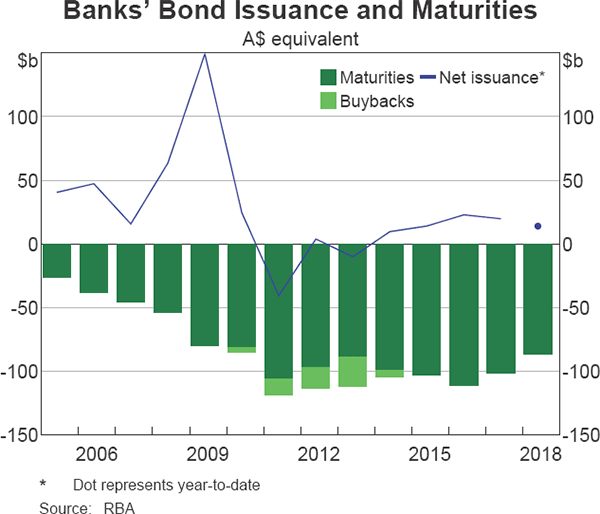
The composition of Australian banks' funding has been stable over the past year. This comes after a lengthy period of considerable changes to their liability mix as banks sought to increase their resilience to liquidity shocks, and meet the requirements of the LCR and NSFR, by increasing the share of deposit and longer-term debt financing. Conditions for issuing long-term bonds remain favourable, with spreads currently around their lowest level since before the financial crisis and net issuance remaining sizeable (Graph 3.3; Graph 3.4). This, coupled with slower growth in assets, has enabled banks to reduce the rates they pay on deposit funding. As a result, overall funding costs for Australian banks declined over the past year.[3] The value of bonds maturing in 2018 is somewhat less than in each of the past seven years, meaning banks are more resilient to any potential market volatility.
Some banks have also been lengthening the duration of their recent bond issues to better manage future refinancing and take advantage of low long-term rates.
In contrast, spreads on short-term debt have recently spiked to their highest level since 2009. In the past, this has typically been an indicator of market stress or a perception that the near-term credit risk of banks had risen. However, in this instance it appears instead to be due to changes in the demand for and supply of US money market instruments, given that spreads on long-term funding remain very narrow (for further details, see ‘The Global Financial Environment’ chapter). The rise in US short-term bank spreads has spilled over into Australia as domestic banks, who typically fund a significant share of their Australian activities in US markets, have sought to shift some of their funding back to domestic debt markets. (The exposure of banks and other financial institutions to higher interest rates is discussed in ‘Box C: Interest Rate Risk in the Australian Financial System’.)
Capital and Profits
Higher capital levels have increased the resilience of Australian banks to adverse shocks.
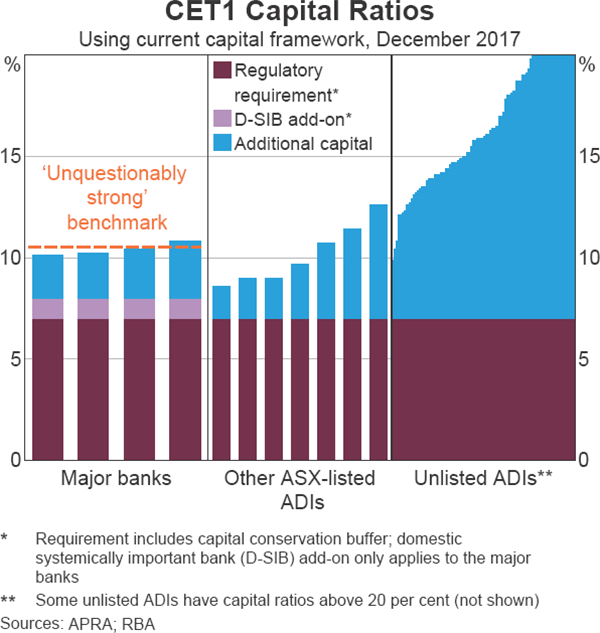
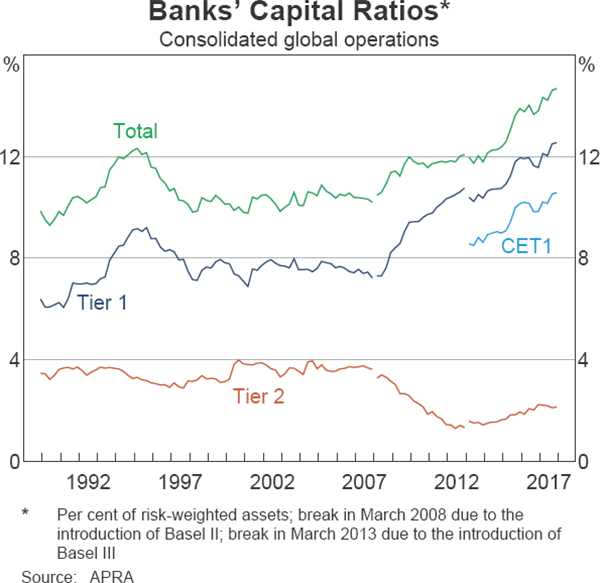
Capital ratios are well above current minimum requirements and for most ADIs are close to or above APRA's ‘unquestionably strong’ capital targets that apply from 2020 (Graph 3.5). Banks have continued to accumulate capital over recent years and now have Tier 1 capital ratios that are more than 50 per cent higher than before the financial crisis (Graph 3.6). This rise has been underpinned by higher retained earnings and slower risk-weighted asset growth, as Australian banks have pulled back from (capital-intensive) institutional lending. ANZ and CBA's recently announced divestments of parts of their wealth and overseas portfolios should further increase their capital ratios in the coming year. On an internationally comparable basis, the major banks have Common Equity Tier 1 (CET1) capital ratios of around 16 per cent. This places them in the top quartile of similar banks internationally and within the range that research has found would have been sufficient to withstand the majority of historical bank crises.[4]
In February, APRA released proposed revisions to the capital framework for ADIs.[5] These revisions underpin its ‘unquestionably strong’ capital targets that were announced in July 2017, which raise effective capital requirements by 150 basis points for ADIs using the internal ratings-based (IRB) approach to credit risk and by 50 basis points for ADIs using the standardised approach, all relative to the risk weights prevailing under the current framework. The proposed revisions also incorporate changes to the international Basel III standards that were finalised in December 2017 (see ‘Box E: Reforms to the Basel III Capital Framework’). APRA will consult on revised standards that incorporate all these changes.
The proposed framework changes the capital needed for different types of lending, under both the standardised and IRB approaches, without further raising the aggregate amount of capital required by the industry. One important aim in doing this was to address the risks posed by the concentration of mortgages on banks' balance sheets, which have increased in recent years to now account for more than 60 per cent of total loans. APRA is proposing to raise the minimum amount of capital that must be used to back residential mortgages, relative to other loans. In addition, APRA proposes to make risk weights on mortgages more sensitive to risk. Risk weights would distinguish between P&I mortgages to owner-occupiers and all other mortgages (which would require more capital), and risk weights for ADIs using the standardised approach would also be more sensitive to the outstanding LVR. Other notable revisions to credit risk would include materially raising risk weights on credit cards for IRB banks, simplifying the capital treatment of small and medium enterprise exposures, and allowing greater variation in the risk weights applied to commercial property exposures.
APRA also proposes to introduce a minimum leverage ratio requirement of 4 per cent for banks using the IRB approach and 3 per cent for ADIs using the standardised approach, effective from July 2019. APRA intends that the leverage ratio, which is a non-risk-adjusted ratio of Tier 1 capital to total exposures, will only be a backstop to the risk-based capital requirements. While APRA has set its requirement for IRB banks higher than the 3 per cent requirement in the Basel III framework, IRB banks' leverage ratios are already well above this new minimum (at 5 per cent or more). The overwhelming majority of other ADIs also already exceed their leverage ratio requirement.
Banks continue to generate sufficient aggregate profits to underpin their ability to further increase their capital. Profit growth picked up over the past year, after several years of no growth (Graph 3.7). The recent pick-up was due to a widening in net interest margins (NIMs) – as banks increased interest rates on IO and investor mortgages and funding costs declined – as well as a decline in the charge for bad and doubtful debts to historically low levels. Profit growth over the past year has supported an increase in banks' return on equity (ROE), which remains high relative to international peers but below its historical average.
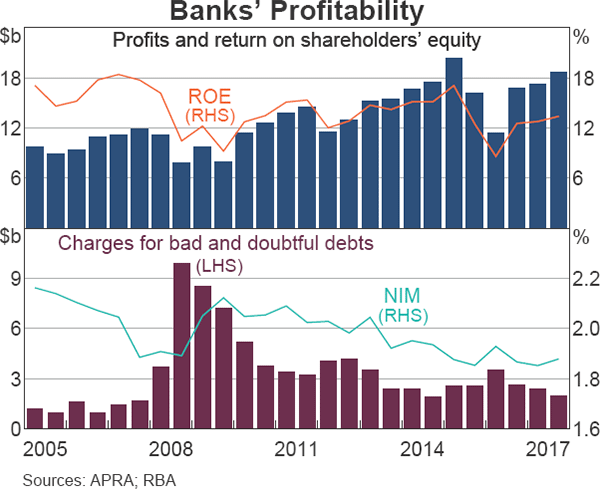
Despite the recent lift, analysts are cautious about the outlook for profit growth. The recent benefits to profit growth from a widening of the NIM and falling bad debt charges are expected to fade, especially if short-term wholesale spreads remain elevated. The financial impact of the multiple inquiries into the financial services sector remains a key uncertainty, including the Royal Commission into Misconduct in the Banking, Superannuation and Financial Services Industry, the Productivity Commission's Inquiry into Competition in Australia's Financial System, and the Australian Competition and Consumer Commission's Residential Mortgage Products Price Inquiry. There is the potential that these will result in banks having to set aside provisions and/or face penalties for past misconduct or perhaps (more notably) being constrained in the operation of parts of their businesses.
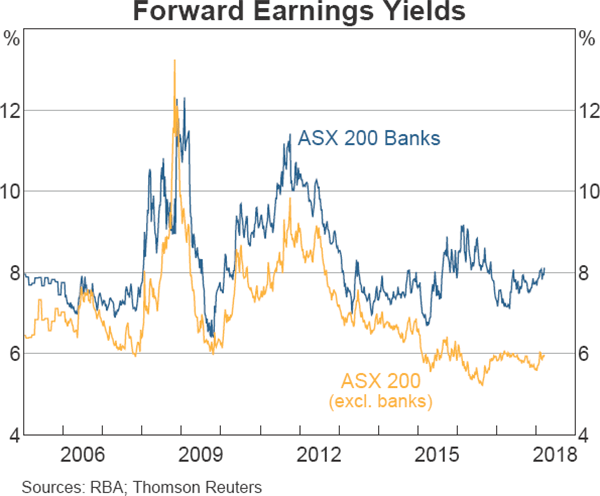
This uncertainty around banks' future earnings has weighed on their share prices, which have underperformed global peers (although Australian banks still have higher price-to-book ratios). The decline in share prices has also seen banks' forward earnings yields (a proxy for their cost of equity capital) further diverge from that of the rest of the Australian market since mid 2017 (Graph 3.8). Banks' current forward earnings yields remain a little above their pre-crisis average, despite a large decline in risk-free rates since then.
Bank Culture
Over the past few years there has been increasing regulatory focus on culture in financial institutions and the impact that culture might have on their operations. In Australia, there has been a significant number of examples of misconduct attributed to poor culture and some of the adverse implications of this are starting to materialise. In particular, CBA revealed increased compliance and regulatory costs relating to various inquiries. CBA also recorded a sizeable provision for potential civil penalties relating to the Australian Transaction Reports and Analysis Centre's (AUSTRAC's) proceedings against the bank. Australian banks are well capitalised, and available evidence indicates that the risks to banks' overall resilience from misconduct appear limited. However, international experience has shown that poor culture can have significant adverse effects on banks, including on their financial performance.
Regulators and the banking industry have been making efforts to contain the issues stemming from deficiencies in a strong positive culture. APRA's oversight in relation to banks' risk culture and accountability has been strengthened after legislation was recently passed implementing the Banking Executive Accountability Regime (BEAR). The BEAR gives APRA strengthened powers to seek civil penalties and disqualify bank executives for not taking reasonable steps to protect the prudential standing or prudential reputation of their institution. The BEAR also places restrictions on bank executives' variable pay arrangements to discourage excessive risk-taking. Complementing this, APRA recently reported on the extent to which performance-based remuneration structures encourage bank staff to behave in ways that support effective risk management and the long-term financial soundness of the organisation. In response to its findings, APRA suggested a number of ways in which banks can increase the sensitivity of performance pay to long-term risk management and some institutions have already begun to make appropriate changes. In 2017, APRA also commenced a cross-sector pilot program of risk culture reviews, which will further develop its practical knowledge and experience in evaluating risk culture as a driver and leading indicator of risk outcomes.
Shadow Banking Activity
The tighter prudential framework for the regulated banking system over recent years may induce lending activities to migrate to less regulated, non-ADI lenders. In aggregate, this risk is low for now, as the so-called ‘shadow banking sector’ is still only 6 per cent of the financial system (around half the share it was in 2007). Contagion risks are also limited as banks' exposures to the sector are only a few per cent of their financial assets.
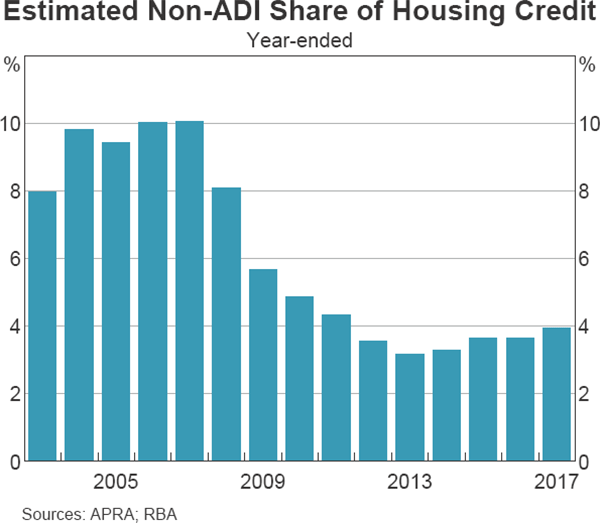
Property lending is one area that warrants particular attention in light of the tightening of lending standards at prudentially regulated entities. Estimated growth in residential mortgage lending by non-ADI lenders picked up materially over the past year and is now significantly higher than for banks. However, non-ADI lenders still account for only around 4 per cent of outstanding residential mortgages, and their contribution to overall housing credit growth remains limited (Graph 3.9).
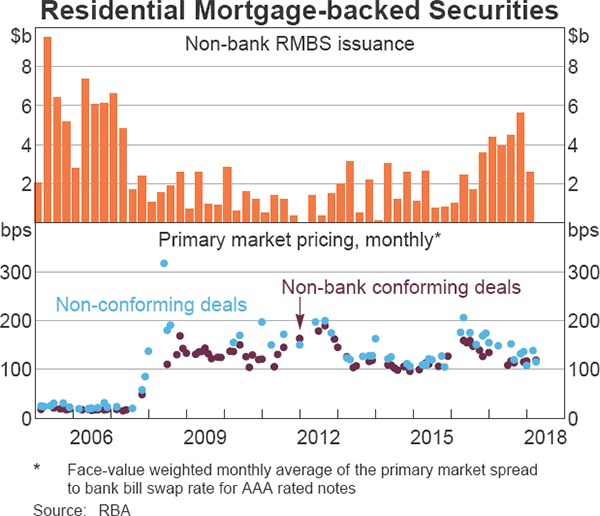
Non-ADI lenders' expansion in residential mortgage lending has been aided by developments in both mortgage and RMBS markets. In the mortgage market, ADIs have increased interest rates on investor and IO loans, enabling non-ADIs to price competitively to attract these loans. In addition, the cost of financing mortgages declined for non-ADIs over the past two years as spreads on non-bank RMBS – their main source of funding – have fallen (Graph 3.10). This supported non-bank RMBS issuance over 2017, which was higher than in any other year since the financial crisis. Nonetheless, RMBS spreads remain significantly higher than pre-crisis levels, meaning that the cost of funding for non-ADIs is still well above the cost of bank financing (deposits or senior unsecured bank debt). This continues to be a key constraint for non-ADIs to gain market share more rapidly than at present.
There are limited data on the scale of non-ADIs' lending for property development, but the Bank's liaison suggests that this has expanded quickly of late, particularly in Melbourne. Non-ADI development finance is reported to require lower levels of pre-sales and allow greater leverage. In recognition of these risks, investors are reported to demand higher premiums, which temper the direct risk to the financial stability of the banking system. In addition, when banks provide senior debt, there is a degree of regulatory oversight of the non-ADI mezzanine lending (which is still the most common form of development lending by non-banks).
Legislation recently passed will make it easier to monitor shadow banking activities by requiring larger non-ADI lenders to regularly disclose the scale of their financing activity to APRA. It also provides APRA with reserve powers to impose rules on non-ADIs if their activities are judged to pose a material risk to financial stability.
Insurance
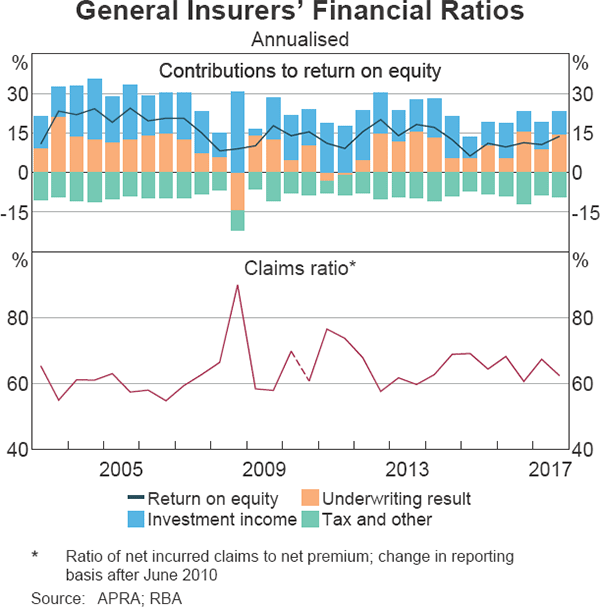
The resilience of the general insurance industry has strengthened a little over the past year. The industry remains well capitalised, with capital equivalent to 1.8 times APRA's prescribed amount, and profits have continued to improve gradually despite subdued investment income due to the low interest rate environment (Graph 3.11). The lift in profits resulted from a stronger underwriting performance as insurers increased premiums to correct a long period of underpricing in commercial insurance lines. Reserve releases due to lower-than-expected inflation also contributed to underwriting profitability. While natural disaster payouts were again higher than expected for insurers, reinsurance cover has mitigated the impact on profits to some degree.
The profits of LMIs remain under pressure, but the sector is well capitalised, at 1.6 times APRA's prescribed amount. Profits continue to decline due to both a decrease in revenue, as banks reduce high-LVR mortgage lending which is generally insured, and an increase in claims arising from Western Australia and Queensland. These headwinds seem likely to persist, given APRA's efforts to ensure prudent lending standards are expected to continue to limit the flow of new high-LVR loans.
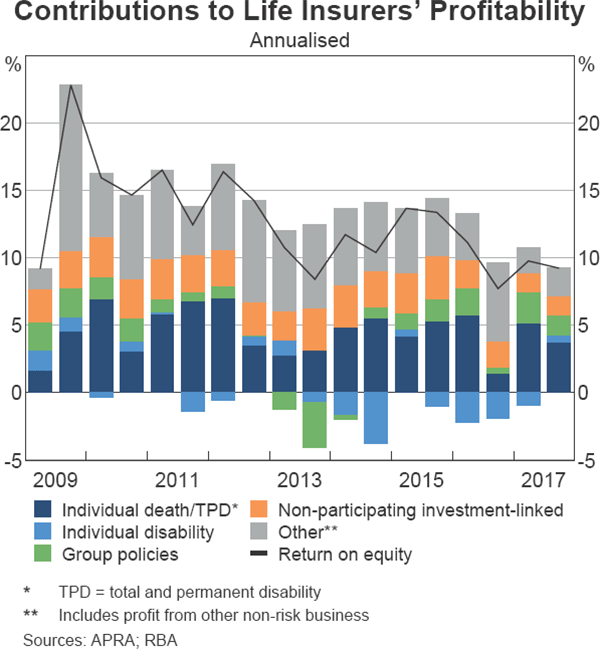
Life insurance profitability has stabilised as insurers have stemmed losses on individual disability insurance (commonly known as ‘income protection’) and investment returns have lifted (Graph 3.12). However, ROE remains low and structural issues persist, including historical underpricing, loose product definitions, overly generous product benefits and rising claims, especially for mental health. While insurers have taken some steps to address these issues, they will take time to resolve given the long-term nature of life insurance contracts. Given that, direct policy writers have responded by reducing risk, including through additional reinsurance and by increasing capital to 2.1 times APRA's prescribed amount. A number of Australian financial institutions have also exited the life insurance industry (or are considering doing so) by selling to large foreign insurers.
Superannuation
The superannuation sector is a large and growing part of Australia's financial system. Total assets amount to $2.6 trillion, accounting for three-quarters of the assets in the managed fund sector (a higher share than in other advanced economies) and equivalent to around two-thirds of the size of the Australian banking system. Total superannuation assets grew by 10 per cent in 2017, slightly higher than the post-crisis average rate. Growth was supported by strong investment returns and higher member contributions, particularly in advance of changes to the concessional and non-concessional contributions caps that took effect on 1 July 2017 (Graph 3.13).
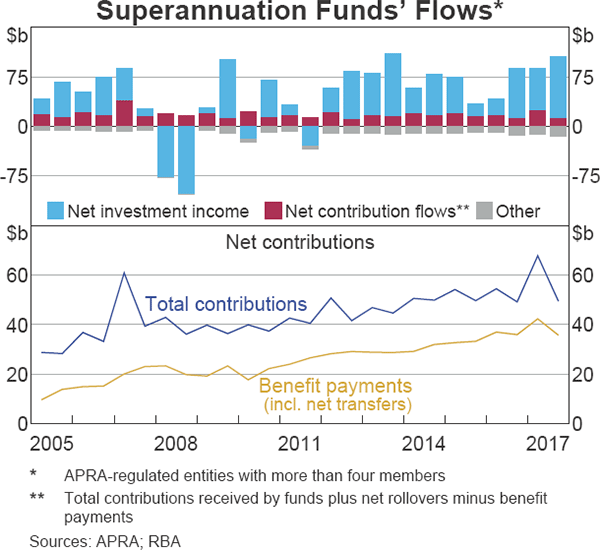
The financial stability risks inherent in the superannuation industry are lower than for other parts of the financial system because debt funding accounts for a very small share of its total liabilities (particularly for APRA-regulated funds, which are not generally permitted to borrow). The longer-term focus of the industry, compared with other investors, also reduces financial stability risks. However, its large size means it could still amplify financial market shocks if superannuation fund managers change their asset allocations and/or members switch between investment choices rapidly, or if superannuation funds were to seek to boost returns by investing significantly more in leveraged assets (such as property development).
Financial Market Infrastructures
Financial market infrastructures (FMIs) are institutions that facilitate the clearing, settlement or recording of payments, securities, derivatives or other financial transactions. Over recent years there has been considerable effort to strengthen the regulation and supervision of FMIs because of their central role in the financial system.
The key FMIs located in Australia are the Reserve Bank Information and Transfer System (RITS) – which banks and other approved institutions use to settle payment obligations on a real-time basis – and the Australian Securities Exchange (ASX) clearing and settlement (CS) facilities – which facilitate the clearing and settlement of trades in securities and derivatives. A major development for RITS in recent months has been the public launch of the New Payments Platform (NPP) for fast retail payments. The Fast Settlement Service (FSS), a new component of RITS, facilitates the settlement of NPP payments on a 24/7 basis. ‘Box D: The New Payments Platform and Fast Settlement Service’ provides detail on the NPP and FSS and their financial stability considerations.
The Reserve Bank has oversight responsibilities for the stability of FMIs operating in Australia. In carrying out its responsibilities, the Reserve Bank has regard to the strength of FMIs' business continuity arrangements and the management of operational risks. For example, among other things, FMIs are required to operate a secondary site and be able to resume operations within two hours following a disruption to critical information technology systems.
A key measure of the operational resiliency of an FMI is the proportion of normal operating hours during which the system is available. Both RITS and ASX set annual minimum availability targets; the target for RITS is 99.95 per cent of operating hours, while the targets for the ASX's systems range from 99.8 to 99.95 per cent. RITS has exceeded its availability target over the past five years and in 2017 had only 15 minutes of downtime. All key ASX CS systems also met their availability targets in recent years, but there have been several material operational incidents across both ASX's trading and CS facilities. In light of these and a trend of minor incidents, the Reserve Bank and Australian Securities and the Investments Commission (ASIC) encouraged the ASX to commission an external assessment of its operational risk management arrangements. The Reserve Bank and ASIC are reviewing the results of the report and will be assessing ASX's response to the recommendations.
The ASX is planning to replace its core infrastructure for the cash equities market. This is an important project to ensure that the performance, resilience, security and functionality of ASX's systems continue to meet the needs of its users. In early December, the ASX board announced that the replacement system will include distributed ledger technology. As this is new technology, the ASX has taken a cautious approach to develop and test a prototype of the platform, including considering the results of two external security assessments of the prototype platform and consultation with stakeholders. Consultation on the initial scope and implementation plan is expected to commence shortly.
Cyber security is a growing focus for FMIs. In 2017 the Reserve Bank completed its assessment of RITS against international guidelines and is in the process of assessing the ASX. The assessment of RITS did not identify any significant issues, but the Reserve Bank continues to enhance its arrangements to enable RITS to recover from a cyber attack within a short timeframe. In addition, SWIFT, a key global provider of payments messaging infrastructure to the financial industry, is requiring its users to attest annually against a set of security controls it has developed. The Reserve Bank provided its attestation in December 2017.
Footnotes
See Berger-Thomson L and B Chapman (2017), ‘Foreign Currency Exposure and Hedging in Australia’, RBA Bulletin, December, pp 67–76. [1]
See Debelle G (2011), ‘Bank Funding’, Address to the 24th Annual Finance & Treasury Association Congress, Sydney, 19 October. [2]
A detailed discussion of changes in banks' funding costs can be found in McKinnon T (2018), RBA Bulletin, March. Available at <http://www.rba.gov.au/publications/bulletin/2018/mar/developments-in-banks-funding-costs-and-lending-rates.html>. [3]
An IMF study found a Tier 1 capital ratio of 15 to 23 per cent is appropriate for many advanced economies (see Dagher et al (2016), ‘Benefits and costs of bank capital’, IMF Staff Discussion Note SDN 16/04). Australian major banks' Tier 1 capital ratios are about 2 percentage points higher than their CET1 ratios. [4]
APRA (2018), ‘APRA Begins Consultation with ADIs on Revisions to Capital Framework’, Media Release 18.04, 14 February. [5]