RDP 8804: Pricing Behaviour in Australian Financial Futures Markets 5. Specification of Empirical Tests
June 1988
- Download the Paper 943KB
The limited aims of the empirical work reviewed above must be stressed. These papers make no attempt to relate the behaviour of spot and futures prices to market fundamentals, but rather look at specific issues of efficiency and price variability. In what follows, an empirical framework is specified with these same aims in mind.
5.1 Market Efficiency
As is well known, tests of market efficiency must be specified as joint tests of a hypothesis concerning expectations formation, and a hypothesis concerning market attitudes toward risk. Although in some recent work on forward exchange markets (eg. Domowitz and Hakkio (1985), Giovannini and Jorian (1987), Attanasio and Edey (1986)) various forms of risk aversion are allowed for, the more usual (and simpler) approach is to assume risk neutrality. Bilson (1981) has dubbed the joint hypothesis of risk neutrality and rational expectations the “speculative efficiency” hypothesis. The hypothesis asserts that the forward or futures price is an optimal unbiased predictor of the spot price for the contract maturity date.[2] This is written as:

where  is
the futures price at time t on a contract maturing at T
is
the futures price at time t on a contract maturing at T
st is the spot price at time t
Et represents expectations conditional on information available at t.
It is usual for the prices to be measured in logs.
The form of the test used in this paper is dictated by the timing of maturities for the contracts that are normally traded. In the forward exchange markets, the convention is that contracts always mature a fixed period after the transaction date, eg. a one month forward rate is always for delivery (roughly) 30 days after the spot date. This is particularly convenient from the point of view of econometric analysis, since one can define the unit of time to be the same as the contract length, and rewrite equation (1) as:
or, as is now familiar,

where Vt+1 represents the unanticipated component of the change in the spot exchange rate between t and t+1. Equation (2) can readily be made into a regression equation, since under the null hypothesis the error term has the classical properties.
In the futures markets, this pattern cannot be followed because the convention is for all contracts, at whatever time they are initiated, to mature at one of a small number of fixed end-quarter dates. On the SFE this means in practice the end of the current quarter. Prices for the off-months may be quoted on the exchange, but are rarely traded. This means that what is observed is a time series of observations of the form
where T(t) is the standard maturity date for a contract traded at t (i.e. the end of the quarter in which the trade occurs), together with a time series on st.
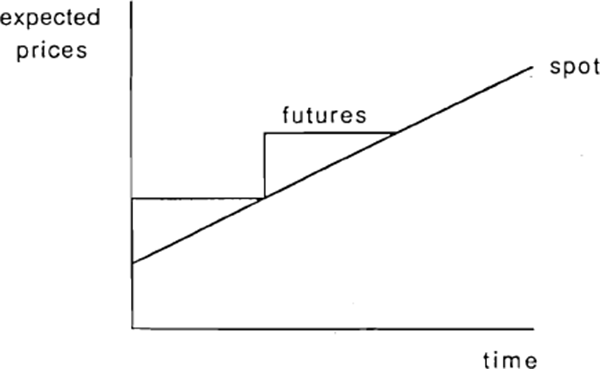
From equation (1), a simple test of efficiency can be proposed based on first differences of the above time series:
The first term on the right hand side of equation (3) represents a revision to expectations; if the market is efficient, this must be orthogonal to any information dated t or earlier. The second term will be identically zero whenever T(t+1) = T(t), which is always true except when t+1 is the first observation of a new quarter. With weekly data, as is used in section 6, this occurs roughly every thirteenth observation. For those observations, the term represents expected capital growth in the spot price between the end of the current quarter and the end of the subsequent quarter. This need not necessarily be zero.
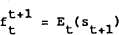
To illustrate this point, it might be expected that the share price index would show an upward drift, reflecting the capitalised reinvestment of earnings, in any sustained period in which the dividend payout ratio is lower than the interest rate. In this case we would expect the systematic component of the futures price to follow the spot price in a step function like that illustrated below, with the spot and futures prices converging at each maturity date.
Systematic changes in the futures price would be zero for observations on which there is no change of contract maturity date, but would jump to reflect the next quarter's expected capital growth each time a new contract is introduced.
In order to test the orthogonality condition given by equation (3), the variable 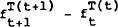 is
regressed on an arbitrary vector of information variables, which includes lagged values of the
dependent variable, and current and lagged changes in spot prices. To account for the effects of
new contracts, a separate new contract dummy is added for each contract. Thus the efficiency
hypothesis is tested using regression equations of the form (deleting superscripts)
is
regressed on an arbitrary vector of information variables, which includes lagged values of the
dependent variable, and current and lagged changes in spot prices. To account for the effects of
new contracts, a separate new contract dummy is added for each contract. Thus the efficiency
hypothesis is tested using regression equations of the form (deleting superscripts)

| where Zt is the arbitrary information vector |
| dit is the “new contract” dummy for the ith new contract |
| (dit = 1 in the first week of the ith quarter = 0 otherwise). |
Under the null hypothesis of efficiency, α = 0 and β = 0.
A special case of equation (4) is to include information about time to maturity in the information set Zt. Specifically, since it is known that the futures premium must converge to zero at each maturity date, it might be hypothesised that this predicted convergence may help to predict movements in the futures price. To test this conjecture an AR(1) model of the premium scaled by time to maturity is specified as follows:

where fpt is the proportionate futures premium (log futures price minus log spot price)
nt is the number of periods to maturity of a contract traded at t.
An estimate of equation (5) can be used to obtain an instrument for the predictable change in
the premium ( − fpt),
which can then be used in the information set Zt in tests of equation (4).
− fpt),
which can then be used in the information set Zt in tests of equation (4).
5.2 Volatility
For the purposes of this paper, volatility is defined using the average squared weekly price movement. This is roughly equivalent to the conditional variance of the price innovation in each period, since the time series evidence suggests that spot prices are approximately represented by random walks. Three hypotheses concerning the impact of futures trading on spot price volatility will be investigated.
- Futures trading volume “causes” spot price volatility, measured by (st+1 − st)2.
- Futures price volatility (ft − ft−1)2 “causes” spot price volatility.
- Futures price innovations (in levels) lead spot price innovations.
All three hypotheses are tested using Granger-causality methods. Granger (1969) proposed that causality be tested by estimation of the following pair of OLS regressions:
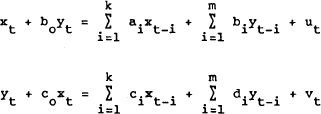
where ut and vt are white noise series and are uncorrelated. The variable yt is said to Granger cause xt if any of the b coefficients are statistically significant (causality is instantaneous if bo is significant). The reverse causality is tested in the second equation, using the c coefficients.
Footnote
The terms “forward” and “futures” are used interchangeably here. Strictly speaking the two types of contract may have slightly different theoretical prices due to the effect of the deposit and margin system on the profitability of a futures contract. [2]