RDP 9003: The Balance of Payments in the 1980s V. Relative Prices and Resource Shifts
June 1990
- Download the Paper 2.3MB
This section brings together the earlier findings and examines how relative prices and resources have shifted in response to the various disturbances.
(i) The Real Exchange Rate, Relative Prices and Trade Volumes.
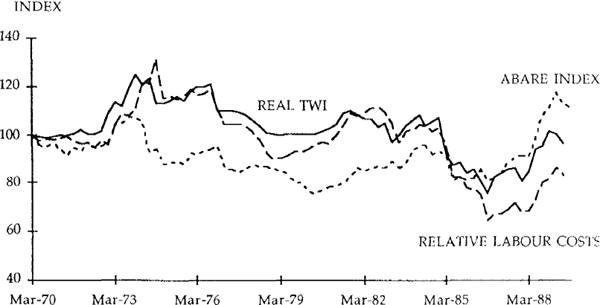
The factors influencing the current account changed during the course of the decade. To recap: at the beginning of the decade the large rise in investment resulted in a rise in the current account deficit. The recession of 1982 brought temporary relief, but the expansion of fiscal policy and the economic recovery saw the current account widen. Beginning in 1985 there was a large fall in the terms of trade. Fiscal policy was tightened. The potential effects of this tightening on the current account were offset, after 1987, by a rise in investment and the terms of trade. To slow the economy, monetary policy was tightened, beginning in April 1988. Figure 19 plots a number of measures of the real exchange rate.[47]

The perceived increase in the rate of return to Australian capital and the rise in domestic expenditure in the late 1970s/early 1980s contributed to a nominal and real exchange rate appreciation. During most of this period long-term real interest rates in Australia were relatively high (see Figure 18). Investment peaked in 1981/82 and the economy contracted in 1982/83. The interest differential reversed and the exchange rate depreciated. These developments were quickly offset by a large expansion of fiscal policy. As a result of the above factors the real exchange rate remained, on average, above its level of mid-1979 for about six years.
This reduction in competitiveness and rapid expenditure growth (punctuated by the effects of the 1982/83 recession) resulted in rapid import growth and subdued exports, (although exports were also constrained by the domestic drought and slow world growth).
The sharp fall in the nominal and real exchange rate commencing in 1985 and its subsequent rise corresponded to large movements in the terms of trade. The reduction in the real exchange rate in 1985/86 and the tight demand management policies tended to constrain imports through 1985/86 and 1986/87. Export values, and particularly volumes, began to pick-up relative to GDP. These developments were offset as the rapid rise in investment and the tightening of monetary policy through 1988 and 1989 led to a relative rise in Australian real interest rates that reinforced the effects of the terms of trade on the real exchange rate. The real exchange rate began to appreciate in 1987. This, coupled with rapid expenditure growth, led to a substantial rise in imports.
The importance of demand and relative prices (the price of domestically produced goods relative to the price of imports) as determinants of endogenous imports is illustrated in Figure 20. Most Australian studies, for example, Horton and Wilkinson(1989), find an income elasticity of imports greater than one in both the short and long run. Typically, the relative price elasticity is significant and less than one. Relative prices tend to move pro-cyclically, suggesting that excess demand pressures and the monetary response to them are manifest in a higher real exchange rate.

Figure 21 plots export and import prices relative to the GDP deflator. These relative price terms may be viewed as an adjunct to the more widely used measures of competitiveness. For instance, a rise in import prices relative to domestic prices may encourage firms into the import-competing sector and shift demand toward domestically-produced goods. Both import and export prices fell relative to domestic prices during the 1960s. This fall ended in the mid-1970s and both measures rose until the beginning of the 1980s. During the 1980s export prices fell relative to domestic prices. The effects of the large depreciation commencing in 1985 offset a fall in export prices in foreign currency terms. The subsequent rise in export prices in foreign currency terms was, again, offset by the appreciation of the Australian dollar. Import prices have also fallen relative to domestic prices over the decade. The sharp rise in import prices in the mid 1980s coincided with the depreciation. An appreciation of the exchange rate contributed to the relative fall in import prices from 1987. The data suggest that the effects of the earlier depreciation on competitiveness have now been largely eroded.

(ii) Traded and Non-Traded Goods
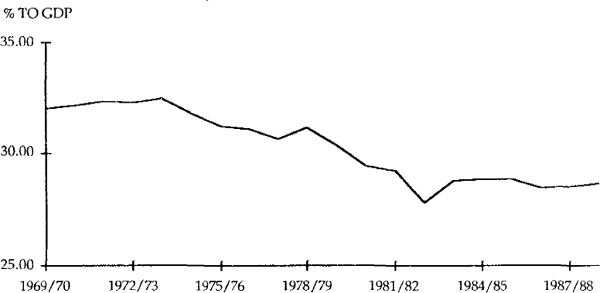
What do these relative price movements imply for resource shifts between the traded and non-traded goods sectors? Figure 22 plots the tradable goods sector's share of GDP.[48] The share of the traded goods sector in GDP has fallen since the mid 1970s. The decline was particularly rapid between 1974/75 and 1982/83. The apparent trend decline in the tradeables share of GDP appears to have been halted in the early 1980s. Its share has risen a little since then.

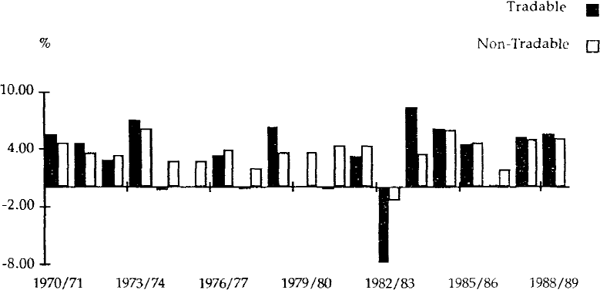
Figure 23 plots the same story in the form of the rate of growth of real output of the two sectors. In only three of the nine years between 1974/75 and 1982/83 did the tradable goods sector experience output growth. In contrast, the non-traded sector continued to experience solid growth throughout this period. Since 1983/84 output growth of the traded goods sector has slightly exceeded that of the non-traded goods sector.

The behaviour of the traded goods sector has tended to reflect movements in relative prices. The fall in traded goods production between 1974/75 and 1977/78 occured after a large and sustained appreciation of the real exchange rate. The manufacturing sector (which is largely import-competing) was the main factor behind the decline in the tradables sector in that period. Manufacturing output fell in three of the four years between 1974/75 and 1977/78. This is not surprising given that the ratio of import prices to domestic prices (Figure 21) was very low. As import prices rose towards the end of the 1970s manufacturing output recovered. It subsequently slowed in the early 1980s before falling in 1982/83.
The depreciation of the exchange rate, coupled with real wage moderation, has contributed to the recovery in manufacturing output in the past few years. This, in turn, was the major factor underlying the output growth of the tradable sector since 1984/85. However, as a result of the appreciation since 1987 import prices are now at historically low levels relative to domestic prices. To the extent that these relative prices measures are indicative of the incentive to shift resources into the traded goods sector the prospects for a further shift of resources to this sector may be limited. This observation is consistent with the recent behaviour of investment in the traded goods sector.[49] It appears that the proportion of investment going to the tradables sector rose after the large depreciation but has subsequently fallen as the exchange rate has appreciated.
Footnotes
One measure adjusts the nominal TWI by relative consumer prices while the other adjusts the nominal TWI by relative unit labour costs. The ABARE index attempts to measure the ratio of non-traded to traded goods prices directly by constructing indexes of traded aand non-traded goods prices. [47]
While it is difficult to distinguish clearly between the traded and non-traded goods sectors, for present purposes the tradables sector is defined as the sum of the mining, agriculture and manufacturing sectors. The data in the graph are in constant prices. A similar trend is evident in the current price data. However, there are large fluctuations about that trend reflecting changes in export prices relative to domestic prices. [48]
Conclusions about the amount of investment in the traded goods sector depend on the data sources used and the classification of what should be included in that sector. See BIE(1989) and Treasury(1989). [49]